AN ANALYSIS
OF HEALTH
PROGRESS
IN CHILE1
Ernest0 Medina
L.* and Ana M. Kaempffer
R.3
Death rates in many Latin American countries, including Chile, have fallen sharpb in recent decades. This article examines the Chilean data available in an effort to better understand this favorable trend.
Introduction
Over the past two decades, information from many developing countries has shown a clear decline in the risk of death, suggesting that the most serious health problems are being adequately controlled, and that in time the population’s level of health will improve. In this vein, data reported by the Pan Ameri- can Health Organization indicate that general mortality in Latin America has declined from 12-13 deaths per thousand inhabitants in 1955-1960 to 8-9 deaths per thousand in the latter 1970s (I), a good part of the decline be- ing due to higher rates of survival in the first years of life. In this regard, again according to PAHO (Z), infant mortality in South America fell from 85 deaths per thousand live births in
1960 to 49 per thousand live births in 1975. In other words, within a relatively short span of years significant reductions in the risk of dy- ing have occurred.
Chile has been no exception to this Latin American trend. That is, over the past 20 years (between 1961 and 1981) general mor- tality in Chile fell by some 47 per cent (from 11.6 deaths per thousand population in 1961 to 8.7 in 1971 and 6.2 in 1981), while infant mortality declined by 75 per cent (from 108.9
‘Also appearing in Spanish in the Boleh’n de la Oficina Sanitaria Pammczicana, 95(1):21-34.
ZDirector, School of Public Health, Faculty of Medicine, University of Chile, Santiago, Chile.
3Chief, Division of Preventive Medi&e and Maternal and Child Health, School of Public Health. University of Chile.
deaths per 1,000 live births in 1961 to 70.5 in 1971 and 27.2 in 1981).
A number of circumstances make Chile a suitable place for studying the factors leading to these favorable developments. National in- formation is available-including reasonably reliable data on the magnitude of health prob- lems, the risks of dying, and the collection of conditioning factors affecting health. The availability of such general information is enhanced by the country’s relatively small population (11.3 million people according to the national census of 1982), the high propor- tion of people living in urban areas (81 per cent in 1982), the absence of settled but hard- to-reach geographic areas, and the length of time that biodemographic registers and Chile’s National Statistical Institute have been established (3). Furthermore, informa- tion about health, the operation of the health care system, services provided to individuals, and environmental health services is available because of the way the health system is orga- nized, depending primarily as it does upon the Ministry of Health’s National System of Health Services, which possesses 90 per cent of the hospital beds and delivers outpatient services to some 85 per cent of the national population (4, 5).
Health Status Indicators
Mortality
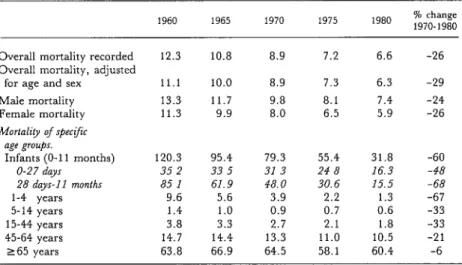
Table 1 shows changes in mortality in Chile between 1960 and 1980. During that period
222 PAHO BULLETIN ’ vol. 17, no. 3, 1983
Table 1. Mortality in Chile per 1,000 population, by age and sex, 1960-1980.
1960 1965 1970 1975 1980 % change
1970-1980
Overall mortality recorded Overall mortality, adjusted
for age and sex Male mortality Female mortality Mortality of spec;f;c
age groups. Infants (O-l 1 months)
O-27 day 28 days-l 1 months l-4 years 5-14 years 15-44 years 45-64 years 265 years
12.3 10.8 8.9 7.2 6.6 -26
11.1 10.0 8.9 7.3 6.3 -29
13.3 11.7 9.8 8.1 7.4 -24
11.3 9.9 8.0 6.5 5.9 -26
120.3 95.4 79.3 55.4 31.8 -60
35 2 33 5 31 3 24 8 16.3 -48
85 1 61.9 48.0 30.6 15.5 -68
9.6 5.6 3.9 2.2 1.3 -67
1.4 1.0 0.9 0.7 0.6 -33
3.8 3.3 2.7 2.1 1.8 -33
14.7 14.4 13.3 11.0 10.5 -21
63.8 66.9 64.5 58.1 60.4 -6
there was a sustained decline in the overall risk of dying, adjusted by age and sex, amounting to a 20 per cent reduction in the 1960s and a 29 per cent reduction in the 1970s.
If attention is focused on specific age groups, it can be seen that the most significant reductions, especially in 1970-1980, occurred in the infant and l-4 year age groups. Spe- cifically, infant mortality fell 60 per cent in this latter period and young child mortality dropped 67 per cent. Lesser declines were also
registered for the 5-14, 15-44, and 45-64 age groups, but for the group 65 and over the re- duction in the risk of dying was relatively slight. Overall, the improvements were not sex-specific; for even though the risk of death in 1970 was 20-25 per cent higher for males than for females, the declines registered for both groups over the decade were similar. In general, it may be concluded that marked health improvements, in both absolute and relative terms, occurred among infants and among children l-4 years of age.
Table 2. General and infant mortality in regions of Chile classified according to the percentage of people living in “urban” areas.
General mortality (deaths per 1,000 inhabltants) Infant mortality (deaths per 1,000 hve births) 1982
% of population Ill populatm Change % Change %
urban areas (m thousands) 1970 1980 in rate change 1970 1980 in rate change
95% urbana 90-94s urban b 70-89s urbane 50-59s urban d
Total (all of Chile)
4,295 7.8 5.8 -2.0 -26 51 22 -29 -57
930 8.2 6.4 -1.8 -22 62 29 -33 -53
3,206 8.8 7.0 -1.8 -20 79 40 -39 -49
2,844 10.4 7.6 -2.8 -27 94 39 -55 -59
11,275 8.9 6.6 -2.3 -26 79 32 -47 -59
aMetropolitan region of Santiago.
Medina and Kaempffer l HEALTH PROGRESS IN CHILE 223
As in many developing countries, mortality risks appear associated with areas of residence and appear greater in regions where a higher proportion of the population is rural. For census purposes, all localities in the country with concentrated populations, paved streets, and some public utilities are considered ur- ban. According to our observations, this is roughly equivalent to considering every locali- ty with a population of 1,000 inhabitants or more urban, the margin of difference between these two criteria being less than 1 per cent of the population. As indicated in Table 2, from 1970 to 1980 mortality was most sharply re- duced in those areas classified as 50-59 per
cent urban, the most rural areas covered. This finding is probably attributable to a policy adopted by the Ministry of Health that has provided a large number of rural communities with basic services-through rural health posts manned by nursing auxiliaries and peri- odically visited by a midwife, a university- trained nurse, and a physician.
Morbidity
As in many parts of the world, information based on systematic studies of the frequency of disease in the general Chilean population is not available. The existing data are based on
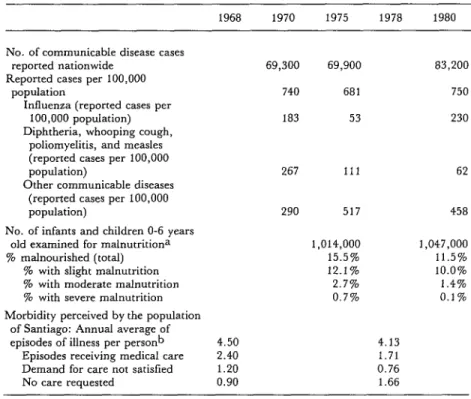
Table 3. Morbidity indicators in 1970, 1975, and 1980: Reported communicable disease cases; the prevalence of malnutrition among infants and young children; and the
disease case rates perceived by inhabitants of Santiago.
1968 1970 1975 1978 1980
No. of communicable disease cases
reported nationwide 69,300 69,900 83,200
Reported cases per 100,000
population 740 681 750
Influenza (reported cases per
100,000 population) 183 53 230
Diphtheria, whooping cough, poliomyelitis, and measles (reported cases per 100,000
population) 267 111 62
Other communicable diseases (reported cases per 100,000
population) 290 517 458
No. of infants and children O-6 years
old examined for malnutritiona 1,014,000 1,047,000
% malnourished (total) 15.5% 11.5%
% with slight malnutrition 12.1% 10.0%
% with moderate malnutrition 2.7% 1.4%
% with severe malnutrition 0.7% 0.1%
Morbidity perceived by the population of Santiago: Annual average of
episodes of illness per person b 4.50 4.13
Episodes receiving medical care 2.40 1.71
Demand for care not satisfied 1.20 0.76
No care requested 0.90 1.66
‘Children checked by the National Health Service and classified according to the Sempe table (normai = less than one standard deviation below the norm; shght malnutrition = at least one but less than two standard deviations below the norm; moderate malnutrition = between two and three standard deviations; and severe malnutrition = more than three standard devia- tions.)
224 PAHO BULLETIN l vol. 17, no. 3. 198.3
notifications of infectious disease cases; on data from regular checkups given some four- fifths of the child population under six years of age by the National Health Services System; and the results of household surveys carried out by the Ministry of Health at the end of the 1960s (6) and by ourselves a decade later (7-11). A summary of this information ap- pears in Table 3. As may be seen, unlike the sharp decline in mortality, morbidity due to reported infectious disease cases showed no overall decline, even though a sharp decline was registered in infectious disease cases con- trolled by vaccination (those covered by the PAHO/WHO Expanded Program on Immu- nization). Along similar lines, overall per- ceived morbidity only declined about 10 per cent in terms of the number of illness episodes involved. Even the somewhat greater reduc- tion of malnutrition (26 per cent) among in- fants and young children was small compared to the sharp drop in mortality among this age group; it should be noted, however, that substantial progress was made in reducing moderate and severe cases of infant and young child malnutrition.
Major Health Problems
Changes in the impact of major pathologies can be judged by assessing the number of hos- pital admissions for various causes and overall mortality from those specific causes. Table 4 provides such data, starting with hospital ad- missions for specific causes in 1965 and then in 1975 (the last year for which detailed infor- mation is available). It also shows the mortali- ty attributed to each cause in 1970 and 1980. These data show that overall hospitalization rates changed little in 1965-1975, falling 3.9 per cent, while mortality (see Table 1) de- clined sharply. Thus, the decline in mortality cannot logically be attributed to increased hospital admissions (increased secondary and tertiary care), since no such increase was ob- served. Examination of the disease-specific mortality figures indicates that of the path-
ologies listed in Table 4, the mortality at- tributed to eight fell by more than 20 per cent in 1970-1980 (see Table 4, groups l-3), mor- tality from 17 others (groups 4-6) changed by 20 per cent or less, and mortality from one cause (lung cancer) rose by over 20 per cent.
What this shows is that mortality due to certain problems-especially communicable diseases, malnutrition, maternal problems, and stomach cancer-has dropped sharply, while mortality caused by an extensive range of other problems, most of them of a chronic nature, has remained relatively stable. The implication is that health efforts made or stra- tegies pursued to combat these latter problems have failed to greatly modify the mortality in- volved.
Mental Health
By and large, it is difficult to quantify the mental health status of any group unless data on reliable and representative indicators are available. In Chile, information is available only on mortality caused by problems whose genesis normally involves a change in mental health. This happens in the case of alcoholism and cirrhosis of the liver, the latter generally being caused in Chile by excess alcohol con- sumption. Accidents and violent acts have also been associated frequently in this country with excess alcohol consumption and emotional disturbances. In addition, arterial hyperten- sion, peptic ulcer, and bronchial asthma are known to have important psychosomatic com- ponents.
Medina and Kaempffer l HEALTH PROGRESS IN CHIL.E 22.5
Table 4. Frequency of hospitalization and death in Chile from the most common types of diseases, 1965-1980 (rates per 100,000 population). Rates changing by less than
20 per cent over the periods cited are considered “stable.” Rates per 100,000 population Hospitalizations Deaths
1965 1975 1970 1980
I. Both hospitalizations and mortali& decreasmg: Measles
Rheumatic heart disease Maternal causes
65 60 2,570
Abortions .688
37 6.4 0.1
36 7.0 4.8
1,792 4.7a i.7a
433 i.8b o.6b
II. Hospitalizations stable and mortali@ decreastng: Cancer of the stomach
Influenza and other upper respiratory viruses III. Hospitaltzations increasing and mortality
decreasing.
26 27 33 23
194 164 20 6
Infant diarrheas 295 373 50 8
Malnutrition 17 44 12 2.2
IV. Hozpita1ization.r decreasing and mortali& stable:
Appendicitis
Coronary heart disease Typhoid
V. Both hospitalizations and mortali@ stable: Adenoid and tonsil pathologies Arterial hypertension
Arthritis and rheumatism Cirrhosis of the liver Chronic glomerulonephritis Neuroses
Trauma
234 186 1.0 0.8
64 45 64 58
77 57 1.0 1.1
102 102
53 56
77 63
49 48
20 22
98 114
680 676
10 2.7 31
4.9 1.6 86
- 9 2.4 30
5.2 1.9 79 VI. Hospitalizations increasing and mortahp stable:
Chronic bronchitis Stroke
Psychosis Diabetes mellitus
Respiratory problems of the newborn Cervical cancer
Breast cancer Esophageal cancer
VII. Both hospitalizations and mortality increasmg: Lung cancer
128 160 9.5 a.4
51 64 59 61
49 61 1.0 1.2
30 47 10 12
22 84 19 17
27 35 6.3 6.4
12 17 4.6 5.2
6.4 7.8 5.4 5.0
6.5 9.2
9,221
7.6 9.7
660
Total 9,595 890
226 PAHO BULLETIN l vol. 17, no. 3, 1983
Table 5. Deaths per 100,000 inhabitants attributed to pathologies linked with mental health problems in Chile, 1970-1980.
Deaths per 100,000 in:
1970 1975 1980 % change 1970-1980
Alcoholism 1.6 1.6 1.9 + 19
Cirrhosis of the liver 30.8 26.1 29.6 -4
Traffic accidents 15.7 9.1 12.9 -18
Suicide 6.1 6.7 4.9 -20
Homicide 3.6 2.1 2.6 -28
Other accidents 2.4 2.0 1.7 -29
Arterial hypertension 10.0 9.5 8.8 -12
Peptlc ulcer 3.4 3.2 2.7 -21
Bronchial asthma 2.8 1.9 1.8 -36
aforementioned conditions associated with Factors Involved in Reduced Mortality mental problems decreased during the decade
(Table 5).
Per Capita Income Overview
Improvements in Chilean health over the past decade were reflected principally in re- duced mortality, especially among infants and children under five years of age. This dramatic decline in infant and young child mortality has been due primarily to progress made against malnutrition and infectious diseases, including infant diarrheas (12-14).
By comparison, the progress made in re- ducing mortality among other age groups has been rather small. Moreover, the declines in mortality were not accompanied by significant declines in the general morbidity perceived by the population, or in the morbidity at- tributed to an important group of diseases that preferentially afflict adults and that tend to produce chronic conditions. Regarding men- tal health, the information available does not make it possible to accurately determine changes during the decade, especially since a decline in mortality from conditions associated with mental problems is not necessarily asso- ciated with a decline in the morbidity due to mental illness.
Studies in Chile (1518), as well as world- wide experience, have generally shown an in- verse relationship between the economic situa- tion of a community (as indicated by per capita income) and mortality in that com- munity. However, this relationship does not appear to explain the sustained drop in mor- tality in Chile during the period 1970-1980. It is true, as Figure 1 shows, that between 1940 and 1970 the traditional inverse association between per capita income and mortality was apparent, and that periods of rising per capita income saw declines in mortality-declines that tended to level off in periods of economic stagnation.
Medina and Kaemuffer l HEALTH PROGRESS IN CHILE 227
Figure 1. A comparison of per capita income, infant mortality, and general mortality in Chile from 1940 through 1980.
16 160
120
100
a0 60
40
20
0
evidence strongly supports the hypothesis that of the marked changes in mortality occurring in the 197Os, neither the 26 per cent decline in general mortality nor the 60 per cent drop in infant mortality were associated with changes in the country’s general economic condition. Health Care
Since the 196Os, Chilean health policy has assigned top priority to maternal and child health, emphasizing periodic checkups for expectant mothers, infants, and young chil- dren, together with establishment of periph- eral centers to provide outpatient care (19). This policy, which is still in force, was charac- terized in the 1970s by increased emphasis on maternal and child health, extension of health services coverage, and augmentation of ser-
vices provided through the combined activi- ties of professional personnel and health aux- iliaries (20, 21).
228 PAHO BULLETIN l vol. 1% no. 3, 1983
Table 6. Indicators of pediatric health care in Chile, 1970 and 1980.
1970 1980
I. Coverage mdicators.
% dehveries provided with professional care (physician or university-trained midwife)
%fatalities receiving a physician’s death certificate % of infant population receiving growth and development
checkups II. Medical care indicators,
Pediatric beds per 1,000 children < 15 years old
Hospital pediatric dwcharges per 1,000 children < 15 years old
Pediatric consultations provided by the National Health Sys- tem per 1,000 children < 15 years old
III, Indicators of care by health penonnel other than physictam: Pediatric consultations per live bwth provided by university-
trained midwives
Pediatric consultations per child < 15 years old provided by university-trained nurses
Pediatric consultations per 1,000 children < 15 years old pro- vided by nutritionists
Pediatric consultations per child < 15 years old provided by nursing auxiliaries
IV. Indicators of health promotion and development.
BCG vaccinations in the first year of life as a percentage of live births
Poliomyehtis (3rd dose) vaccinations in the first year of life as a percentage of live births
DPT vaccinations (3rd dose) in the frst year of life as a per- centage of live births
Measles vaccinations in the first year of life as a percentage of live births
Kilograms of powdered milk provided annually by the sup- plementary feeding program per child under 5 years of age Users of contraceptives in the National Health Service
system (percentage of women 15-44 years old)
81.0% 91.4% 81.4% 90.4% 60.2% 84.7%
0.66 0.67
47 64
990 1,740
5.2 13.4
0.29 0.71
No data 0.88 No data 0.53
70.0% 93.4% 69.3% 82.4% 76.0% 90.9% 71.0% 96.2%
2.9 3.2
13.2% 19.2%
nutritionists) and auxiliary nursing personnel; in which high levels of coverage were achieved with the vaccinations called for by the Ex- panded Program on Immunization and with the food supplements provided by the supple- mentary feeding program; and in which in- fants received increased hospital care in addi- tion to the attention provided through the sig- nificantly expanded program of primary care. Two basic recommendations for improv- ing infant health are to extend primary health care services and to improve the quality of the health activities involved. This point has been supported in Chile by investigations
(22-24) showing that low infant mortality in Chilean communities is associated in a statisti- cally significant way with extension of cover- age, per capita availability of medical services, and a low prevalence of infant malnutrition (Table 7).
Medina and Kaempffer l HEALTH PROGRESS IN CHILE 229
Table 7. Correlations between infant mortality and a variety of factors in the various regionsa of Chile.
-0.87 -0 81 -0.63 -0 61
+ 0.60 -0.56 -0.46 -0.31 -0.09
% of deliveries attended by health profes- sionals
% of infants provided with medical care for their last illness
Pediatrx hours per 1,000 children under 15 years of age
No of health checkups per child under 15 years of age conducted by a physi- cian
Prevalence of moderate and advanced malnutrition
Number of consultations about morbidi- ty per chJd
Average wage of workers and employees Number of hospital discharges per 100
children
Number of pediatric beds per 100 cl& dren
aSee Table 2. footnotes a-d
Taken together, these facts lead to the con- clusion that adequate allocations of resources for public health, which has made it possible to extend health coverage and increase infant health services (especially primary care ser- vices), appear to be the factors most responsi- ble for the recent reduction of infant mortality in Chile.
Other Factors
Other factors significantly associated with infant risk, according to our studies (Z,?J, are the mother’s level of education (-0.81) and home sanitation (-0.76). Both of these circum- stances have improved over the past decade (24). In 1980 approximately 90 per cent of the female population over five years of age was literate; and 96 per cent of the children in the appropriate age groups were receiving basic education in grades one through eight, as compared to 87 per cent in 1970. Equally im- portant, the percentage of children receiving a high-school education (in grades nine through 12) rose from 41 per cent in 1970 to 57 per cent in 1980. This high proportion of children
receiving a secondary education has particular significance for health, because it has been shown that, in general, only those with access to this level of education find it possible to change the traditional beliefs about health that are passed on by their elders.
The health of Chilean children has also been enhanced by family planning programs, most of which have been organized and ad- ministered by the National Health Services System. These programs began around 1964; since then they have produced significant changes and a parallel decline in the annual number of births. (More specifically, the number of births fell from 308,014 in 1965 to 253,581 in 1980, these numbers being equiva- lent to 36.3 and 22.8 births per 1,000 inhabit- ants, respectively). As a result of this decline in the birth rate, the absolute number of chil- dren born each year has been relatively stable, while the average family’s size has decreased from 5.24 members (in the 1970 census) to 4.49 members (in the 1982 census). Further- more, births are occurring less frequently among women over 35 years of age and among multiparas. Specifically, women over 35 accounted for 17.6 per cent of all births in 1965, as compared to 9.4 per cent in 1980; and 32.6 per cent of all births were fifth or subsequent deliveries in 1965, as compared to only 8.8 per cent in 1980. It is noteworthy that the percentage of children born to mothers with a secondary education or better rose from 22 to 39 per cent in this period. Since mater- nal age, multiparity, and maternal education have all been shown to have an important in- fluence upon infant mortality in Chile (20), it seems clear that the changes in these factors wrought by th.e family planning programs have contributed significantly to the marked decline in infant mortality (2.5).
230 PAHO BULLETIN l vol. 17, no. 3, I983
what they would have been at the end if some particular factor had not changed. The dif- ference between this estimated rate and the ac- tual rate then indicated the extent to which the actual decline could be attributed to that fac- tor. Between 1969 and 1979 the actual rate decreased by 45.2 points. Changes in the mother’s age appear to have accounted for 0.7 per cent of the total change in infant mortali- ty; changes in family size appear to have ac- counted for 5.4 per cent; and changes in maternal education appear to have accounted for 26 per cent. This latter finding is related to the fact that the largest relative birth-rate declines have occurred among population groups with the least education.
We ourselves have noted that maternal age and family size have an important bearing on the demand for medical care. That is, mor- bidity studies we conducted in Santiago (9, 11) showed that children of women 15-24 years old, adjusted by the family group’s size and children’s age, received health care an average of 5.0 times annually, whereas chil- dren of women over 44 years old received such care an average of only 1.2 times annually. Similarly, when there was only one child in the household, it received care an average of 6.3 times annually, while a child belonging to a family with four or more other children re- ceived care an average of 0.9 times annually.
As indicated earlier, in Table 2, the rate of infant deaths in Chile, by region, appears to be associated with the proportion of the re- gional population living in rural areas. It thus appears that the phenomenon of increasing urbanization (the urban percentage of the population rose from 76 per cent in 1970 to 81 per cent in 1982), through various mecha- nisms, has been having favorable effects on in- fant health.
Comments and Conclusions
As Figure 2 illustrates in a general way, the most important factors promoting public health tend to vary according to the affected
population’s standard of living. Where there are very precarious conditions of development and high health risks (as at point A in the figure), organized health care does not pro- duce satisfactory results because of serious limitations imposed by low family income, unsatisfactory environmental conditions, and lack of individual education. When these limi- tations are partially overcome (as at point B), the most important factor promoting health is the appropriate organization of health care services, with emphasis on the extension of coverage and development of primary health care. Nevertheless, after a certain point, as in many developed countries at present, further expansion of health services will not solve prevalent community health problems asso- ciated with harmful habits and customs or with radical ecological changes present in the industrialized world (see point C in the figure).
Overall, the available health indicators show that most of Latin America is between points A and B. The Chilean case, which can be studied and analyzed in some detail be- cause appropriate information is available, il- lustrates this intermediate stage of health de- velopment, a stage in which the isolated factor of greatest importance for progress is the ade-
Figure 2. A schematic diagram of principal
factors promoting improved health as time
passes, under differing living conditions
quate organization and administration of health services. In this particular case, accord- ing to the results of our study, the country has continued to make progress in health as a result of the improved organization of health care, particularly in the area of maternal and child health. Our findings also demonstrate that when the organization of health care is making good headway-with integrated ser- vices providing high levels of primary care coverage, with key maternal and child health care activities increasing, and with referrals to secondary and tertiary care levels being made as needed-it is possible to successfully con- front serious economic vicissitudes while con- tinuing to improve maternal and child health.
It also appears that mortality in Chile has exhibited a much more pronounced decline than morbidity, and that this progress in re- ducing mortality has been especially marked in the O-5 year age group. This fact is impor- tant for various reasons-among other things because once infant and young child mortality has been reduced to relatively low levels, such mortality no longer provides a good indicator of the overall health situation. It must also be recognized that reductions in mortality do not necessarily go hand in hand with reduced morbidity; and if morbidity remains high it will be necessary to maintain and even strengthen the health services required to deal with that situation.
Medina and Kaempffer l HEALTH PROGRESS IN CHILE 231
SUMMARY
Over the past two decades, information from many Latin American countries has shown a clear decline in general mortality. Chile’s recent history exemplifies this trend, and the availability of rela- tively complete Chilean data provides a good basis for more detailed evaluation.
Adjusting for age and sex, overall mortality in Chile fell by 20 per cent in the 1960s and 29 per cent in the 1970s. However, the most marked de- clines, especially in the latter decade, occurred among infants (a 60 per cent reduction) and chil- dren 1-4 years old (a 67 per cent reduction). In con- trast, morbidity indicators suggest that overall mor-
bidity declined little, although considerable reduc-
tions were observed in infectious disease cases pre- ventable by immunization as well as in moderate and severe cases of malnutrition.
Data on deaths attributed to specific causes show
that mortality due to certain causes-including communicable diseases, malnutrition, maternal problems, and stomach cancer-dropped sharply, while mortality caused by a wide range of mostly chronic problems remained relatively stable. This
implies that the health efforts made to combat those latter problems failed to greatly modify the mortali- ty involved.
An examination of the factors responsible for the dramatic drop in infant and young child mortality suggests that changes in per capita income played no major role. Instead, the available evidence strongly supports the idea that a notable extension of coverage provided by the Chilean health ser- vices, especially primary care and infant-oriented health services, was principally responsible for this rapid decline of infant and young child mortality.
REFERENCES
(I) Pan American Health Organization. Annual dios estadisticos. Santiago, 1970- 1981.
Re,f~ort of the Director, 1980. PAHO Official Docu- (4) Ministerio de Salud, Chile. Annual health ment No. 177. Washington, D.C., 1981. statistics reports entitled Egresos hospitalarios, Naci-
(2) Pan American Health Organization. Health mientos, Defunciones, Enfermedades de notificacidn obliga- Conditions in the Americas, 1973-1976. PAHO Scien- toria, and Atenciones y recursos. Santiago, 1960-1980. tific Publication No. 364. Washington, D.C., 1978. (5) Comision National para Alimentacibn y
232 PAHO BULLETIN l vol. 17, no. 3, 1983
en salud: Un modelo de analisis. Imprenta Central de Talleres de1 Servicio National de Salud, Santiago, 1970.
(7) Medina, E., and A. M. Kaempffer. Morbili- dad y atencion mtdica en el Gran Santiago. Rev Med Chil 107:155, 1979.
(8) Medina, E., and A. M. Kaempffer. Carac- teristicas de la atencion de salud en el Gran Santia- go. Rev Med Chil 108:937, 1980.
(9) Kaempffer, A. M., and E. Medina. Morbili- dad y atencion mtdica infantil en el Gran Santiago. Rev Chil Pediatr 51:355, 1980.
(10) Medina, E., and A. M. Kaempffer. Aten- ci6n medica, nivel de vida y salud infantil. Minutes of I Jornadas Nacionales de Salud Publica. Ediciones Escuela de Salud Publica, Universidad de Chile, Impr. Caballero, Santiago, 1981, p. 23.
(11) Kaempffer, A. M., and E. Medina. Inves- tigaciones de morbilidad infantil en el Gran Santia- go. Minutes of I Jornadas Nacionales de Salud Priblica. Ediciones Escuela de Salud Publica, Universidad de Chile, Impr. Caballero, Santiago, 1981, p. 18.
(12) Kaempffer, A. M. Evolution de la salud materno-infantil en Chile, 1952-1977. Rev Med Chil 105:680, 1977.
(13) Solis, F., B. Castillo, and G. Mardones. Mortalidad infantil en Chile por grupos de causas evitables en 10s 27 servicios de salud de1 pais. Minutes of I Jornadas Nacionales de Salud Ptiblica. Edi- ciones Escuela de Salud Pdblica, Universidad de Chile, Impr. Caballero, Santiago, 1981, p. 20.
(14) Castillo, B., G. Mardones, and F. Solis. Factores de salud asociados a la mortalidad infantil chilena por causas evitables, 1979. Minutes of I Jor- nadas Nacionales de Salud Publica. Ediciones Escuela de Salud Publica, Universidad de Chile, Impr. Ca- ballero, Santiago, 1981, p. 22.
(15) Behm, H. Mortalidad infantil y nivel de vida. Universidad de Chile, Santiago, 1962.
(16) Behm, H. Mortalidad infantil en Chile: Tendencias recientes. Cuadernos Medico So&ales 11 (3):7, 1970.
(17) Legarreta, A. Factores condicionantes de la mortalidad en la niiiez. In M. Livingstone and D. Raczynski (eds.). Salud publica y bienestar social. Edi- ciones CIEPLAN, Universidad Catolica de Chile, Santiago, 1976.
(18) McCormick, M., S. Shapiro, and S. D. Horn. The relationship between infant mortality rates and medical care and socioeconomic varia- bles: Chile 1960-1970. J Epidemiol 8:145, 1979.
(19) Medina, E. Evolution de la salud publica en Chile en 10s ultimos 25 aiios. Rev Med Chil 105: 739, 1977.
(20) Medina, E. El desarrollo de1 sistema de ser- vicios de salud de Chile. Rev Med Chil 107:1135, 1979.
(21) Medina, E. El nivel primario de atencion de salud. Rev Med Chil 106:478, 1978.
(22) Medina, E. Elementos que condicionan la elicacia de1 sistema de salud. Document No. 245. Corporation de Promotion Universitaria, Santia- go, 1981.
(23) Mardones, S. F. Analisis de 5 determinan- tes de1 nivel de salud y nutrition infantil: Chile 1970-1979. In J. M. Celedon (ed.). Crecimientoy de- sarrollo en la desnutricidn infantil. Ediciones UNICEF, Santiago, 1981.
(24) Kaempffer, A. M., and E. Medina. Pers- pectivas en la salud de1 niiio latinoamericana. Pedia- tn’a (Chile) 22:324, 1979.
(25) Raczynski, D., and C. Oyarce. ;Por quC cae la tasa de mortalidad infantil en Chile? Coleccidn Estudios CIEPLAN No. 55 6:45, 1981.