Analysis of genetic population structure in
Acacia caven
(Leguminosae,
Mimosoideae), comparing one exploratory and two Bayesian-model-based
methods
Carolina L. Pometti
1,2, Cecilia F. Bessega
1,2, Beatriz O. Saidman
1,2and Juan C. Vilardi
1,2 1Departamento de Ecología, Genética y Evolución, Facultad de Ciencias Exactas y Naturales,
Universidad de Buenos Aires, Buenos Aires, Argentina.
2
Instituto de Ecología, Genética y Evolución de Buenos Aires,
Consejo Nacional de Investigaciones Científicas y Técnicas, Buenos Aires, Argentina.
Abstract
Bayesian clustering as implemented in STRUCTURE or GENELAND software is widely used to form genetic groups of populations or individuals. On the other hand, in order to satisfy the need for less computer-intensive approaches, multivariate analyses are specifically devoted to extracting information from large datasets. In this paper, we report the use of a dataset of AFLP markers belonging to 15 sampling sites ofAcacia caven for studying the genetic struc-ture and comparing the consistency of three methods: STRUCTURE, GENELAND and DAPC. Of these methods, DAPC was the fastest one and showed accuracy in inferring theK number of populations (K = 12 using the find.clus-ters option and K = 15 with a priori information of populations). GENELAND in turn, provides information on the area of membership probabilities for individuals or populations in the space, when coordinates are specified (K = 12). STRUCTURE also inferred the number ofK populations and the membership probabilities of individuals based on ancestry, presenting the resultK = 11 without prior information of populations and K = 15 using the LOCPRIOR op-tion. Finally, in this work all three methods showed high consistency in estimating the population structure, inferring similar numbers of populations and the membership probabilities of individuals to each group, with a high correlation between each other.
Key words:Acacia caven, AFLP, GENELAND, DAPC. Received: July 22, 2013; Accepted: October 29, 2013.
Introduction
Evaluating population genetic structure is of consid-erable interest because it is a precursor to addressing many other issues, such as estimating migration, identifying con-servation units, and specifying phylogeographical patterns (Manelet al., 2005).
Various statistical approaches can be used to form ge-netic groups of populations or individuals. For statistical in-ferences, model-based approaches are more suitable. Bayesian clustering (Manelet al., 2005) based on
Hardy-Weinberg and linkage equilibrium, as implemented in the
STRUCTURE (Pritchard et al., 2000) or GENELAND
(Guillotet al., 2005) programs, is widely used for this
pur-pose. These programs can also consider coordinates of sampling locations. For example, when STRUCTURE is applied to population genetics, it is often useful to classify individuals of a sample into populations. In one scenario,
the investigator starts with a sample of individuals, aiming to determine something about the properties of populations. In a second scenario, the investigator begins with a set of predefined populations, aiming to classify individuals of unknown origin. Using the estimated allele frequencies, it is then possible to compute the likelihood of a given geno-type having originated in each population. Individuals of unknown origin can be assigned to populations according to these likelihoods. Therefore, STRUCTURE uses a Baye-sian clustering approach to assign individuals (probabi-listically) to populations. A model is assumed in which there areKpopulations (whereKmay be unknown), each of
which is characterized by a set of allele frequencies at each locus. This method attempts to assign individuals to popu-lations on the basis of their genotypes, while simulta-neously estimating population allele frequencies. The method can be applied to various types of markers, but it as-sumes that the marker loci are unlinked and in linkage equi-librium with one another within the populations. It also assumes that the populations are in Hardy-Weinberg equi-librium (Pritchardet al., 2000). In other words, the method www.sbg.org.br
Send correspondence to Carolina L. Pometti. Departamento de Ecología, Genética y Evolución, Pabellón 2, Facultad de Ciencias Exactas y Naturales, Universidad de Buenos Aires, 1428 Buenos Aires, Argentina. E-mail: [email protected].
assumes that any disequilibrium found is attributable to population structuration.
For cases in which the geographic locations of indi-viduals are known and sampling is relatively even in space,
spatial model-based clustering methods such as
GENELAND (Guillotet al., 2005) are available to identify
clusters of individuals. Assuming that populations occupy geographically delimited areas, the use of spatial informa-tion increases the power of correctly detecting the underly-ing population structure (Boninet al., 2007). The statistical
model implemented in GENELAND helps inferring and lo-cating genetic discontinuities between populations in space from individual multilocus genetic data. The central as-sumption is that some spatial dependence is often present among individuals. Based on this sensible assumption, a hi-erarchical spatial model was developed in which a priori in-formation on how the individuals are spatially organized is formally injected. In addition to detecting genetic disconti-nuities between populations, the method also addresses other points, such as denoising blurred coordinates of sam-pled individuals, estimating the number of populations in the studied area, quantifying the amount of spatial depend-ence in the data, assigning individuals to their population of origin, and detecting individual migrants between popula-tions (Guillotet al., 2005).
One of the shortcomings of Bayesian clustering meth-ods is related with the assumption of Hardy-Weinberg and linkage equilibrium within populations. However, in many cases, this assumption is not tenable. A technical yet critical limitation is the considerable computation time required for analyzing large datasets. In order to satisfy the need for less computer-intensive approaches, multivariate analyses seem particularly appealing, as they are specifically de-voted to extracting information from large datasets. This is how the Discriminant Analysis of Principal Components (DAPC) was developed. DAPC is based on data transfor-mation, using principal components analysis (PCA) as a prior step to discriminant analysis (DA), which ensures that variables submitted to DA are perfectly uncorrelated, and that their number is less than that of the analyzed individu-als. Without necessarily implying a loss of genetic informa-tion, this transformation allows DA to be applied to any genetic data. Two options for DAPC are offered, depending on whether group priors are known or not (Jombartet al.,
2010).
In this context, since plant populations are not ran-domly arranged assemblages of genotypes, but are struc-tured in space and time, the above mentioned programs allow a fine-scale study of the genetic structure of these pop-ulations. This genetic structure may be manifested among geographically distinct populations, within a local group of plants, or even in the progeny of individuals. Ecologic fac-tors affecting reproduction and dispersal are likely to be par-ticularly important in determining genetic structure. Also, spatial and genetic patterns are often assumed to result from
environmental heterogeneity and differential selection pressures (Loveless and Hamrick, 1984).
In this paper, we describe a study on natural
Argentin-ean populations of the plant species Acacia caven
(Leguminosae, Mimosoideae). This species is an extremely wide-ranging one that probably originated in the warm temperate to subtropical biogeographic region known as the Gran Chaco of southern South America, due to its great morphologic diversity. This small legume species is found in six countries and is considered to have certain potential as a managed silvopastoral crop (Aronson and Ovalle, 1989). Fruit size and shape are highly variable inA. caven.
In 1992, Aronson recognized six varieties for this species, includingA. cavenvar.caven,A. cavenvar.dehiscens,A. caven var. sphaerocarpa, A. caven var. stenocarpa, A. cavenvar.microcarpaandA.cavenvar.macrocarpa, based
on both morphologic traits (Aronson 1992; Pomettiet al.,
2007) and molecular markers (Pomettiet al., 2010).
Argen-tina is the only country where all varieties cohabit (Aronson, 1992).
In this context, the main objective of the present work was to study the genetic structure of 15 populations of the
six varieties of Acacia caven, using a dataset of AFLP
markers. To accomplish this objective, we used two mo-del-based approaches (STRUCTURE and GENELAND) and the exploratory method DAPC for estimating genetic structure and compared the consistency of the three meth-ods.
Materials and Methods
Description of the dataset
In this study, a real dataset was used to compare the results of genetic structure analyses made by alternative ap-proaches. This dataset consists of AFLP patterns of 224
in-dividuals of the six varieties of Acacia caven
(Leguminosae, Mimosoideae), collected from 15 sampling sites (Table 1). The distances between the sampling sites are shown in Table 2.
The AFLP assay was performed as described by Vos
et al.(1995), with a slight modification, as described in
Pomettiet al.(2012). This technique was used to
investi-gate genetic variation within and among natural
popula-tions ofA. cavenfrom five eco-regions: Wet Chaco, Dry
Chaco, Espinal, Pampa and Puna (Burkart et al., 1999).
From the individuals studied by means of AFLP markers, 225 bands were obtained. Each AFLP band was considered as a single biallelic locus with one amplifiable and one null allele. Bands with the same migration distance were con-sidered homologous. Data were scored manually as band presence (1) or absence (0).
Methods to assess population structure
two Bayesian-model-based and one exploratory method. The first one was the spatial cluster model implemented in
the GENELAND package (Guillotet al., 2005) of the R
program (R Development Core Team, 2011). Different sets of parameters (MCMC, thinning and burn-in) were used in different test runs, in order to find the optimal parameters by the time taken for the run. Finally, following the recom-mendation of the user’s manual, the Markov chain Monte Carlo (MCMC) repetitions were set at 100,000, thinning was set at 100, and the burn-in period was set at 200 (we eliminated the first 200 iterations whenever the curve was not constant); the number of groups (K) to be tested was set
at 1-15. All individuals were assigned to K populations (1£K£15) based on their multilocus genotype and the
spa-tial coordinates. To ensure that the run was long enough, we obtained 10 different runs and compared the parameter esti-mates (K, individual population membership, maps). The
best result was chosen, based on the highest average poste-rior probability. The other Bayesian-model-based cluster analysis was performed using the STRUCTURE program version 2.3.3 (Pritchardet al., 2009). This analysis was
per-formed twice: once without prior information of the popu-lations to which the individuals belonged, and once with prior information on the populations (LOCPRIOR model). Table 1- Populations ofAcacia cavensampled in this study.
Variety Eco-region Population Population code Latitude (ºS) Longitude (ºW) Number of individuals analyzed
A. cavenvarcaven Pampa Costanera Sur CS 34°38’10.71" 58°42’44.08" 14
A. cavenvarcaven Pampa Gualeguaychú GY 33°22’4.00" 58°44’3.00" 22
A. cavenvarcaven Puna Coiruro CI 23°53’34.00" 65°27’30.00" 18
A. cavenvarcaven Puna Campo Quijano CQ 24°55’12.00" 65°39’0.00" 13
A. cavenvarcaven Puna Ruta Nueve RN 24°39’48.00" 65°22’49.00" 14
A. cavenvarmacrocarpa Puna El Carril EC 25° 4’58.80" 65°28’1.20" 16
A. cavenvarmacrocarpa Puna Tolombón TO 26°11’8.00" 65°56’7.00" 14
A. cavenvarmicrocarpa Wet Chaco Vivero Forestal VF 26°16’0.00" 58°17’41.64" 12
A. cavenvarstenocarpa Wet Chaco Formosa FS 26°16’13.20" 58°17’7.92" 12
A. cavenvarstenocarpa Wet Chaco YPF YP 26°11’26.76" 58° 9’23.82" 12
A. cavenvarsphaerocarpa Espinal Iberá IB 28°15’40.13" 56°30’20.38" 18
A. cavenvardehiscens Dry Chaco Las Gemelas LG 30°53’26.10" 64°30’13.50" 14
A. cavenvardehiscens Dry Chaco Pan de Azúcar PA 31°15’58.90" 64°20’28.60" 12
A. cavenvardehiscens Dry Chaco Vaquerías VA 31°23’38.93" 63°51’30.87" 12
A. cavenvardehiscens Dry Chaco Valle Hermoso VH 31° 7’1.20" 64°28’58.80" 21
Table 2- Pairwise geographic distances in kilometers betweenAcacia cavensampling sites.
Pop CQ CS EC FS GY IB LG PA RN TO VA VF VH YP CI 111.00 1348.53 123.80 768.28 1226.00 1017.75 809.44 832.00 79.21 263.14 833.53 771.49 856.92 780.57 CQ 1280.00 25.00 752.46 1166.50 982.49 700.00 749.50 39.28 159.26 744.23 751.00 750.71 764.50 CS 1238.29 910.82 185.00 745.31 655.00 645.00 1273.21 1155.11 650.00 911.38 664.42 932.57 EC 730.82 1121.00 961.09 674.07 716.00 50.33 139.09 701.21 729.25 683.00 743.00 FS 777.15 282.15 779.31 801.41 731.84 759.85 780.43 3.00 800.00 15.80 GY 617.17 584.38 574.00 1198.25 1046.00 593.30 770.79 593.50 793.76 IB 832.84 827.86 976.03 964.59 794.48 283.43 838.96 282.15 LG 43.50 738.31 547.38 29.40 783.78 35.20 809.13
PA 798.50 576.00 21.00 795.39 22.44 823.54
RN 194.06 767.15 730.38 727.22 745.00
TO 593.13 759.56 565.74 774.56
VA 775.78 4.00 797.27
VF 799.00 16.41
In both cases, the burn-in period and the number of MCMC repetitions were set, respectively, at 50,000 and 100,000. An admixture model was used, with correlated allele fre-quencies.Kwas set at 1-15, and the highestKvalue was
identified as the run with the highest likelihood value, as recommended by Pritchardet al.(2000). In addition,K
val-ues were averaged across 10 iterations. The exploratory Discriminant Analysis of Principal Components (DAPC)
was applied, using theadegenetpackage (Jombart, 2008)
(function dapc) for software R (R Development Core
Team, 2011). This analysis was also performed both with and without prior information on individual populations. Whenever group priors were unknown, the number of clus-ters was assessed using the find.clustersfunction, which
runs successiveK-means clustering with increasing
num-ber of clusters (k). For selecting the optimal numnum-ber of clus-ters, we applied the Bayesian Information Criterion (BIC) for assessing the best supported model, and therefore the number and nature of clusters, as recommended by Jombart
el al. (2010).
Comparison of individual groupings in the different methods
The probabilities of posterior population membership of individuals obtained by all grouping methods used were converted into between-individual Euclidean distances. Pairwise comparisons of these distance matrices were per-formed by means of the Mantel test using theade4package
of R (Chesselet al., 2004).
Results
Analysis of theAcacia cavenAFLP dataset obtained
using GENELAND yielded a modal number of populations of 12, varying from 11-13 in different runs (Table 3). The run with the highest average posterior probability was
cho-sen to base the conclusions on. The number of populations simulated from posterior distribution (Figure 1) displays a clear mode atK= 12. MCMC clearly converges within the
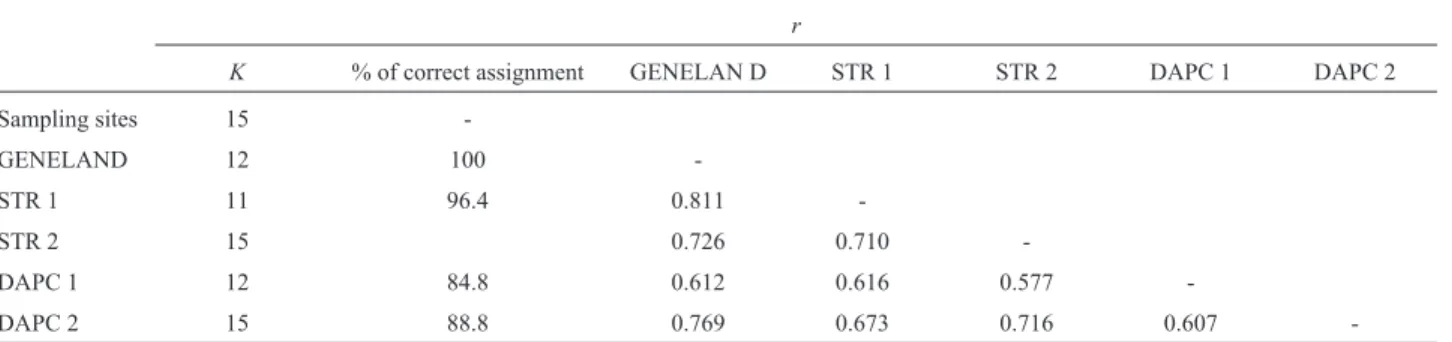
first 10,000 iterations (Figure 1). Two populations, VA and PA (belonging to var.dehiscens), were included in one of
the groups produced by GENELAND (Figure 2, row 3, col-umn 2), and the other group identified comprises the VF, FS, and YP populations (belonging to vars.microcarpaand stenocarpa) (Figure 2, row 2, column 2). In both cases, the
populations grouped together are geographically very close to each other. Each of the remaining groups corresponds to a single sampling site. The comparison of posterior proba-bility of assignment of individuals to populations led to un-equivocal results, assigning each individual to the population to which it belongs, except for those previously mentioned individuals that are in the same group of popula-tions (100% of correct assignation).
Data analysis using STRUCTURE with no prior dis-tribution specified revealed that K = 11 had the highest
mean probability of density value (Ln P(D) = -16832.60), after which this value plateaus, suggesting that the optimal number ofKwas 11. In this analysis (Figure 3a),
individu-als of populations FS, VF, and YP are grouped together, the same occurs with individuals of populations PA and VA, and a third group joins together individuals of populations CQ and RN that belong to the var.cavenand are both
lo-cated in the Puna eco-region (Figure 3a). The assignation of individuals to populations was 96.4% correct.
When the LOCPRIOR option was used,K= 15 had
the highest mean probability of density value (Ln P(D) = -17065.30), suggesting that each population corresponded to a single sampling site (Figure 3b). Moreover, the STRUCTURE results detected admixture of individuals in all populations with both models (Figure 3 a, b). The assig-nation of individuals to populations was 94.2% correct.
Table 3- Multiple runs for inferring the number of populations using GENELAND software.
Run Modal number % of modal number Mean of probability density 1 12 37.20 -62443.26 2 12 37.80 -60538.68 3 11 38.90 -60964.61 4 13 32.80 -60583.12 5 11 36.80 -61215.83 6 13 33.40 -60874.19 7 12 36.40 -60953.19
8 12 36.20 -59999.66
9 12 36.80 -61164.86 10 12 36.00 -60860.80
In bold: highest average posterior probability.
DAPC analysis was first made without any a priori group assignment. To obtain the optimal number of clusters with the find.clusters function, 70 axes that represented
more than 88% of the total variance were retained. The pro-gram covered a range of possible clusters from 1 to 15. The
lowest BIC value (1137.35) corresponded toK= 12. For
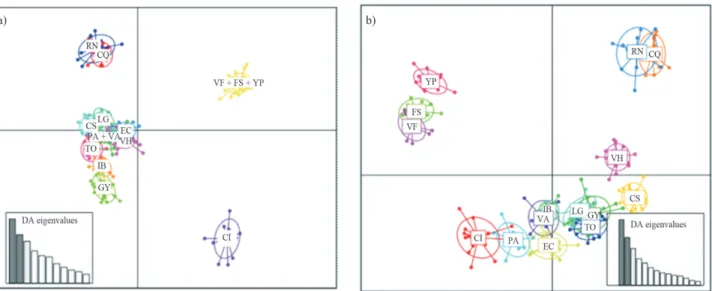
DAPC analysis, 70 PCA axes and three discriminant func-tions were retained (52.3% of variance). One of the clusters included individuals of populations VF, FS, and YP, a sec-ond cluster joined PA and VA, and the remaining clusters were rather consistent with the rest of the sampling sites. The scatterplot of individuals on the two principal compo-nents of DAPC (Figure 4a) showed that the 12 clusters formed four groups. The consistency between prior and posterior assignment was 84.8%.
In the second analysis, the clusters were defined a pri-ori, according to the sampling site. Also in this case, 70 axes of the PCA were retained for DAPC, corresponding to more than 88.8% of the variance, and three discriminant functions were obtained (53.9% of the variance). The scatterplot shows overlapping between the a priori defined groups (Figure 4b); the consistency between prior and pos-terior assignment was 88.8%.
The results obtained from the two approaches can also be compared with the posterior probability plots corre-sponding to the groups defined by thefind.clusters proce-dure (Figure 5a) and with the groups defined by the sampling site (Figure 5b).
Regarding the consistency between prior and poste-rior assignment of individuals to groups (Table 4), the max-imum corresponded to GENELAND (100%), whereas the lowest consistency was obtained by DAPC without infor-mation on population membership (84.8%). Pairwise com-Figure 2- Spatial distribution of each group defined by GENELAND atK= 12. Population codes are given in Table 1.
Figure 3- Clustering of individuals by STRUCTURE. Each individual is represented by a vertical bar that is partitioned into colored segments that represent the individual’s estimated membership fractions. Same color in different individuals indicates that they belong to the same cluster. a)
parison of distances between individuals obtained from the probabilities of posterior assignment of population mem-bership of individuals resulting from all five grouping methods (Table 4) revealed highly significant correlations (p < 0.0005, based on 2000 permutations) in all cases. The highest consistency value (r= 0.811) corresponded to the groupings obtained by GENELAND and STRUCTURE for the admixture model without prior information on popula-tion membership. The grouping obtained by DAPC without prior information on population membership showed the lowest correlation estimates when compared with most of the other grouping methods.
Discussion
The analysis of genetic diversity within species is vi-tal for understanding the evolutionary processes, both at the
population and at the genomic levels. Several statistical packages recently developed which offer a panel of stan-dard as well as more sophisticated analyses have been re-viewed by Excoffier and Heckel (2006). Most data analyses require the use of more than one program and should start with generalist packages to uncover the basic properties of the data, followed by the use of specialized methodologies to address more specific questions (Excoffier and Heckel, 2006).
In line with this recommendation, we evaluated the consistency of different methodological approaches for an-alyzing genetic properties ofAcacia cavenpopulations, a
shrub widely distributed in South America. This species plays an important role in arid ecosystems, as it contributes to the fixation of atmospheric nitrogen, provides fruits and leaves to herbivores, and stabilizes soils by fixing dunes. In Figure 4- Scatterplot of individuals on the two principal components of DAPC. The graph represents the individuals as dots and the groups as inertia el-lipses. Eigenvalues of the analysis are displayed in inset: a) obtained with thefind.clustersoption, b) with clusters defined a priori according to the
sam-pling site. Population codes are given in Table 1.
addition, it is an appreciated natural resource for local set-tlers, because it provides fire wood, charcoal and forage for livestock. Due to its great plasticity, it is used in the refores-tation of degraded ecosystems (Karlinet al., 1997).
In this work, we chose one exploratory and two Bayesian-model-based methods to infer the genetic struc-ture ofA. cavenspecies from 15 sampling sites. The
explor-atory method used here was DAPC that seeks synthetic variables, the discriminant functions, which show differ-ences between groups as best as possible, while minimizing variation within clusters (Jombart, 2012). Using the
find.clustersoption in this analysis, the number of
popula-tions inferred wasK= 12, grouping together VF, FS, and
YP and also PA and VA. DAPC analysis is preferred when groups are often unknown or uncertain and there is a need for identifying genetic clusters before describing them. In this work, we found that those sampling sites that grouped together in the same cluster were the geographically closer ones. When we defined the prior groups for the DAPC anal-ysis, the inferredKwas 15, the same as the number of
sam-pling sites. In both cases, the percentage of variance explained by the three discriminant functions was < 54%. This could be attributed to the reduction of variables achieved by DAPC; in other words, we had 225 loci or vari-ables, and this method reduced (in this case) the number of composed variables to the 70 more informative axes.
Additionally, two Bayesian analyses were applied to the data to study the genetic structure of the samples (GENELAND and STRUCTURE). When STRUCTURE
was run with the LOCPRIOR option, theKestimated was
coincident with the number of data sampling sites (K= 15).
When using STRUCTURE, it is usually assumed that all partitions of individuals are a priori approximately equally likely. Since the number of possible partitions is immense, it takes highly informative data for STRUCTURE to con-clude that any particular partition of individuals into clus-ters has compelling statistical support. In contrast, the LOCPRIOR models assume that, in practice, individuals from the same sampling location often come from the same population. Therefore, the LOCPRIOR models are set up to
expect that the sampling locations may be informative about ancestry. If the data suggest that the locations are
in-formative, then the LOCPRIOR models allow
STRUCTURE to use this information (Pritchard et al.,
2010).
GENELAND analysis in turn showed that the 15A.
cavenpopulations studied could be grouped intoK= 12
in-dependent groups, indicating that each sampling site repre-sented a single Mendelian population, with the exception of VA and PA, and FS, YP, and VF, which would correspond to two clusters. STRUCTURE analysis without prior infor-mation of populations showed that the optimal number of populations wasK= 11, joining together populations CQ
and RN. The other 10 groups constituted were coincident with those detected by GENELAND. The slight difference between analyses regarding the detection of the number of
K could be attributed to the model chosen, since
GENELAND was run with previous information of geo-graphic coordinates, tending to favor partitions that are spa-tially organized, while STRUCTURE was not. Similar
dif-ferences in behavior between GENELAND and
STRUCTURE were noted by Guillotet al.(2005) when
comparing the dataset of Montana wolverines (Gulo gulo)
recorded by Cegelskiet al.(2003), as STRUCTURE
in-ferredK= 3, whereas GENELAND inferredK= 4. In our
case, GENELAND grouped togetherA. cavenpopulations
that were geographically and genetically closer and located in the same eco-region, such as VA and PA, and FS, VF, and YP. On the other hand, STRUCTURE detected the ge-netically similar groups. Varietycavenis the most
wide-spread (a generalist, in terms of ecology range), and here we analyzed five of its populations from two eco-regions. One could expect to find these populations grouped to-gether according to the eco-region and the variety they be-long to. However, the results of the Puna eco-region sug-gest that there the populations are less connected to each other by gene flow than the populations of the other eco-regions, since CI was not grouped together with CQ and RN in the STRUCTURE analysis. A possible explanation for this clustering could be that the geographic distances be-Table 4- Pairwise comparison of distances between individuals obtained from the probabilities of posterior population membership of individuals, ob-tained by all five grouping methods.K= number of clusters;r= correlation coefficient; p < 0.0005; STR 1= STRUCTURE analysis without prior
infor-mation; STR 2 = STRUCTURE analysis with LOCPRIOR option; DAPC 1= DAPC analysis withfind.clustersoption; DAPC 2 = DAPC analysis with a priori information of populations.
r
K % of correct assignment GENELAN D STR 1 STR 2 DAPC 1 DAPC 2
Sampling sites 15
-GENELAND 12 100
-STR 1 11 96.4 0.811
-STR 2 15 0.726 0.710
-DAPC 1 12 84.8 0.612 0.616 0.577
-tween CQ and RN were smaller than that from CI, and the genetic and geographic distances among the populations studied here have shown to be significantly correlated (Po-mettiet al., 2012). Moreover, although these three
popula-tions belong to the same variety and the same eco-region, they were found at different altitudes: RN at 1305 m o.s.l., CQ at 1511 m o.s.l., and CI at 2089 m o.s.l. This results in an environment of patchy vegetation, because of the pres-ence of mountains that separate CI from RN and CQ. It has been well documented that marginal populations are often less variable than populations within the primary range (Blows and Hoffmann, 1993; Denget al., 2009). The
re-sults obtained for the variety caven from the Puna
eco-region could be explained by the observations of Hamrick and Godt (1990) and Maguireet al.(2000) that populations
located at range margins are more isolated from sources of immigrants and are thus more prone to genetic bottlenecks.
When comparing the numberKof populations
esti-mated in the three methods, DAPC using thefind.clusters
option proved as accurate in detecting population clusters as STRUCTURE without prior information of populations and GENELAND.
When prior groups were defined, the DAPC results were coincident with those obtained by STRUCTURE with
the LOCPRIOR option, whereK= 15. As previously
ex-plained, in both cases the sampling locations were informa-tive about ancestry.
A significant degree of genetic differentiation among
A. cavenpopulations was observed using the three
meth-ods, sinceKranged from 11 to 15, showing a high level of
structuration in the 15 sampling sites studied. The most evi-dent associations among populations were found for PA and VA, and FS, VF and YP in all analyses, and for CQ and RN with STRUCTURE. No other association between pop-ulations by eco-region or variety was observed consistently with the tree methods used.
The three methods used here to infer population struc-ture also provide coefficients of membership probabilities of each individual to the different groups, based on the re-tained discriminant functions in the case of DAPC, or based on ancestry in the case of STRUCTURE and GENELAND. While DAPC coefficients are different from the admixture
coefficients of softwares like STRUCTURE or
GENELAND, they can still be interpreted as proximities of individuals to the different clusters. Membership probabili-ties also provide indications of how clear-cut genetic clus-ters are (Jombart, 2012). The highest membership probabilities of each individual for the different groups
were obtained by GENELAND, followed by
STRUCTURE with prior definition of groups,
STRUCTURE without population information, DAPC with prior definition of groups, and the lowest membership probabilities were those observed by DAPC without infor-mation on population membership. This means that the three methods and their variants provided accurate
assign-ments of individuals, ranging from 84.8% for DAPC using thefind.clustersoption to 100% for GENELAND.
In conclusion, of the three methods used here, DAPC proved to be the fastest one, showing accuracy in inferring theKnumber of populations and the membership
probabil-ities of each individual for the different groups in a short computational time (only a few minutes, while STRUCTURE and GENELAND needed four or five days to perform the analysis). So, DAPC should be preferred as a starting point when working with large datasets and several sampling sites, as recommended by Excoffier and Heckel (2006). GENELAND, on the other hand, provides informa-tion on the area of membership probabilities for individuals or populations in space, when coordinates are specified; moreover, the number of population units is treated as an
unknown parameter (Guillotet al., 2005). STRUCTURE,
in addition to inferring the number ofKpopulations and the
membership probabilities of individuals based on ancestry, allows a hierarchical analysis of sampling sites fromK= 2
toK=n, wherenis the number of populations estimated
with the highest mean probability of density value (Tishkoffet al., 2009; Pomettiet al., 2012). The two latter
analyses present the disadvantage of being more time-consuming and relying on assumptions, such as the type of population subdivision and Hardy-Weinberg and linkage equilibrium inside populations. Finally, in this work, all three methods showed high consistency in esti-mating the population structure ofA. caven, inferring
simi-lar numbers of populations and membership probabilities of individuals to each group, with a high correlation be-tween each other. This consistency may be interpreted in a similar way as the consistency between phenetic and cladistic analyses, which, although being based on different assumptions, reveal in many cases similar associations be-tween phylogenetically related groups.
Acknowledgments
This work was supported by grants from the Uni-versidad de Buenos Aires (EX201 and 20020100100008 to B.O.S.) and the Consejo Nacional de Investigaciones Cien-tíficas y Técnicas (PIP 11220090100147 to J.C.V.).
References
Aronson J (1992) Evolutionary Biology of Acacia caven
(Leguminosae, Mimosoideae): Infraspecific variation in fruit and seed characters. Ann Mo Bot Gard 79:958-968. Aronson J and Ovalle C (1989) Report on a study of the natural
variability, biogeography and potential for genetic improve-ment ofAcacia caven. Bull Int Group Study Mimosoideae 17:111-121.
Bonin A, Ehrich D and Manel S (2007) Statistical analysis of am-plified fragment length polymorphism data: A toolbox for molecular ecologists and evolutionists. Mol Ecol 16:3737-3758.
Burkart R, Bárbaro NO, Sánchez RO and Gómez DA (1999) Ecorregiones de la Argentina. Administración de Parques Nacionales, Buenos Aires, 43 p.
Cegelski C, Waits L and Anderson J (2003) Assessing population structure and gene flow in Montana wolverines (Gulo, gulo)
using assignment-based approaches. Mol Ecol 12:2907-2918.
Chessel D, Dufour AB and Thioulouse J (2004) The ade4 pack-age-I- One-table methods. R News 4:5-10.
Deng S, Huang Y, He H, Tan F, Ni X, Jayatissa LP, Hettiarachi S and Shi S (2009) Genetic diversity of Aegiceras corniculatum (Myrsinaceae) revealed by amplified frag-ment length polymorphism (AFLP). Aquat Bot 90:275-281. Excoffier L and Heckel G (2006) Computer programs for
popula-tion genetics data analysis: A survival guide. Nat Rev Genet 7:745-758.
Guillot G, Mortier F and Estoup A (2005) GENELAND: A com-puter package for landscape genetics. Mol Ecol Notes 5:712-715.
Hamrick JC and Godt JW (1990) Allozyme diversity in plant spe-cies. In Brown HD, Clegg MT, Kahler AL and Weir BS (eds.) Plant Population Genetics, Breeding, and Genetic Re-sources. Sinauer Associates, Sunderland, p 43-65.
Jombart T (2008) Adegenet: A R package for the multivariate analysis of genetic markers. Bioinformatics 24:1403-1405. Jombart T, Devillard S and Balloux, F (2010) Discriminant
analy-sis of principal components: A new method for the analyanaly-sis of genetically structured populations. BMC Genetics 11:94. Karlin OU, Coirini RO, Catalan L and Zapata R (1997)Acacia
caven. In: Oficina Regional de la FAO para America Latina
y el Caribe (ed) Especies Arbóreas y Arbustivas para las Zonas Áridas y Semiáridas de América Latina, Zonas Áridas y Semiáridas. FAO/PNUMA, Santiago, pp 157-167. Loveless MD and Hamrick JL (1984) Ecological determinants of
genetic structure in plant populations. Ann Rev Ecol Syst 15:65-95.
Maguire TL, Saenger P, Baverstock P and Henry R (2000) Micro-satellite analysis of genetic structure in the mangrove spe-ciesAvicennia marina(Forsk) Vierh. (Avicenniaceae). Mol
Ecol 9:1853-1862.
Manel S, Gaggiotti O and Waples RS (2005) Assignment meth-ods: Matching biological questions with appropriate tech-niques. Trends Ecol Evol 20:136-142.
Pometti CL, Cialdella AM, Vilardi JC and Saidman BO (2007) Morphometric analysis of varieties ofAcacia caven:
(Legu-minosae, Mimosoideae): Taxonomic inferences in the con-text of other Argentinean species. Plant Syst Evol 264:239-249.
Pometti CL, Vilardi JC, Cialdella AM and Saidman BO (2010) Genetic diversity among the six varieties ofAcacia caven
(Leguminosae, Mimosoideae) evaluated at molecular and phenotypic levels. Plant Syst Evol 284:187-199.
Pometti CL, Bessega CF, Vilardi JC and Saidman BO (2012) Landscape genetic structure of natural populations ofAcacia cavenin Argentina. Tree Genet Genomes 8:911-924.
Pritchard JK, Stephens M and Donnelly P (2000) Inference of population structure using multilocus genotype data. Genet-ics 155:945-959.
R Development Core Team (2011) R: A language and environ-ment for statistical computing. R Foundation for Statistical Computing, Vienna, Austria.
Tishkoff S, Reed F, Friedlaender F, Ehret C, Ranciaro A, Froment A, Hirbo J, Awomoyi A, Bodo JM, Doumbo O,et al.(2009) The genetic structure and history of Africans and African Americans. Science 324:1035-1044.
Vos R, Hogers R, Bleeker M, Reijans M, Lee T, Hornes M, Frijters A, Pot J, Peleman J and Kuiper M (1995) AFLP: A new technique for DNA fingerprinting. Nucleic Acids Re-search 23:4407-4414.
Internet Resources
Jombart T (2012) A tutorial for Discriminant Analysis of Princi-pal Components (DAPC) using adegenet 1.3-4. http://cran.r-project.org/web/packages/adegenet/vi-gnettes/adegenet-dapc.pdf (October 23, 2012).
Pritchard JK, Wen X and Falush D (2009) STRUCTURE ver. 2.3. University of Chicago, Chicago, USA. http://pritch.bsd.uchicago.edu/ (December 29, 2010). Pritchard JK, Wen X and Falush D (2010) Documentation for
structure software: Version 2.3. http://pritch.bsd.uchicago.edu/structure.html (December 29, 2010).
Associate Editor: Dario Grattapaglia