Double Master in Clinical Research and Regulatory Affairs for Drugs
and Biologics
Nova Medical School (Lisbon, Portugal)
&
Northeastern University (Boston, United States of America)
Evaluation of Long Term Persistence of Diabetes Mellitus
Type II Treatment in Newly Diagnosed Patients in Lisbon and
Tagus Valley Health Administration Region: a Three Year
Follow Up Study.
João Esteves, PharmD
2
INDEX
Acknowledgments………..3
Abbreviations……….4
Resumo………..5
Abstract………..6
Introduction………..………..7
Methods. ……….……….13
Results……….………21
Discussion……….………29
Conclusions and Future Perspectives………32
References………33
3
ACKNOWLEDGMENTS
Would like to thank to the following persons/institution:
» André Coelho for all the support from the beginning and throughout the completion of this thesis; your advices were decisive to achieve the goal of delivering this thesis
» Prof. Dr. Pedro Caetano for helping me finding a suitable and interesting theme for my thesis
» Filipa Valente for the patience during the time I was focused and emerged with the thesis writing
» ARSLVT for releasing the data from their databases that allowed this study to come to light
4 ARSLVT – Administração Regional de Saúde de Lisboa e Vale do Tejo (Lisbon and Tagus Valley Region Health Administration)
DM – Diabetes Mellitus
T2DM – Type II Diabetes Mellitus
INE – Instituto Nacional de Estatística (National Institute of Statistics)
INFARMED – Instituto Nacional do Medicamento e Produtos de Saúde (Drugs and Health Products National Institute)
SAMS – Serviço de Assistência Médico Social (Medical and Social Assistance Service, privately held healthcare insurer and provider)
SIARS – Sistema de Informação da Administração Regional de Saúde (Intelligence System from the Regional Health Administration)
SNS – Serviço Nacional de Saúde (National Institute of Health)
5
Racional: A persistência à terapêutica é o tempo em qualquer antidiabético oral, desde o seu início até à descontinuação de todas as medicações ou até ao fim do período do estudo. Os objetivos deste estudo foi a análise da persistência à terapêutica no segundo e terceiro anos após início do tratamento em doentes adultos diagnosticados na região de Lisboa e Vale do Tejo e determinar o efeito de determinadas variáveis na persistência a longo prazo.
Métodos: Um estudo retrospetivo não interventivo foi desenhado com base nos dados a obter do
SIARS (prescrições e aquisições na farmácia) e Pordata. A persistência foi quantificada como a percentagem de doentes que continuam a adquirir pelo menos um antidiabético oral ao segundo e terceiro anos após a compra da primeira receita. A associação entre a persistência e o segundo e terceiro anos com cada uma das co-variáveis foi aferido pelo teste qui-quadrado e os odd ratios foram
calculados com recurso a um modelo de regressão logística.
Resultados: A persistência à terapêutica obtida foi de 80% e 62% para o segundo e terceiro anos após início da terapêutica. Odd ratios para primeiro e segundo ano: número de grupos farmacoterapêuticos diferentes (OR = 2.167, 1.807 – 2.598, p = 0.000 / OR = 1.863, 1.621 – 2.142, p = 0.000); idade (OR = 0.914, 0.772 – 1.081, p = 0.294 / OR = 0.875, 0.764 – 1.002, p = 0.054); sexo (OR = 1.163, 0.983 – 1.377, p = 0.079); número de diferentes prescritores (OR = 3.594, 3.030 – 4.262, p = 0.000 / OR = 2.167, 1.886
– 2.491, p = 0.000); instituição de prescrição (OR = 0.725, 0.698 – 0.753, p = 0.000 / OR = 0.683, 0.650
– 0.717, p = 0.000); grupo farmacoterapêutico (OR = 1.056, 1.043 – 1.069, p = 0.000 / OR = 1.077, 1.060 – 1.095, p = 0.000); relação com o médico (OR = 0.834, 0.816 – 0.852, p = 0.000 / OR = 0.799, 0.777 – 0.821, p = 0.000) e custo médio mensal por grupo farmacoterapêutico (OR = 0.954, 0.942 – 0.968, p = 0.000 / OR = 0.930, 0.914 – 0.947, p = 0.000).
Conclusões: O valor da persistência à terapêutica no segundo ano é ligeiramente acima do que é
mencionado na literatura e não existem dados para comparar os resultados do terceiro ano. Relativamente ao efeito das co-variáveis no segundo e terceiro anos após o início do tratamento, os resultados são sobreponíveis, sendo que o sexo não está associado à persistência ao terceiro ano.
Palavras-chave: persistência à terapêutica; persistência a longo prazo; diabetes mellitus tipo II;
região de Lisboa e Vale do Tejo
6
Background: Therapy persistence is the time on any antidiabetic medication, from initiation of therapy to discontinuation of all medications or the end of the study period. The aim of the study was to analyse the therapy persistence in the second and third years after treatment initiation in newly diagnosed adult patients in the Lisbon and Tagus Valley region and to determine the effect of several co-variables in the long term persistence.
Methods: A retrospective non-interventional study based on SIARS data (drug prescriptions and acquisitions) and Pordata was designed. Persistence was quantified as the percentage of patients that continued to purchase at least one type of antidiabetic at year 2 and 3 after the date of first prescription acquisition. Association between persistence at second and third years with each of the other co-variables were verified by using the Chi-Square test and odds ratio were calculated using a regression logistic model.
Results: Therapy persistence obtained was 80% and 62% for the second and third years after treatment initiation. Odd ratios for second and third years: number of different pharmacotherapeutic groups (OR = 2.167, 1.807 – 2.598, p = 0.000 / OR = 1.863, 1.621 – 2.142, p = 0.000); age (OR = 0.914, 0.772 – 1.081, p = 0.294 / OR = 0.875, 0.764 – 1.002, p = 0.054); gender (OR = 1.163, 0.983 – 1.377, p = 0.079); number of different prescribers (OR = 3.594, 3.030 – 4.262, p = 0.000 / OR = 2.167, 1.886 – 2.491, p = 0.000); institution of prescription (OR = 0.725, 0.698 – 0.753, p = 0.000 / OR = 0.683, 0.650
– 0.717, p = 0.000); pharmacotherapeutic group (OR = 1.056, 1.043 – 1.069, p = 0.000 / OR = 1.077, 1.060 – 1.095, p = 0.000); relationship with the physician (OR = 0.834, 0.816 – 0.852, p = 0.000 / OR = 0.799, 0.777 – 0.821, p = 0.000) and average cost per month and per pharmacotherapeutic group (OR = 0.954, 0.942 – 0.968, p = 0.000 / OR = 0.930, 0.914 – 0.947, p = 0.000).
Conclusions: Second year therapy persistence value is slightly above of what is referenced in literature and no data was found to compare the third year value. Regarding the effect of the co-variables analysed at second and third years after treatment initiation, the results were overlapping with gender being not associated with persistence at the third year.
Keywords: Therapy persistence; long term persistence; type II diabetes mellitus; Lisbon and Tagus Valley region.
7 Treatment adherence
Adherence (or compliance) to the treatment prescribed is crucial in the outcome and successful management of any disease, especially in chronic conditions. Interestingly, it has been widely reported in several studies that compliance is generally low in chronic patients which raises public health concerns over effectiveness, safety and cost-effectiveness of the use of drugs1,2.
Treatment adherence is a process where patients take the medication as prescribed by the physician and encompasses three main components: initiation (also described as primary adherence), implementation and discontinuation. This process starts when the patient takes the first dose of the prescribed medication (initiation) and continues with its scheduled intake until the last dose (implementation); the end of treatment is established when the scheduled next dose is skipped and no more doses are taken afterwards (discontinuation). The timeframe between initiation and discontinuation is known as persistence1,2,3. Thus, a patient can be considered as non-adherent if: does
not take the first dose or starts it later than expected (non- or late initiation); does not take it properly as prescribed (bad implementation) or interrupts it prior to what was expected per the prescription (early discontinuation)1,3,4.
Evaluation of the treatment adherence is vital not only to identify potential risk factors for low compliance, but also to analyse and estimate the impact of non-adherence in clinical and economic outcomes. Several direct and indirect approaches can be used to characterise adherence, such as:
» Direct measurements
- Quantification of drug or metabolites levels in body fluids;
- Electronic monitoring devices (Ex: to log the frequency and time of opening a pill box);
» Indirect measurements
- Patients’ and healthcare providers’ interviews;
- Pill count;
8 The cost of implementation in large studies and the fact that not all metabolites can be measured by current biochemical assays are the major barriers for the use of direct measurements.
Patients and healthcare interviews are very likely to be biased by the recall effect whereas pill count does not assure that all medication was actually taken which may lead to sub or overestimation of the adherence. Furthermore, they are not easy to implement in large scale studies.
Each method has its own advantages and disadvantages, nevertheless, pharmacy/claims databases are the most widely used since data is ready and easily accessible, inexpensive and provides insightful information from the “real world”. Nevertheless, major limitations can lead to overestimation of adherence, namely: despite knowing that a particular patient bought a particular medication in the pharmacy and/or acquired it regularly, it cannot be assumed that it was taken or dully administered; patient can be classified as non-adherent in cases where physician informs the patient to discontinue certain drug(s) or obtain the medication from other sources (relatives or directly in the pharmacy without any prescription); it does not take into account other variables such as non-pharmacologic therapies that may impact more or less on treatment compliance and in the final health outcome1,2,3,5.
Persistence
Persistence is the continued use of a medication or medications (i.e. no discontinuation) for a specified period of time. It is quantified from the index date (date of the first prescription acquisition) until the date of treatment discontinuation and if no discontinuation occurs during the study window, it is censored at the end of the available study data. It is often analysed as a dichotomous variable for a specified period of time (for example, was a patient persistent at 6 months or at 1 year?); then the proportion of patients persistent at a given time and the average duration of persistence (i.e. the average time from treatment initiation to discontinuation) are calculated4,6. It implies that the patient
must have exhibited at least primary adherence because persistence over time cannot be measured unless the patient has received at least the first dispensing5.
9 Medication persistence is the time on a given medication, from initiation of therapy to the end of the study period or the end of the last supplied prescription for that medication before discontinuation of that medication.
Regimen persistence is the time on a specified set of medications from initiation of therapy with that set to any change in the set of medications being received (additions or discontinuations) or the end of the study period. This metric is used to evaluate persistence with combination therapy involving 2 separate medications, that are not available as a combination, but as a single agent instead. This approach goes beyond medication persistence since the period of regimen persistence ends if any part of the overall treatment regimen is changed.
Finally, therapy persistence is the time on any antidiabetic medication, from initiation of therapy to discontinuation of all medications or the end of the study period. This metric is similar to that for medication persistence but allows for the duration of persistence to continue for the entire period that a patient receives any antidiabetic medication. The use of this definition implies that several types of changes in medication used should be accounted for, especially switching and additions.
Switching refers to discontinuation of one medication with initiation of a new medication at approximately the same time. This can be within a specified window around the discontinuation event, based either on a fixed period of time (e.g. 1 month) or on the duration of one medication refill. Early switching (i.e. shortly after initiation of a therapy) is likely to reflect adverse events, whereas switching after a longer period may reflect failure of reaching DM control. Nevertheless, medications may also be switched if a patient develops other medical conditions and requires a different medication either to treat both diabetes and the new condition or to avoid contraindications with the new condition or other newly initiated medications. Thus, switching may not always indicate a treatment failure.
10 Diabetes Mellitus
Diabetes Mellitus is a metabolic disorder characterised by high levels of glucose in the blood due to issues with the secretion or the action of insulin, or both. The aim of the treatment is to normalise glucose levels to prevent acute (hyperglicemia and hypoglicemia) and chronic (kidney failures, retinopathies and cardiovascular disorders) complications.
There are currently four types of DM based on the etiology: type I, type II, gestational and others.
Type I DM (5-10% of all cases) is a result from a failure of the pancreatic β cells (autoimmune processes, for instance) in producing and secreting insulin to the bloodstream. This can be caused by autoimmune processes or idiopathic reasons that lead to β cells destruction. Children and adults have to be treated with exogenous insulin to maintain adequate glycemia levels and should adopt other measures as self-monitoring of glucose levels, diet and physical activity.
The majority of cases (almost 90%) are diagnosed as type II DM which is a result of peripheral resistance to insulin, often associated with overweight. Treatment options include non-pharmacologic strategies such as self-blood monitoring, adjustment of food intake (especially carbohydrates) and increase physical activity; and pharmacologic approaches with several oral antidiabetics (biguanides, sulphonylureas, α-glucosidases inhibitors, thiazolidinediones, dipeptidil peptidase-4 inhibitors and others) and in certain cases insulin as well.
Gestational diabetes is diagnosed in the second or third trimester of pregnancy whereas other
forms of DM include genetic defects in β-cells or insulin, exocrine pancreas diseases, endocrinopathies, infections, drugs/chemicals and other rare forms1,7.
11 In the majority of developed countries, DM is the leading cause of blindness, kidney failure and lower limbs amputation as well as one of the main causes of death by increasing the risk of developing coronary disease and stroke8,10,11. Besides the human suffering that the complications
related with the disease cause on patients and their relatives, economic costs are also high. These costs include healthcare, loss of income and economic costs to the society, loss of productivity and the costs related with missed opportunities for economic development. The creation of a primary prevention strategy for DM and an efficient therapeutic plan that creates more adherents are of utmost importance1,8,12-14.
Non-adherence to the treatment in chronic diseases such as DM is widely associated with an increase in the associated comorbidities, increase in mortality and decrease in therapeutic efficiency and quality of life5,15. Even though, 50% of chronic patients do not initiate the treatment prescribed
and there is also a high percentage of discontinuations upon therapy initiation leading to an increase in hospital admission costs that could be avoided16-19.
Oral antidiabetics and insulin are essential in disease management, however one third of the diabetics do not benefit from it due to non-adherence16,17. More than 195.930 electronic prescriptions
from primary care units were analysed and only 151.837 of these were acquired in the pharmacy, which correlates with a non-primary adherence of 22.5%15. In another study that focused on pharmacy
acquisitions, 15% of newly diagnosed patients did not start treatment16.
In a study conducted in Canada with more than 160.231 patients that initiated therapy with antidiabetics, it was found that implementation did not reach 60%, depending on the pharmacotherapeutic group and the co-payments by patients20. Other study found that
implementation was lower in patients taking sulphonylureas comparing with biguanides21.
Regarding persistence, all studies mention values only for one and two year persistence and not data is available for comparison at third year after treatment initiation. In a study to compare adherence and persistence among adults initiating several antidiabetic drugs, it was verified that 55% of the dipeptidil peptidase-4, 47.8% from sulphonylureas and 42.9% of thiazolidinediones were persistence at first and second follow up years22.
12 family support; less frequent dose and monotherapy with simple dosing schedules; frequency of the self-care behaviour such as blood glucose monitoring1,23. Some of these factors are not consensual as
review reached opposite conclusions stating that being a female and elderly can positively affect treatment adherence23.
Cost of care, poor relationship between patient and the physician, complexity of the treatment and depression are factors that have been considered as negatively affecting adherence1,23,24,25.
The management of this disease is paramount and it is therefore crucial to understand the underlying causes associated with a low adherence in order to maximise health outcomes. To our knowledge, there was no study conducted to characterise the antidiabetic treatment adherence in a Portuguese population and this study is essential to fill this gap and to provide interesting insights for epidemiology and treatment policies.
This study is part of a larger project that aims to characterise primary and long-term adherence to treatment in newly diagnosed patients in the Lisbon and Tagus Valley region (Grande Lisboa, Península de Setúbal, Médio Tejo, Lezíria do Tejo and Oeste), which accounts for almost 35% of the total Portuguese population26, during a three year follow up. Particularly in this part of this project,
the goal is to analyse the therapy persistence in the second and third years after treatment initiation (long term), i.e., to verify whether patients are acquiring at least one medication two and three years upon starting any antidiabetic drug. Besides, the determination of the effect of several co-variables (gender, age, purchase power per capita and per county, number of different prescribers and pharmacotherapeutic groups, pharmacotherapeutic groups, average monthly cost paid by patient in each pharmacotherapeutic group, institution of prescription and relationship with the physician) in the long-term therapy persistence is also to be assessed.
13 Study Design
To measure the persistence of antidiabetic treatment in the long term (second and third years) in newly diagnosed diabetic type II patients in the Lisbon and Tagus Valley region from January 2011 until June 2014 and to assess the potential effects of co-variables (gender, age, purchase power per
capita and per county, number of different prescribers and pharmacotherapeutic groups,
pharmacotherapeutic groups, average monthly cost paid by patient in each pharmacotherapeutic group, institution of prescription and relationship with the physician) in the therapy persistence outcomes at second and third years after treatment initiation, we designed a retrospective non-interventional study based on available registries (claims databases) extracted from the regional database (SIARS) held and managed by the Lisbon and Tagus Valley Region Health Administration (ARSLVT). This database contains information regarding all prescriptions in primary care units and pharmacy acquisitions in each of the 5 regions that constitute ARSLVT26.
The cohort was composed by all adult patients (more than or equal to 18 years old) diagnosed with the code T90 of the International Classification for Primary Care-2 (that stands for T2DM) in any primary care unit of Lisbon and Tagus Valley region from January 1st to March 31st, 2011 and for whom
antidiabetic drug treatment was instituted. Each element of the cohort was followed afterwards for three years.
The following drugs were considered for this study based on the Anatomical Therapeutic Chemical Code classification updated on December 19th, 2013:
» A10A – Insulins and Analogues
A10AB - Insulins and analogues for injection, fast-acting
A10AC - Insulins and analogues for injection, intermediate-acting
A10AD - Insulins and analogues for injection, intermediate- or long-acting combined with fast-acting
14 » A10B – Blood glucose lowering drugs, excluding insulins
A10BA – Biguanides A10BA02 – Metformin
A10BB - Sulphonylureas
A10BB01 - Glibenclamide
A10BB07 – Glipizide
A10BB09 – Gliclazide
A10BB12 – Glimepiride
A10BD – Combinations of blood glucose lowering drugs, excluding insulins
A10BD02 - Metformin + Sulphonylurea
Metformin + Glibenclamide
A10BD05 - Metformin + Pioglitazone
A10BD06 - Glimepiride + Pioglitazone
A10BD07 - Metformin + Sitagliptin
A10BD08 - Metformin + Vildagliptin
A10BD09 - Pioglitazone + Alogliptin
A10BD10 - Metformin + Saxagliptin
A10BD11 - Metformin + Linagliptin
A10BD13 - Metformin + Alogliptin
15 A10BD16 - Metformin + Canagliflozin
A10BF – Alpha glucosidase inhibitors
A10BF01 – Acarbose
A10BF02 - Miglitol
A10BG -
Thiazolidinediones A10BG03 – Pioglitazone
A10BH - Dipeptidil Peptidase 4 (DDP-4) inhibitors
A10BH01 – Sitagliptin
A10BH02 – Vildagliptin
A10BH03 – Saxagliptin
A10BH04 – Alogliptin
A10BH05 – Linagliptin
A10BX – Other blood glucose lowering drugs, excluding insulins
A10BX02 – Repaglinide
A10BX03 – Nateglinide
A10BX04 – Exenatide
A10BX07 – Liraglutide
A10BX08 – Mitiglinide
A10BX09 – Dapagliflozin
A10BX10 – Lixisenatide
16 A10BX12 - Empagliflozin
A10BX13 – Albiglutide
Study Variables
- Variables extracted from SIARS
The following variables were requested and obtained from the SIARS database:
A: COD_ANO ‒ year of pharmacy acquisition (between July 2010 and June 2014)
B: COD_MES ‒ month of pharmacy acquisition (between July 2010 and June 2014)
C: COD_TIPO_INST_PRESCRICAO ‒ code of the institution of prescription D: DES_TIPO_INST_PRESCRICAO ‒ institution of prescription
E: COD_RECEITA ‒ code of the prescription
F: COD_ATC ‒ Anatomical Therapeutic Chemical Code WHO
G: DES_ATC ‒ drug international non-proprietary name
H: COD_DCI ‒ codification of the drug international non-proprietary name
I: DES_DCI ‒ drug international non-proprietary name
J: DES_MEDICAMENTO ‒ drug international non-proprietary name or brand name L: DES_APRESENTACAO ‒ pharmaceutical form (pill, capsule, poder, …)
M: COD_FORMA ‒ INFARMED’s registry code of the drug N: DES_FORMA ‒ number of units per package
O: COD_DDD – defined daily dose
P: COD_BENEFICIARIO ‒ patient identification code (encrypted) Q: COD_IDADE: age of the patient
R: COD_SEXO: gender of the patient
S: FREGUESIA ‒ code of the civil parish where the prescription institution is placed
17
U: COD_MED_FAM ‒ relationship physician/patient (sporadic, family physician, without family physician, without family physician by option or unknown)
V: EMB ‒ number of drug packages acquired in the pharmacy
X: PVP ‒ drug package price (in euros)
Z: SNS ‒ drug co-payment from SNS (in euros)
- Other Variables
Purchase power per capita and per county obtained from INE /Pordata. This indicator compares purchase power per capita in different counties to the average national
purchase power per capita which is considered as being equal to 100%.
Data Extraction
Drug prescriptions and acquisitions data from July 2010 until June 2014 was gently provided by ARSLVT. In order to obtain the data from SIARS database, the study was firstly submitted to the Ethics Committee of the ARSLVT for revision of adequacy of the scope of the study to the potential impact on the development of current scientific knowledge and also to assure that the information obtained from the database is adequate for the study and is handled in an adequate manner to maintain confidentiality. After replying to a clarification request from this Ethics Committee, approval for the study was obtained on April 16th, 2015 (see annex I).
Purchase power per capita and per county data was obtained from a public accessible
database held by INE / Pordata (www.ine.pt and www.pordata.pt). The most recent available information was from 2011, hence purchase power per capita and per county data from 2012, 2013 and 2014 was considered the same as for 2011.
Data Analysis
Data from drug prescriptions and acquisitions (refer to section 2.1) between July 1st, 2010 and
June 30th, 2014 were obtained and analysed. Despite the population of the study is composed only by
the newly diagnosed patients with T2DM in the first three months of 2011 and until the end of 2013, data was obtained for more than this timeframe since: for the period from July 1st, 2010 until
December 31st, 2010, we were able to exclude patients that had initiated treatment previously as each
18 which patient can fill a prescription in the pharmacy; data from January 1st, 2014 until June 30th, 2014
assured that all patients in the cohort were followed up for a period of three years after treatment initiation, in case the first prescription was filled after March 31st, 2011.
Firstly, raw data obtained from SIARS was pre-verified to detect incomplete information, errors or inconsistencies and then a table was constructed to gather the following information: identification of the first and last prescriptions filled by each patient; calculation of expected second- and third-year dates after first prescription date filled by the patient; duration of each medication package; gather prescription institutions into publically and privately held units (primary care units and hospitals); identification of the number of different antidiabetic classes used by each patient; age stratification; associate civil parish with the correspondent county; purchase power per capita and per county; gather prescribers in family doctor or other; calculate the number of different prescribers for each patient; calculate the average monthly co-payment by pharmacotherapeutic group per patient.
By identifying the first and last prescription filled by each patient, patients that did not start treatment until June 2011 and whose follow up period is less than 3 years were detected and eliminated from the study.
Expected dates for second and third years were calculated based on the date of the first prescription of any antidiabetic drug acquired by the patient. A grace period of 30 days after the date of the last prescription of any antidiabetic drug filled was considered for the end of treatment and this final date was used to compare with the second- and third- year theoretical dates after the patient’s treatment initiation date. If the date of the end of treatment (i.e.. the date of the last prescription filled plus its theoretical duration) was lower than the expected date for second and third-year, patient would be considered as non-persistent.
The cost per unit and per month for the patient and for each medication package were firstly calculated (insulins were the only drug whose average price was equal to 0€, since this is fully reimbursed by the SNS). Afterwards, the average monthly cost per pharmacotherapeutic group was obtained in an attempt to minimise the bias originated by different prices within the same international non-proprietary drug name.
19 The number of different antidiabetic classes by patient may impact long term persistence as usually complex therapeutic schemes are correlated with more errors in terms of dosage and intake which lowers compliance1. This co-variable was dichotomised into patients that took only one
antidiabetic class throughout the three year follow up and those that took equal to or more than two different type of therapeutic class.
Age was stratified in patients with 18 till 65 years old (adults) and patients with more than 65 years old (elderly). Elderly often take more drugs than adults which may impact long term persistence as well1.
Since the purchase power per capita was only available for each county in the Pordata portal, each civil parish had to be associated with the correspondent county. Counties with equal or more than 4% of the total amount of patients were considered big counties. Furthermore, purchase power
per capita and per county was dichotomised into less than 100.00% (average national purchase power
per capita) and equal or more than 100.00%.
Relationship between patient and physician was gathered into three categories: sporadic, without family physician and without family physician by option were all considered as not family physician; family physician and unknown for patients whose physician code was not available. It is assumed that a patient that is regularly followed by a medical physician will be more compliant than a patient that is consulting different physicians1.
The increasing number of physicians may be associated with more antidiabetic prescriptions which ultimately can lead to non-persistence to drug treatment1. Since the physician code was known,
it was possible to analyse and verify the number of different codes (i.e. different physicians) for each patient. This co-variable was dichotomised in one prescriber or more than one prescriber.
All categorical variables were described by absolute frequencies and correspondent percentages within each group.
Persistence will be quantified as the percentage of patients that continued to purchase at least one type of antidiabetic at year 2 and 3 after the date of first prescription acquisition.
The association between persistence at second and third years with each of the other co-variables extracted from the SIARS and Pordata databases (gender, age, purchase power per capita
20 in the regression logistic model with a confidence interval of 95%. The model was adjusted by the Hosmer-Lemeshow model.
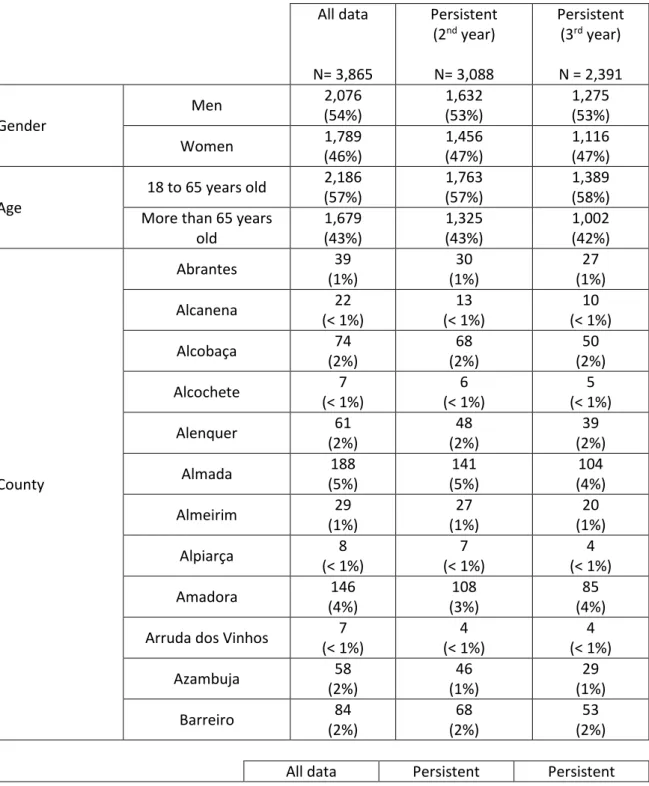
21 The initial file obtained from SIARS had data from 8539 patients from July 2010 until June 2014. Data related to patients that had a prescription prior to January 1st, 2011 were eliminated leaving only 4065 patients. 609 patients did not have information on the date of T2DM diagnosis, hence were removed and the file remained with 3865 patients which were diagnosed with T2DM (code T90 from ATC) between January 1st until March 31st, 2011. All data obtained and processed was summarised in tables 1 and 2.
Table 1 – Summary of results obtained for processed data and for second- and third-years persistent
All data
N= 3,865
Persistent (2nd year)
N= 3,088
Persistent (3rd year)
N = 2,391
Gender
Men 2,076 (54%)
1,632 (53%)
1,275 (53%) Women 1,789
(46%) 1,456 (47%) 1,116 (47%) Age
18 to 65 years old 2,186 (57%)
1,763 (57%)
1,389 (58%) More than 65 years
old 1,679 (43%) 1,325 (43%) 1,002 (42%) County
Abrantes 39 (1%)
30 (1%)
27 (1%) Alcanena 22
(< 1%)
13 (< 1%)
10 (< 1%) Alcobaça 74
(2%)
68 (2%)
50 (2%) Alcochete 7
(< 1%)
6 (< 1%)
5 (< 1%) Alenquer 61
(2%)
48 (2%)
39 (2%) Almada 188
(5%)
141 (5%)
104 (4%) Almeirim 29
(1%)
27 (1%)
20 (1%) Alpiarça 8
(< 1%)
7 (< 1%)
4 (< 1%) Amadora 146
(4%)
108 (3%)
85 (4%) Arruda dos Vinhos 7
(< 1%)
4 (< 1%)
4 (< 1%) Azambuja 58
(2%)
46 (1%)
29 (1%) Barreiro 84
(2%)
68 (2%)
53 (2%)
22 N= 3865
(2nd year)
N= 3088
(3rd year)
N = 2391
County (continuation)
Benavente 58 (2%)
44 (1%)
36 (2%) Cadaval 33
(1%) 19 (< 1%) 14 (1%) Caldas da Rainha 79 (2%) 67 (2%) 56 (2%) Cartaxo 23
(1%)
21 (< 1%)
14 (1%) Cascais 134
(3%)
113 (4%)
96 (4%) Chamusca 16
(< 1%)
12 (< 1%)
9 (< 1%) Constância 2
(< 1%)
2 (< 1%)
1 (< 1%) Coruche 32
(1%)
26 (1%)
19 (< 1%) Entroncamento 22
(1%) 13 (< 1%) 10 (< 1%) Ferreira do Zêzere 5 (< 1%) 6 (< 1%) 5 (< 1%) Golegã 11
(< 1%)
7 (< 1%)
7 (< 1%) Lisbon 398
(10%)
297 (10%)
211 (9%) Loures 203
(5%)
152 (5%)
108 (5%) Lourinhã 39
(1%)
31 (1%)
24 (1%) Mação 17
(< 1%)
16 (1%)
13 (< 1%) Mafra 27
(1%)
22 (1%)
18 (1%) Moita 25
(< 1%)
18 (1%)
12 (1%) Montijo 31
(1%)
27 (1%)
23 (1%) Nazaré 25
(1%)
17 (1%)
14 (1%) Óbidos 16
(< 1%)
14 (< 1%)
13 (1%) Odivelas 129
(3%)
102 (3%)
66 (3%) Oeiras 184
(5%)
144 (5%)
101 (4%) Ourém 63
(2%)
47 (2%)
23 All data
N= 3865
Persistent (2nd year)
N= 3088
Persistent (3rd year)
N = 2391
County (continuation)
Palmela 4 (< 1%)
3 (< 1%)
2 (< 1%) Peniche 131
(3%)
115 (4%)
97 (4%) Porto de Mós 1
(< 1%)
1 (< 1%)
1 (< 1%) Rio Maior 36
(1%) 24 (1%) 17 (1%) Salvaterra de Magos 12 (< 1%) 9 (< 1%) 6 (< 1%) Santarém 97
(3%)
70 (2%)
46 (2%) Sardoal 4
(< 1%)
4 (< 1%)
1 (< 1%) Seixal 205
(5%)
181 (6%)
149 (6%) Sesimbra 39
(1%)
34 (1%)
27 (1%) Setúbal 90
(2%)
74 (2%)
57 (2%) Sintra 295
(8%) 230 (7%) 168 (7%) Sobral de Monte Agraço 6 (< 1%) 4 (< 1%) 4 (< 1%) Tomar 45
(1%)
34 (1%)
27 (1%) Torres Novas 60
(2%)
42 (1%)
28 (1%) Torres Vedras 54
(1%)
45 (1%)
36 (2%) Vila Franca de
Xira 480 (12%) 427 (14%) 379 (16%) Vila Nova da
Barquinha 11 (< 1%) 8 (< 1%) 8 (< 1%) Purchase power
per capita per county Less than 100.00% 1,342 (35%) 1,083 (35%) 842 (35%)
Equal of more than 100.00% 2,523 (65%) 2,005 (65%) 1,549 (65%) Number of different pharmacotherap eutic groups
One 2,065 (53%)
1,498 (49%)
1,100 (46%)
More than one
24 All data
N= 3865
Persistent (2nd year)
N= 3088
Persistent (3rd year)
N = 2391
Relationship physician/patient
Unknown 911 (24%) 795 (26%) 684 (29%) Family physician 2525 (65%) 342 (11%) 1446 (60%) Not family physician 429 (11%) 1951 (63%) 261 (11%) Number of prescribers
One 1,441 (37%)
937 (30%)
696 (29%) More than one 2,424
(63%)
2,151 (70%)
1,695 (71%)
It was observed that 80% of the initial patients (3,088) were still refilling their prescriptions at the end of the second year after the first antidiabetic drug(s) acquisition. In the end of the third year after the first prescription acquisition, this value decreased to 2,391 patients (62%) who were still buying their medicines for T2DM.
From the 3,865 patients diagnosed with T2DM, it was verified that more men were than women from January to March 2011 (54% vs. 46%, respectively). In the second year after treatment initiation, 444 male patients, corresponding to 1% of the initial men population, discontinued antidiabetic medications and further 357 male patients did it until the end of the third year; in contrast to female patients, where only 353 discontinued treatment by the end of the second year after treatment initiation and 340 in the third year. Interestingly, the ratio of males and females throughout the study remained approximately the same (54% vs. 46% in the first year and 53% vs. 47% in the second and third years).
The majority of initial diagnosed patients belonged to the category from 18 to 65 years old (57%) whereas elderly accounted for 1,679 patients (43%). Despite more patients (434 patients) with 18 to 65 years old decreased the refilling of prescriptions from the first to the second year after treatment initiation in comparison with elderly patients (354 patients), the ratio between these two groups remained the same in the second year. In the last year of follow up, patients continued to withdraw treatment, nevertheless there was a 1% increase in the proportion of patients with 18 to 65 years old who remained on treatment.
25 Vinhos, Chamusca, Ferreira do Zêzere, Golegã, Mação, Óbidos, Palmela, Porto de Mós, Salvaterra de Magos, Sardoal, Sobral de Monte Agraço e Vila Nova da Barquinha had less than 1% of the total patients identified and included in the study.
At second year after treatment initiation and despite the decreasing number of persistent patients, Seixal and Vila Franca de Xira increased their quota to 6% and 14%, respectively, four other big counties (Almada, Lisbon, Loures and Oeiras) maintained the percentage of persistent patients and Amadora and Sintra lowered their contribution to 3% and 7%, respectively. Cascais and Peniche increased their relevance to 4% and the majority of the remaining counties maintained their contributions.
Vila Franca de Xira increased to 16% the percentage of persistent patients in the end of the third year after treatment initiation in comparison with previous year and Amadora returned to the persistent ratio it had in the beginning of the study (4%). Remaining big counties either decreased their ratio (Lisbon to 9%, Oeiras and Almada to 4%) or maintained it (Loures, Seixal, Sintra, Cascais and Peniche) relating with the previous year.
Thirty five percent of the counties had a purchase power per capita and per county lower than the national average purchase power per capita (considered 100%). The ratio between counties with
purchase power per capita and per county lower and equal or more than the national average
purchase power per capita remained the same throughout the three years of patients’ follow up.
Interestingly, all big counties’ purchase power per capita was higher than the national average, except for Seixal and Peniche.
Almost 53% of the initial patients were prescribed only one pharmacotherapeutic class and this value reduced over the time to 46%. In contrast, less patients started on two or more pharmacotherapeutic drugs and gradually increased by 7% at year three.
Regarding the relationship physician/patient, despite a significant percentage of data whose relationship was not available (24%, 26% and 29% at first, second and third years, respectively), the majority of patients were initially (65%) consulted by the family doctor and then at the third year (60%). At the second year, the major contributor for the prescriptions were other physicians (63%), in contrast with 11% for first and third years after treatment initiation.
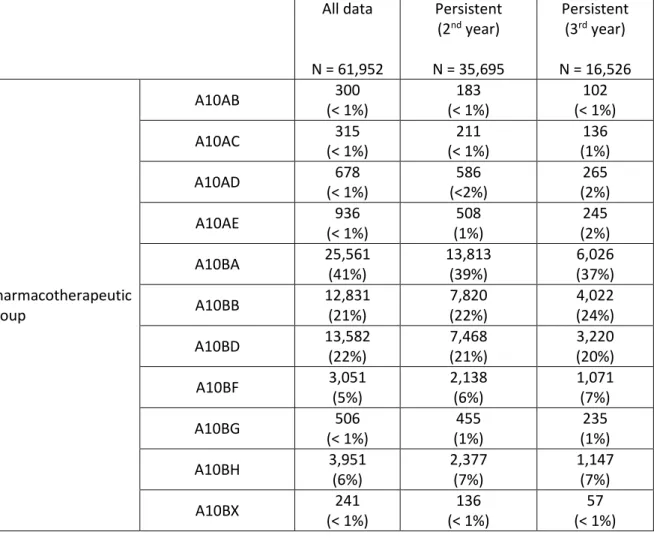
26 In a separate analysis, the total number of packages acquired by patients per pharmacotherapeutic group and all institutions of prescriptions were verified (table 2).
Sixty one thousand nine hundred fifty two packages regardless of dimensions were dispensed during the three year follow up period with almost all packages belonging to five main pharmacotherapeutic groups: biguanides (A10BA); sulphonylureas (A10BB); combinations of blood glucose lowering drugs, excluding insulins (A10BD); alpha-glucosidase inhibitors (A10BF) and dipetidil peptidase 4 inhibitors (A10BF). For biguanides and combinations of blood glucose lowering drugs, excluding insulins, the proportion of these classes decreased from the initial period (41% and 22%, respectively) to the third year after treatment initiation (37% and 20%, respectively). Inversely, sulphonylureas, alpha glucosidase inhibitors and dipeptidil peptidase 4 inhibitors increased their contribution throughout the study, from 21% to 24%, 5% to 7% and 6% to 7%, respectively.
Table 2 – Number of Packages per Pharmacotherapeutic Group and per Institution
All data
N = 61,952
Persistent (2nd year)
N = 35,695
Persistent (3rd year)
N = 16,526
Pharmacotherapeutic group
A10AB 300 (< 1%)
183 (< 1%)
102 (< 1%) A10AC 315
(< 1%)
211 (< 1%)
136 (1%) A10AD 678
(< 1%)
586 (<2%)
265 (2%) A10AE 936
(< 1%)
508 (1%)
245 (2%) A10BA 25,561
(41%)
13,813 (39%)
6,026 (37%) A10BB 12,831
(21%)
7,820 (22%)
4,022 (24%) A10BD 13,582
(22%)
7,468 (21%)
3,220 (20%) A10BF 3,051
(5%)
2,138 (6%)
1,071 (7%) A10BG 506
(< 1%)
455 (1%)
235 (1%) A10BH 3,951
(6%)
2,377 (7%)
1,147 (7%) A10BX 241
(< 1%)
136 (< 1%)
27 Institution of
Prescription
Public primary care units
53,917 (87%)
32,128 (90%)
15,116 (92%) Private primary care
units
5,195 (8%)
1,853 (5%)
627 (4%) Public Hospitals 2,830
(5%)
1,714 (5%)
783 (5%) Private Hospitals 10
(< 1%)
0 0
The majority of the prescriptions were obtained in public primary care units throughout the study. Indeed, the proportion of prescriptions from this setting increased during the study timeframe and reached the highest percentage at third year after treatment initiation. The contribution from private primary care units decreased to half from the start of the study until year 3 (8% to 4%). Public
hospitals’ proportion remained unchanged in the study and private hospitals did not prescribe any
study drug on the second and third years after treatment initiation.
To evaluate the association between persistence at the second year after treatment initiation and several co-variables, a Qui-Square test was used and the following p-values were obtained: number of different pharmacotherapeutic groups (p = 0.000), age (p = 0.183), gender (p = 0.032), purchase power per capita and per county (p = 0.363), number of different prescribers (p = 0.000), institution of prescription (p = 0.000), pharmacotherapeutic group (p = 0.000), relationship with the physician (p = 0.000), average cost per month and per pharmacotherapeutic group (p = 0.000). All variables were selected for the model, except for purchase power per capita and per county whose p
value was higher than 0.25.
Odds ratios for a confidence interval of 95% were afterwards calculated: number of different pharmacotherapeutic groups (OR = 2.167, 1.807 – 2.598, p = 0.000); age (OR = 0.914, 0.772 – 1.081, p = 0.294); gender (OR = 1.163, 0.983 – 1.377, p = 0.079); number of different prescribers (OR = 3.594, 3.030 – 4.262, p = 0.000); institution of prescription (OR = 0.725, 0.698 – 0.753, p = 0.000); pharmacotherapeutic group (OR = 1.056, 1.043 – 1.069, p = 0.000); relationship with the physician (OR = 0.834, 0.816 – 0.852, p = 0.000) and average cost per month and per pharmacotherapeutic group (OR = 0.954, 0.942 – 0.968, p = 0.000).
28 prescription (p = 0.000), pharmacotherapeutic group (p = 0.000), relationship with the physician (p = 0.000), average cost per month and per pharmacotherapeutic group (p = 0.000). All variables were selected for the model, except for gender and purchase power per capita and per county whose p-
value was higher than 0.25.
29
DISCUSSION
An indirect approach based on claims database was used in this study assess the long term therapy persistence in newly diagnosed diabetic type II patients in the Lisbon and Tagus Valley region from January until March 2011 and also to identify persistence predictors based on several co-variables extracted from the SIARS and Pordata databases. This approach is the most adequate to use in Portugal since almost all prescriptions are co-paid by the National Health Service and every pharmacy has to submit all the prescriptions filled to a governmental bureau in order to be reimbursement. SIARS database gets data from this database which encompasses a large number of information ranging from patient to medications prescribed and dispensed or from the institution of prescription to the physician number.
Interestingly, the primary objective of this study, i.e., therapy persistence obtained two years after the first prescription acquisition by the patient (80%) is higher than what has been mentioned in literature where values for second-year persistence are around 45% and 65%, depending on the antidiabetic drug being analysed21,22.
No data is available for periods longer than two years, however third-year results (62%) are quite similar to those described for the first and second years after primary adherence.
30 common and the possibility for the patient to acquire antidiabetics from other sources (relatives or without a prescription) may underestimate long term therapy persistents.
The results from this study stated that more men were diagnosed with T2DM from January until March 2011. Despite not having incidence results per gender, prevalence data confirms that this pathology affects more men than women8. Since the variable age was dichotomised into two groups,
it cannot be compared with the prevalence in Portugal.
Fifty counties were not equally represented in this study which may affect some variables such as purchase power. Not surprisingly, counties with more population had more persistents.
The number of different antidiabetic drugs may not correlate with an increase in complexity of the treatment and one may be discontinued and the other initiated instead (switch).
The pharmacologic approach in the T2DM is complex and based on several criteria, namely efficacy, cost, potential side effects and patient preferences. Nevertheless, it was interesting to verify that the major first line oral antidiabetic, biguanide (metformin), was the treatment with more number of presciptions8.
Of note is the fact that a patient living in a poorer or richer county (purchase power per capita
less than 100%) does not associate with better or worse persistence at second and third years, especially when the cost of medications are known to negatively impact adherence1. These results
may be biased by having more than 60% of patients from rich counties.
Regarding the potential factors that may or may not increase long term therapy persistence at the second year after drug treatment initiation it was noticed that taking only one antidiabetic drug from an unique pharmacotherapeutic group may is associated with an increase in 2,167x of the risk of being less persistent than taking more than one type of antidiabetic, which may be explained by the fact that a high number of pharmacotherapeutic groups may not correlate with higher complexity, but instead with switching of drugs. Having between 18 and 65 years old may slightly correlate with a better persistence (increase of 8.6%), although this difference is not statistically significant; interestingly, some studies mentioned that being elderly correlates better with adherence to treatment23. Although not statistically significant, being a male slightly increases 1,163x the probability
of being non persistent which is in accordance and in contrast to some studies at the same time1,23;
sample size may account for these variety of results. Visiting only one physician is strongly associated (3,594x) with poorer persistence (again not statistically significant) which is particularly curious since by consulting the same physician, it should be expected that this would increase the awareness in the
31 and the treatment between physician and patient may play a role in explaining these results, however this cannot be accessed through claims databases. The institution where the drug is prescribed appears to reduce the risk of discontinuation by 27.5% whereas the type of antidiabetic drug prescribed can slightly increase the risk for discontinuation by 1,056x. The relationship with the physician can also translate into an increase of 16.6% in persistence and this is in line with the literature reviews23; nevertheless it is important to note that a high percentage of unknown data may
have biased this result. Finally, the average cost per month and per pharmacotherapeutic group slightly positively affect persistence by 4.5%, which opposes to several studies23.
At the third year after initiating treatment taking different drugs from several therapeutic groups seems to be associated with an increase in 1,863x discontinuation which is mentioned by some studies1. Although not statistically significant, younger age may correlate with a slight more probability
(12.5%) of being persistent which is also confirmed and denied by studies; this mix of results may be the result of the contribution of confounding factors such as socioeconomic environment and not only to the age itself1,23. Consulting several physicians increases the risk of discontinuation by 2,167x which
is in line with literature review due to probably more confusion in therapeutic schemes23. The
institution of prescription contributes for a less discontinuation rate by 31.7% whereas the type of drug used slightly worsens persistence by 1,077x. The relationship with the physician seems to positively influence persistence, nevertheless, caution must be taken while discussion these results since a high percentage of unknown data (29%) may have biased the effect of this variable. Lastly, the average cost per month and per pharmacotherapeutic group also may contribute for more three-year persistents by 7%.
32
CONCLUSIONS AND FUTURE PERSPECTIVES
This study aimed the evaluation of the therapy persistence at second and third years after treatment initiation and to identify potential variables that may affect these outcomes in a cohort with 3,865 patients diagnosed with T2DM during January to March 2011 in the Lisbon and Tagus Valley region.
Therapy persistence obtained was 80% and 62% for the second and third years after treatment initiation. Second year value is slightly above of what is referenced in literature and no data was found to compare the third year value.
Regarding the effect of the co-variables analysed at second and third years after treatment initiation, the results were overlapping with the number of different pharmacotherapeutic drugs and prescribers and pharmacotherapeutic group negatively impacting persistence and age, institution of prescription, relationship with physician and average cost per month and per pharmacotherapeutic group increasing it. The only exception was gender which was only associated with persistence at the third year.
33
REFERENCES
1. Adherence to Long Term Therapies: Evidence for Action. World Health Organization. Geneva: World Health Organization, 2003. Available at http://www.who.int/chp/knowledge/publications/adherence_full_report.pdf
2. Ascertaining Barriers for compliance: policies for safe, effective and cost-effective use of medicines in Europe. Medical University of Lodz. Polond, 2012. Available at http://abcproject.eu/img/abc%20final.pdf
3. Andrade S, Kahler K, Frech F, Chan k. Methods for evaluation of medication adherence and persistence using automated databases. Pharmacoepidemiology and drug safety, 2006; 15: 565–574, DOI: 10.1002/pds.1230.
4. Vrijens B, De Geest S, Hughes A. A new taxonomy for describing and defining adherence to medications. British Journal of Clinical Pharmacology, 2012; 73(5):691-705. DOI: 10.1111.
5. Raebel M, Ellis J, Carroll N, Bayliss E, McGinnis B, Schroeder E, Shetterly S, Xu S, Steiner J. Characteristics of Patients with Primary Non-adherence to Medications for Hypertension, Diabetes, and Lipid Disorders. Journal of General Internal Medicine, 2011; DOI: 10.1007/s11606-011-1829-z.
6. Halpern MT, Khan ZM, Schmier JK, Burnier M, Caro JJ, Cramer J, Daley WL, Gurwitz J, Hollenberg NK. Recommendations for Evaluating Compliance and Persistence with Hypertension Therapy Using Retrospective Data. Hypertension. 2006; 47:1039-1048.
7. American Diabetes Association. Standards of Medical Care in Diabetes. The Journal of Clinical and Applied Research and Education. January 2015: volume 28: supplement 1. Available at
34 8. Sociedade Portuguesa de Diabetologia. Diabetes: Factos e Números 2014. Relatório Anual do Observatório Nacional da Diabetes Portugal, 2014. Available at http://www.dgs.pt/estatisticas-de-saude/estatisticas-de-saude/publicacoes/diabetes-factos-e-numeros-2014-pdf.aspx
9. Sociedade Portuguesa de Diabetologia. Diabetes: Factos e Números 2013. Relatório Anual do Observatório Nacional da Diabetes Portugal, 2014. Available at https://www.dgs.pt/paginaRegisto.aspx?back=1&id=25163
10. Infarmed. Consumo de Antidiabéticos 2000-2013. 2014. Available at http://www.infarmed.pt/portal/page/portal/INFARMED/MONITORIZACAO_DO_MERCADO/OBSERV ATORIO/INTRODUCAO_DE_FICHEIROS/Relatorio_Diabetes%20%281%29.pdf
11. Uva M, Antunes L, Nunes B, Rodrigues A, Dias C. Evolução da Taxa de Incidência anual de Diabetes entre 1992 e 2012 na população sob observação pela rede “Médicos-Sentinela”. Observações-Boletim
Epidemiológico, 2013. Available at
http://www.insa.pt/sites/INSA/Portugues/PublicacoesRepositorio/Documents/observacoesNEspecia 2-2013_artigo11.pdf
12. Okoro R, Kingsley C. Assessment of Patient’s anti-diabetic Medication Adherence levels in a non-comorbid Diabetes Mellitus. International Journal of Comprehensive Pharmacy, 2012; 7 (01).
13. American Diabetes Association (ADA) (2011) Diagnosis and Classification of Diabetes Mellitus. Diabetes Care, 34 Suppl 1, pp.S11-61. Available at http://care.diabetesjournals.org/content/27/suppl_1/s5.full
14. Carmona M, Caracterização (Fármaco) Epidemiológica da Diabetes Tipo 2 em Portugal. Tese de
Doutoramento, 2011. Available at
http://repositorio.ul.pt/bitstream/10451/5869/1/ulsd062274_td_Maria_Carmona.pdf
35 16. Egede L, Gebregziabher M, Dismuke C, Lynch C, Axon R, Zhao Y, et al. Medication Nonadherence in Diabetes. Diabetes Care journals, volume 35, 2012.
17. Lau D, Nau D. Oral Antihyperglycemic Medication Nonadherence and Subsequent Hospitalization Among Individuals With Type 2 Diabetes. Diabetes Care journals, volume 27, 2004.
18. Fischer M, Choudhry N, Brill G, Avorn J, Schneeweiss S, Hutchins D, Liberman J, Brennan T, Shrank W. Trouble Getting Started: Predictors of Primary Medication Nonadherence. The American Journal of Medicine, 2011. doi:10.1016/j.amjmed.2011.05.028.
19. National Council on Patient Information and Education. Enhancing Prescription Medicine Adherence: A National Action Plan. 2007. Available at http://www.talkaboutrx.org/documents/enhancing_prescription_medicine_adherence.pdf
20. Simard P, Presse N, Roy L, Dorais M, White-Guay B, Räkel A, Perreault S. Persistence and adherence to oral antidiabetics: a population-based cohort study. Acta Diabetol. 2014. Epub ahead of print. Available at http://www.ncbi.nlm.nih.gov/pubmed/25524433
21. Grégoire JP, Sirois C, Blanc G, Poirier P, Moisan J. Persistence patterns with oral antidiabetes drug treatment in newly treated patients--a population-based study. Value Health. 2010 Sep-Oct; 13(6):820-8. doi: 10.1111/j.1524-4733.2010.00761.x.
22. Farr AM, Sheehan JJ, Curkendall SM, Smith DM, Johnston SS, Kalsekar I. Retrospective analysis of long-term adherence to and persistence with DPP-4 inhibitors in US adults with type 2diabetes mellitus. Adv Ther. 2014 Dec;31(12):1287-305. doi: 10.1007/s12325-014-0171-3. Epub 2014 Dec 12.
36 24. Farr AM, Sheehan JJ, Curkendall SM, Smith DM, Johnston SS, Kalsekar I. Retrospective analysis of long-term adherence to and persistence with DPP-4 inhibitors in US adults with type 2 diabetes mellitus. Adv Ther. 2014 Dec; 31(12):1287-305. doi: 10.1007/s12325-014-0171-3. Epub 2014 Dec 12.
25. Cramer JA. A systematic review of adherence with medications for diabetes. Diabetes Care. 2004 May;27(5):1218-24.
37