Combining WLAN fingerprint-based localization
with sensor data for indoor navigation using
mobile devices
Dissertation supervised by
Doctor Raul Montoliu Colás
Doctor Roberto Henriques
Doctor Óscar Belmonte Fernández
ACKNOWLEDGMENTS
To my family for their eternal support on all aspects of my life, including but not only my
studies and to all teachers who helped me to find the path to this project, specially my
supervisor Raúl Montoliu Colás.
Also to all my friends and collaborators who helped me testing the application and for
sending me back the results.
Combining WLAN fingerprint-based localization
with sensor data for indoor navigation using
mobile devices
ABSTRACT
This project proposes an approach for supporting Indoor Navigation Systems
using Pedestrian Dead Reckoning-based methods and by analyzing motion
sensor data available in most modern smartphones. Processes suggested in
this investigation are able to calculate the distance traveled by a user while he
or she is walking. WLAN fingerprint- based navigation systems benefit from
the processes followed in this research and results achieved to reduce its
KEYWORDS
GIS Applications
Pedestrian Dead Reckoning
Motion Sensors
Position Sensors
ACRONYMS
DR – Dead Reckoning
PDR – Pedestrian Dead Reckoning
WLAN – Wireless Local Area Network
WI-FI – Wireless Fidelity
XML – eXtensible Markup Language
INIT – Institute of New Imaging Technologies
UJI – Universitat Jaume I
TABLE OF CONTENTS
ACKNOWLEDGMENTS...iii
ABSTRACT...iv
KEYWORDS...v
ACRONYMS...vi
INDEX OF FIGURES...ix
1 CHAPTER 1: INTRODUCTION...1
1.1 Introduction to the Thesis...1
1.2 Introduction to the Chapters...2
2 CHAPTER 2: NAVIGATION SYSTEMS...3
2.1 Introduction...3
2.2 Pedestrian Dead Reckoning...5
2.3 Applications of indoor navigation systems...5
3 CHAPTER 3: FINGERPRINT-BASED LOCALIZATION...9
3.1 Introduction...9
3.2 WLAN Fingerprints...10
4 CHAPTER 4: SYSTEM DESIGN...13
4.1 System Design Overview...13
4.2 IndoorNav General Operation...15
4.3 Step detection...18
4.4 Step distance estimation...19
4.5 Orientation...19
4.6 Data analysis...20
5 CHAPTER 5: TESTS AND MEASUREMENTS...23
5.1 Introduction...23
5.2 Walking distance...25
5.3 Climbing stairs...30
6 CHAPTER 6: FUTURE WORK AND CONCLUSIONS...41
6.1 Conclusions...41
6.2 Future Improvements...42
BIBLIOGRAPHIC REFERENCES...45
ATTACHMENTS...49
1. IndorNav relevant source code...49
INDEX OF TABLES
Table 1...27
Table 2...28
Table 3...33
Table 4...34
Table 5...35
Table 6...38
1 CHAPTER 1: INTRODUCTION
1.1 Introduction to the Thesis
Since its appearance, GPS navigators have become an extremely useful tool
for a great number of activities, whether they are personal or professional. As
time passed many people asked ourselves how was possible that in indoor
environments where this technology does not function, there is no any other
technology that allows the same benefits, like inside buildings or
underground.
Why there is still no another positioning and navigation system implemented
and widely known and ass effective indoors than outdoors? Is it possible to
develop a system capable of doing it? Many people have asked themselves
these questions and are trying to resolve the problem. This project has raised
the callenge to discover whether using current technologies we can develop
a system capable of doing it.
Moreover, this research is motivated by the fact that Indoor Navigation
Systems are an unexploited business area. Therefore, building a robust
system capable of locating and routing inside buildings has a high
economical potential. Worldwide IT companies know it and are researching
and investing much resources on this (Costa T. et al, 2013).
Smartphone sensors help other positioning systems to improve its accuracy
and efficiency and reduce computation costs. It may also reduce the battery
usage. Most of modern smartphones today have sensors that are capable of
detecting physical quantities and convert them into signals that can be read
user of the smartphone is doing different activities, like walking, climbing
stairs or standing (Jennifer R. Kwapisz, 2011).
By measuring the data obtained by the sensors, it is possible to detect the
number of steps and calculate the step length, and even the orientation of
this steps and predict its new position. In this research project, the sensors
required are the accelerometer and the compass. Both of them are present in
most modern smartphones.
Among research teams investigating worldwide positioning and navigation
systems in indoor environments is the Institute of New Imaging Technologies
(INIT), a departement in the University Jaume I of Castelló, who are working
on a WLAN fingerprint-based localization system called Perception that is
expected to allow indoor and outdoor positioning and navigation through all
the campus of the university. The investigation and results from this project is
expected to provide them help on their own research and development of
their ongoing projects.
1.2 Introduction to the Chapters
This Chapter 1 is an introduction to the Master's Thesis project and contains
the key Thesis statements. The Chapter 2 is a general overview of the
Navigation Systems and state-of-the-art in Indoor Positioning Systems.
Chapter 3 introduces the concept of fingerprint-based systems and the Smart
Campus project. Chapter 4 starts with an overview of the system design and
follows with an in detail software and calculus methods developed. Chapter 5
shows the measurements, tests and results obtained. Finally, in Chapter 6
conclusions and future developments are discussed.
2 CHAPTER 2: NAVIGATION SYSTEMS
2.1 Introduction
During the last twenty five years many new technologies have allowed the
mass-market production of devices and applications capable of be positioned
around the Earth with a very high accuracy level (Krakiwsky, E. J et al, 1988).
Nowadays it is possible to drive a car on a foreign country or walk the streets
of a city just using the indications of a device. This has been achieved thanks
to two main technology hits:
• Opening of the GPS for public access.
• Cheap mobile devices with integrated CPU.
The GPS signal offers positioning of a receiver with high accuracy for outdoor
environments purposes and many people can buy an inexpensive device that
can be positioned using that system around the world.
On the other hand, indoor positioning systems have not been implemented
with this success yet because one of that two technologies is not available
inside buildings or underground. The GPS signal is not strong enough to
penetrate current construction materials, so it is not possible to use it indoor
(Chen et al, 2000).
However, a lot of resources are being invested in indoor navigation systems.
In the University Jaume I (UJI) of Castelló, Google already has a positioning
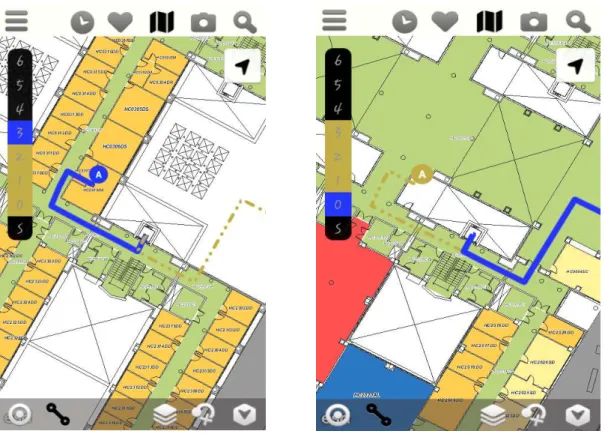
system and all buildings are mapped. Figure 1 shows a screenshot of the
Figure 1: An screenshot of the Google Indoor Map application showing one of the buildings in the UJI. All rooms and different services are labeled in the map.
The Institute of new Imaging Technologies (INIT), a Department of the UJI, is
investigating in different alternatives to the one from Google like the
IndoorLoc for locating people and IndoorNav for navigating. Both of them are
currently working together and included in the Smart Campus. Figure 2
presents the mapping of the buildings.
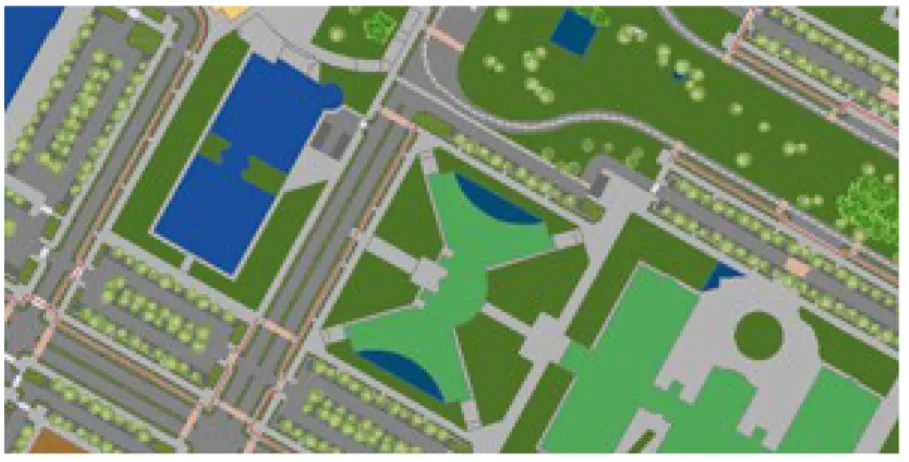
Figure 2: UJI overview with the Smart Campus, based on ESRI technologies.
2.2 Pedestrian Dead Reckoning
In navigation, dead reckoning is the process of obtaining the current position
of someone using analytical methods, based on its previous or initial position,
its course and speeds over elapsed time.
This systems are based on detecting steps and steps headings, and
integrating over them to estimate the current user position. Different
approaches of this method are possible to see in (Qian Wang, 2013) and
(Link, J.A.B. et al, 2011).
An inertial navigation system (INS) is a navigation aid that uses a computer,
motion sensors (accelerometers) and rotation sensors (compasss) to
continuously calculate via dead reckoning the position, orientation, and
velocity (direction and speed of movement) of a moving object without the
need for external references.
2.3 Applications of indoor navigation systems
Most of the approaches suitable for outdoor have been and are being
designed and adapted for indoor navigation.
Augmented reality
Augmented reality systems are already available for tourists that visit
monuments around the city (Sung, D. 2011). For example it is possible to
shows the user information about it, like opening and closing time for visiting
or the entrance price.
In an indoor environment augmented reality can be adapted for guiding
people through a visit of a museum, with information on the objects exposed
depending on the room or zone where the users are located. The INIT has
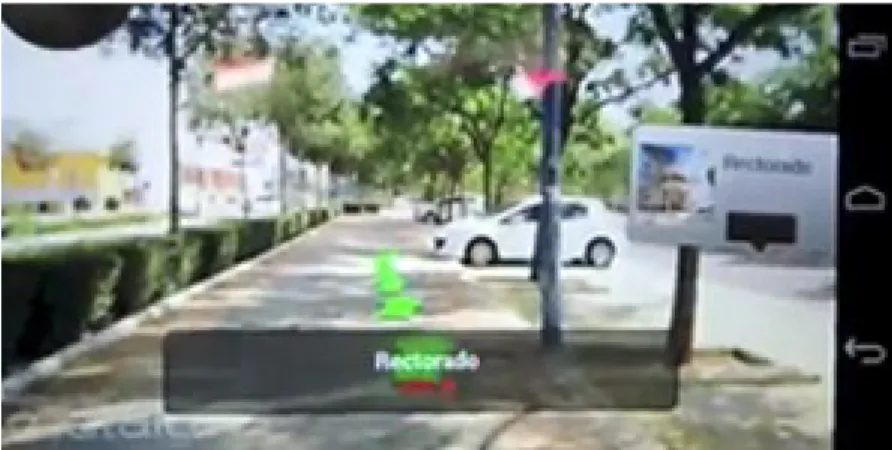
also a project called SmartUJI: Augmented Reality (see Figure 3), that
currently work for outdoor environments to guide a user to his or her
destination in an immersive and intuitive way. On the near future, it will work
indoors too, allowing users to move all around the campus.
Figure 3: A screenshot of the SmartUJI: Augmented Reality application for Android OS devices, being developed currently also for usage in indoor environments.
Locating and searching articles in stores
Locating and searching for a certain article in a store or library can frustrate
people. There exist already systems that take a list of items that a customer
wants to buy in a store, and creates a route through the building and guides
users to the position of each one of them. Similarly, locating items in
warehouses and routing through them can help to reduce costs to
companies.
Airports
The use of mobile technologies on airports allows users to avoid congestion
on certain security gates and reduces queues and time searching for the right
check-in desk and boarding gate.
Emergencies
In an emergency situation, a robust indoor positioning system help services
personnel to know where people is located and take decisions accordingly.
Furthermore, users can benefit from it if they get information on how to
proceed. One emergency exit might be blocked by some incident, or it is too
3 CHAPTER 3: FINGERPRINT-BASED
LOCALIZATION
3.1 Introduction
Many different approaches exist for finding a device position inside a
building. However, there is still no standard system widely extended around
the world.
Indoor localization systems detect objects or people wirelessly inside a
building (Kevin Curran et al, 2011). There exist many different solutions and
technologies for detecting an object.
Passive radio-frequency systems detect the moment an object or person
enters its range. An easy example of this is the sensor of an elevator, that
detects that something or someone crossed the door with a senor, to prevent
closing the gates.
Other common localization systems use the angle of arrival for determining
the position of an object using radio-frequencies. More infrastructure is
required in this approach, as the time difference of arrival of the signals are
3.2 WLAN Fingerprints
The concept of WLAN fingerprints builds on the signal strength indicators
received on the sensors. Emitted signal strength are constant, they depend
only of the device used. On the other hand, this signal is received is
attenuated on the receiving sensor, so the position of the emitter can be
estimated.
A lot of systems use WI-FI infrastructure to deal with indoor positioning.
Unfortunately there exist a lot of noise in the signals transmitted. On the other
hand, the fact that WI-FI infrastructure is widely available benefits the
inversion expenses (Chang N. et al, 2010 or Chiou Y. et al, 2010).
If the signals are received by more than one device, the accuracy is
increased, as it is possible to compare the strength of the signals and
estimate its position with more precision.
A great advantage of the WIFI positioning systems is that most modern
smartphones already have built-in antennas.
The Perception Project
Perception is a project that aims to provide localization and navigation in
indoor environments. The core of its implementation is a system based on
the comparison of WLAN fingerprints obtained in one spot with other
previously obtained and stored in a database. They are also investigating on
magnetic sensors present on smartphone.
Figure 4: The INIT navigation system.
To better understand how a fingerprint-based system works we can see a
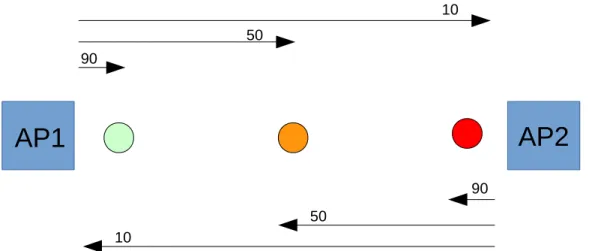
representation in Figure XX. Internet Access Points (AP) allow users to
connect to the Internet using WiFi. As there are many of these access points
around all building inside the campus, it is possible to detect from any given
Figure 5: The green spot recevies an intensity of 90 from the AP1 and 10 from the AP2. The orange spot receives the same 50 intensity from both AP and they red point 10 from the AP1
and 90 from the AP2.
In Figure 5 we see that the green point detects an intensity or fingerprint from
the AP1 of 90, while just 10 from the AP2. On the other hand, the red point
detects an intensity of 90 from the AP2 and 10 from the AP1. The red point
sees an intensity of 50 for both AP1 and AP2.
These WiFi fingerprints are taken on different points en the campus and are
stored in a database. Later an application will compare the fingerprints that
are being detected in one spot, compare it to the previously taken from the
database and estimate the current position. For example, if it receives an
intensity of 80 from AP1 and 10 fro the AP2, it is likely that the current
position is nearer from the green point than from the other two.
12
AP1
AP2
10 50
90
10
50
4 CHAPTER 4: SYSTEM DESIGN
4.1 System Design Overview
The main goal in this research project is to implement a system to calculate
the walking distance and orientation of someone who is handling an Android
smartphone in his or her hands. Other physical activities should be analyzed,
like climbing or descending stairs, standing or using an elevator.
The first task has been implementing an application capable of retrieving raw
sensor data from the cell phone and saving it for later analysis. This first
program is called IndoorNav and is designed to be very simple and easy to
use for any person with an android device, not necessary someone with
developing skills. See Figure 6 and section 4.2 for a more detailed
description.
This application uses Android Jelly Bean, that ranges from 4.1.x to 4.3
versions of the its operating system. The decision of using this version is
based on two factors:
• It was the most used version of Android at the time, closing to 60% in
December 2013 (Official Android Developer web page).
• The UJI's Smart Campus project have as preferred at least Android
version 4.0.
After someone finished the test, this sensor raw data is sent by email for
Secondly, implementing a program capable of analyzing this raw data to
obtain human readable information. It has been developed with Java
program language and it performs a series of calculus and outputs
information in text format and diagrams. See section 4.5.
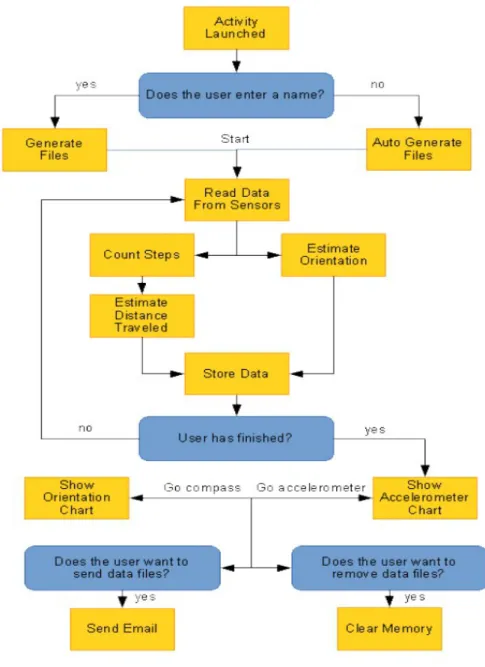
Figure 6: Workflow diagram of the IndoorNav application.
4.2 IndoorNav General Operation
In order to perform the installation of this application, file needs to be in the
device internal memory or in a memory card. Therefore it need to be sent to
the test user, for example, as an attachment of an email.
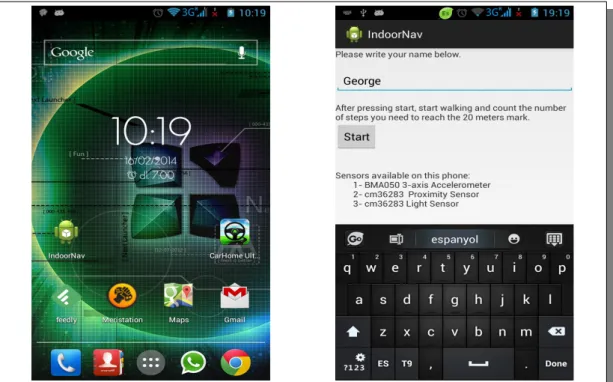
After the application is installed, it will appear like any other in the launcher's
main screen (Figure 7). As with any other Android application, the initial step
of the user to start it is to touch its icon titled IndoorNav on the screen.
Figure 7: On the left, how the application looks in an Android launcher.. On the right, the activity launched after the user touches the icon of the IndoorNav application, called Main
Activity.
Figure 8: The captured image on the left showing the Walking Activity seen by the user while is walking. The figure on the right presents the Accelerometer Plot Activity, with the
accelerometer captured data.
Figure 9: The user email application selection on the left, and the auto generated message if it does the operation with Google's Gmail.
When ready to perform the test, the user should be situated in the initial
position of the defined path, and is asked to touch the Start button. The
screen will change to the Walking Activity shown in the Figure 8. This second
activity shows the orientation of the user, if a compass sensor is present on
the device, and the number of steps and distance traveled.
While the tester is walking, this activity is capturing all sensor raw data and
storing it to two different files. One file will save the accelerometer behavior
and the other the compass', again just if available in the phone. See section
5.1 and Appendix III for a deeper description on how these files are created.
After the user reaches the point that marks the end of the path, he or she
needs to press the Next button for ending the sensor data collection and
allowing the application to move to the Accelerometer Plot Activity.
This Accelerometer Plot Activity in the Figure 8 presents a panel with three
buttons and a plot with the accelerometer sensor events that the application
has captured in the previous activity. In the chart shown in this plot, it is
already easy identifiable as 10 the number of steps performed by the tester
as 10 is the number of peaks in the diagram.
The buttons on the panel perform the following processes:
• Go Compass: This button moves to the Compass Plot activity.
• Send Email: Touching this button will generate an email message with
information about the phone used in the test and the data collected
with the sensors (figure 9).
• Clear Memory: The files generated during the test can be removed
By pressing the Send Email button, an email is auto generated with the
destination address, a subject and the body text. The files with the raw data
collected from the sensors are also automatically included as attachment, so
the user just need to select its favorite email client and send the message
(figure 9).
4.3 Step detection
One of the main goals of this project is to calculate the distance traveled
while walking through indoor environments using data collected from the
accelerometer sensor.
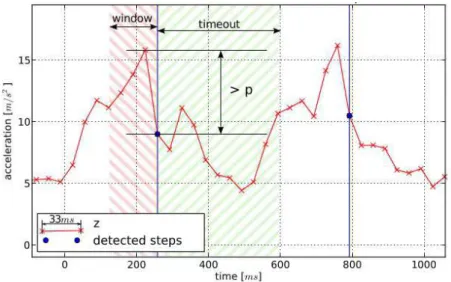
Specifically, a step is detected when it is found a change in the
accelerometer values of at least p = 2 m/s2 within a window of 5
consecutive events of the sensor. Additionally, a timeout of 333ms has been
added within any other accelerometer events are ignored, preventing over
detecting steps (Link, J.A.B. et al, 2011). See figure 10.
Figure 10: The user email application selection on the left, and the auto generated message if it does the operation with Google's Gmail.
4.4 Step distance estimation
After this system is able to detect the correct number of steps of a person
while is walking, another algorithm analyzes the accelerometer data to
calculate the length of each of the steps, to accumulate them into the total
distance traveled.,
The amplitudes of the acceleration events influences strongly on the walking
speed. Consequently, the step length can be approximated using the
following formula (Fang L., 2005):
Step lengh≈
√
4A max−A min×K
Amplitudes Amax and Amin are the maximum and minimum values of the
vertical acceleration events values withing the last 5 samples. K is a constant
that depends specifically on the user, although tests results show that the
difference is very low. Taking into account studies from (Fang L., 2005), this
K constant has been set to 0.55.
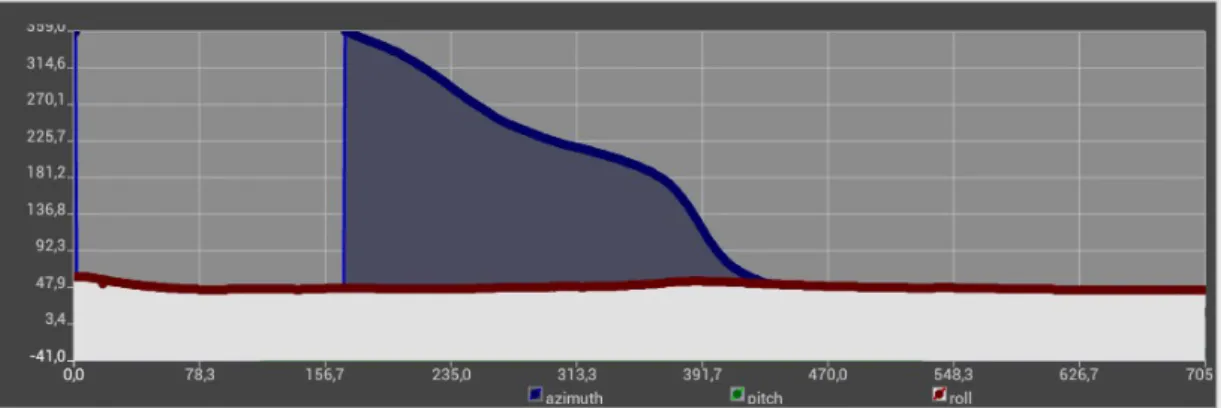
4.5 Orientation
For orientating the sensor used in modern phones is the compass, that
measure the three coordinates data in rad / sec . For getting the orientation of
the device it has been captured the azimuth values of each one of the
detected steps, and assigned that value to it. This value can be accessed
every time we want to get the orientation of this particular step, so it is
Figure 11: This diagram show the azimuth values obtained by the compass during a 360º turn.
Unfortunately the algorithms employed have not been able to retrieve useful
information regarding the orientation of the device in the real world. Compass
applications already available like Compass Plus and 3D Compass orientate
correctly after initial calibration and must be in a flat surface or without heavy
motion. For the purpose of this project, the sensor is in constant movement
and readings from them after analysis have not proved to be trustful as
needed.
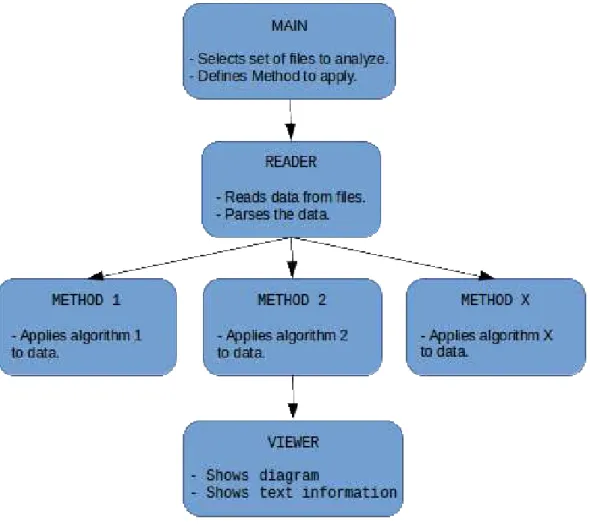
4.6 Data analysis
Using the IndoorNav application a lot of sensor data was gathered from
different users and scenarios. For analyzing this raw data a program has
been developed with the Java programming language.
Therefore, this piece of software first reads the files received by email from
the IndoorNav tests and parse them into usable formats types.
Secondly, applies different calculus over the sensor data, in order to
determine:
1. The kind of activity performed during the test.
2. The distance traveled and the orientation of the movement.
Finally, the outputs of these methods are shown as text or diagrams
depending on the convenience.
The Figure 12 shows a workflow chart of this analysis program.
Figure 12: The analysis program selects a folder with the sensor data files and defines to operate. The reader parses the data from the files for the methods that will process it. Finally,
5 CHAPTER 5: TESTS AND MEASUREMENTS
5.1 Introduction
Files generated by the IndoorNav application are formed by an XML header
that contains information about the device used during the test. This
information includes the manufacturer, the model of the phone, and the
sensors available. After this header, a list separated by comas store all the
events captured by device. See figure 13 for a visual explanation of the three
axis vectors.
In the accelerometer generated files, each line has the event number, the
x-axis, y-axis and z-axis acceleration values (in m/s2 ) and a timestamp.
In the compass generated files, each line has the event number, the azimuth,
pitch and roll values in rad/sec and a timestamp.
For evaluating that the algorithms explained in Chapter 4 behave in a
satisfactory way when using them together, and can be used effectively for
calculating the number of steps walked, the traveled distance and the
orientation during the path, a batch of tests have been prepared.
1. Distance traveled. A group of 11 collaborators will perform walks of 30
meters and 60 meters long. The data will be analyzed using the
combination of the two algorithms described in section 4.3 and 4.4.
2. Stairs: A group of 5 collaborators have climbed and descended stairs
in four tests. In the first, they have climb one floor. In the second they
have descended one floor. In the third and fourth tests, they have
climbed and descended three floors respectively.
5.2 Walking distance
Calculating the walking is the main objective in this research, and as results
will prove, it is possible to affirm that it has been successfully achieved.
First it has been implemented the method to detect steps. The accelerometer
sensor returns on each event one value in m/s2 for each of the 3 axis, vertical,
horizontal and longitudinal in relation with the ground. Some methods use all
the three axis obtained by the accelerometer sensor and then applying a
normalization to them (Ibarrilla Bonilla, M. N., 2011). The method finally
adopted just uses the z-axis vertical axis into account (see section 4.3 and
Fang L., 2005).
Figure 12 shows a diagram with the acceleration events obtained from the
sensor during a 10 steps walk. We can clearly see the peaks on each step,
highlighted with blue squares. It is also possible to observe in the Figure 14
that within a window of 5 events, there is an increase (and decrease) of more
than 2 m/ s2 .
For evaluating the methods selected to detect steps and calculate the
distance traveled, it was decided to walk on 30 meter and 60 meter long
spans. The reason why it has been chosen this two span lengths is because
this system is designed to work together with others, mainly WLAN
fingerprint-based localization systems, that will continuously locate the device
and position it on the estimated place.
Eleven people accepted to collaborate in this experiment and downloaded
and installed on their Android powered smartphones the IndoorNav
application. Their instructions on how to proceed were to write their name as
identification on the first screen after launching the application and, when
ready, touch the start button and start walking. When they arrived to the end
landmark, they should press the next button and send the results by email.
All files generated this way have later been analyzed by applying the
algorithms described in Chapter 4
In Table 1 we can see the results of the tests eleven people performed during
a 30 meter walk. As we can see, for some people like Subject 4 or Subject 9
the error is less than 0.5 meters, and six of them have less than two meter
error. On the other hand, Subjects 2, 3 and 4 have an error of more than 5
meters.
For results above 30 meters, the highest error is of 22% and below 30
meters, it is 14.8%. The average error is 9.3% that means an average error
in distance of near 2.7 meters.
Figure 15 shows the same results as Table 1 in a more visual way.
Steps Distance
Subject 1 74 28,24
Subject 2 82 35,30
Subject 3 88 36,76
Subject 4 76 30,18
Subject 5 64 25,56
Subject 6 86 35,32
Subject 7 74 28,88
Subject 8 66 26,64
Subject 9 76 30,42
Subject 10 72 28,44
Subject 11 74 31,76
Table 1: Results for the 30 meters walk, with the steps performed and the distance calculated for eleven people.
1 2 3 4 5 6 7 8 9 10 11
0 5 10 15 20 25 30 35 40
30 Meters Test
Test Subject
M
e
te
rs
The second experiment performed is a longer span of 60 meter under the
same circumstances than the previous. The same group of people walked
while holding their smartphone in their hands and sendt the results by email.
Table 2 and Figure 16 show the steps performed and the estimated distance
traveled for the group of eleven people that helped during the test. In this
case we find that two people have an error lower than 1 meter, while three of
them have it greater than 5 meters.
The average error for 60 meter walks is 6.1% (3.6 meters). The highest
errors above and below the real traveled distance are 11.1% and 8%
respectively.
Steps Distance
Subject 1 160 64,66
Subject 2 150 57,44
Subject 3 138 59,30
Subject 4 156 61,76
Subject 5 158 60,84
Subject 6 136 55,22
Subject 7 160 66,44
Subject 8 158 63,42
Subject 9 170 66,98
Subject 10 166 65,48
Subject 11 162 63,82
Table 2: Results for the 30 meters walk, with the steps performed and the distance calculated for eleven people.
0 10 20 30 40 50 60 70 80
60 Meters Test
Test Subject
M
e
te
rs
Figure 16: Results for the 30 meters walk, with the steps performed and the distance calculated for eleven people. The red line indicates the real distance traveled.
According to (Link, J.A.B. et al, 2011), PDR is estimation is subject to
cumulative error, so during long walks the accuracy will drop eventually. For
longer distances this error continues to grow and the system becomes too
inaccurate to be useful.
In the experiments performed in this project we obtained even lower error for
60 meter than for 30 meter long walks. It is possible to assume that the error
drop will become important for longer distances.
However, for helping the fingerprint-based Smart Campus project indoor
positioning system is helpful, since the area of interest for checking WI-FI
signals is reduced. The time between checks is going to be well below the
time a person needs to walk for 30 meters. The objective is to avoid calling to
the indoor localization service too many times and, when it is called, provide
5.3 Climbing stairs
Climbing and descending stairs is the third typical activity people do while
moving in indoor environments and buildings. Detecting this activity is even
more important than elevators, since in case of emergency it might be the
only way to move between floors.
As with step detecting, it is very easy to detect steps in this activity. Figure 17
and 18 show the acceleration pattern when descending and climbing stairs.
Applying algorithms similar to the ones that detect walking steps, it is easily
identify steps in stairs. It is harder to detect whether a user is climbing up
stairs or descending them, but thanks to the compass information from the
smartphone sensors we can discover this.
Figure 17: Diagram with the acceleration events while descending stairs (23 steps). The horizontal axis in the chart represent the number of events from the sensor and the vertical
axis the acceleration measured in the event in m/s2
.
Figure 18: Diagram with the acceleration events while climbing stairs (23 steps). The horizontal axis in the chart represent the number of events from the sensor and the vertical
axis the acceleration measured in the event in m/s2
.
In order to know if the user is ascending or descending stairs, the system has
to check the orientation of each of the steps performed while climbing or
descending the stairs. On the Figure 19 there is an example where we see
that when a person is descending stairs, he or she will turn left and orientate
to the South. However, when he or she is ascending them (Figure 20), the
turn will be to the North. We will use this in our advantage.
Of course, the building has to be mapped to know how are designed the
stairs in order to allow the system to detect the correct track of the user.
For experimenting with this ideas four tests have been designed. On the first,
the collaborators have climbed one floor of the stairs. On the second, they
have descended the same stairs. The third and the fourth tests they climb
Climbing Stairs
Figure 19: This two figures show how the user will turn when climbing stairs.
Descending Stairs
Figure 20: This two figures show how the user will turn when climbing stairs.
32
SOUTH
EAST
WEST
EAST
WEST
The selected stairs have 16 steps. As two of them bigger to allow the users to
turn direction, they will need between 18 and 20 movement steps to walk
from one floor to another. In the Table 3 we see that it is easy to know how
many floors a person has moved while walking.
1 Floor Up 1 Floor Down 3 Floors Up 3 Floors Down
Subject 1 18 20 61 68
Subject 2 20 19 61 63
Subject 3 18 20 60 57
Subject 4 18 18 61 63
Subject 5 17 21 58 68
Table 3: Number of step movements the collaborators performed during one floor (17 steps).
Checking the compass sensor in the smartphone, we can also know the
orientation of each of the steps performed. In the stairs used in this
experiment, the user will always face East at the start point both when
ascending and descending. When climbing he or she will have to turn South
and then West for continue climbing. However, when descending stairs this
turn will face him Norht and then West. This turn South or North will tell us if
he or she is climbing or descending.
Tables 4 and 4 show this orientation distinction on the experiments performed
for one floor for each of the tests executed by the five collaborators. They
Climbing one floor using stairs
Subject 1 Subject 2 Subject 3 Subject 4 Subject 5
Step 1 East East East East East
Step 2 East East Northeast East East
Step 3 East East Northeast East East
Step 4 Northeast East East East East
Step 5 East East Northeast Northeast East
Step 6 Northeast East East East East
Step 7 East East East Northeast East
Step 8 East Southeast Southeast Southeast Southeast
Step 9 Southeast South South Southeast South
Step 10 South South Southwest South Souhtwest
Step 11 West Southwest Southwest Southwest West
Step 12 West Southwest West West West
Step 13 West West West West West
Step 14 West Southwest West West West
Step 15 West West West West West
Step 16 West Southwest West West West
Step 17 West West West West West
Step 18 West West West West
Step 19 West
Step 20 West
Table 4: Orientation of each of the steps performed by all the collaborators while climbing stairs.
Descending one floor using stairs
Subject 1 Subject 2 Subject 3 Subject 4 Subject 5
Step 1 East East East East East
Step 2 Northeast East East East East
Step 3 Northeast East East East East
Step 4 Northeast East East East East
Step 5 Northeast East East East East
Step 6 Northeast Northeast Northeast Northeast East
Step 7 Northeast Northeast Northeast Northeast Northeast
Step 8 North North North North North
Step 9 Northwest Northwest Northwest Northwest North
Step 10 Northwest Northwest West Northwest North
Step 11 West West West West Northwest
Step 12 West West West Southwest West
Step 13 Southwest West West West West
Step 14 West West West Southwest West
Step 15 West West West West West
Step 16 West West Southwest West Southwest
Step 17 West West Southwest West Southwest
Step 18 West West Southwest West Southwest
Step 19 West South Southwest Southwest
Step 20 West Southwest Southwest
Step 21 Southwest
Figure 21: Orientation of each of the orientation events while descending (above) and climbing (below) in one of the tests.
In Figure 21 we see the how changed the orientation of one user while
descending and climbing one floor of the stairs.
The experiment for three floors in the same stairs was performed by the
same group of collaborators than for the one floor one. Each of them climbed
three of the floors of the building first and sent the information. Then,
descended the stairs and sent the information again.
In this second part of the experiment with stairs, the users have to turn two
more times between each of the floors, so there are a total of five turns for
climbing or descending three floors. We can see how the compass sensor of
the smartphone behaves on Figure 22 for the three floors.
Figure 22: Orientation of each of the orientation events while descending (above) and climbing (below) three floors in one of the tests.
Tables 6 and 7 show the steps and their orientation for one of the
Climbing three floors using stairs
First Floor Second Floor Third Floor
Step 1 East Step 18 East Step 36 East
Step 2 East Step 19 East Step 37 East
Step 3 East Step 20 East Step 38 East
Step 4 East Step 21 East Step 39 East
Step 5 East Step 22 East Step 40 East
Step 6 East Step 23 East Step 41 Southeast
Step 7 East Step 24 Southeast Step 42 South
Step 8 Southeast Step 25 South Step 43 Southwest
Step 9 South Step 26 South Step 44 West
Step 10 Southwest Step 27 West Step 45 West
Step 11 West Step 28 West Step 46 West
Step 12 West Step 29 West Step 47 West
Step 13 West Step 30 West Step 48 West
Step 14 Southwest Step 31 West Step 49 West
Step 15 West Step 32 West Step 50 West
Step 16 West Step 33 Norhwest Step 51 West
Step 17 Northwest Step 34 North Step 52 West
Step 35 Northeast Step 53 West
Step 54 West
Step 55 West
Step 56 West
Step 57 West
Step 58 West
Table 6: Orientation of each of the steps performed by one of the collaborators while climbing three floors.
Descending three floors using stairs
First Floor Second Floor Third Floor
Step 1 East Step 21 East Step 39 East
Step 2 East Step 22 East Step 40 East
Step 3 East Step 23 East Step 41 East
Step 4 East Step 24 East Step 42 East
Step 5 East Step 25 East Step 43 East
Step 6 East Step 26 Northeast Step 44 Northeast
Step 7 Northeast Step 27 North Step 45 North
Step 8 North Step 28 North Step 46 North
Step 9 North Step 29 Northwest Step 47 Northwest
Step 10 Northwest Step 30 West Step 48 Northwest
Step 11 West Step 31 West Step 49 West
Step 12 West Step 32 West Step 50 West
Step 13 West Step 33 West Step 51 West
Step 14 West Step 34 West Step 52 West
Step 15 West Step 35 West Step 53 West
Step 16 West Step 36 Southwest Step 54 West
Step 17 Southwest Step 37 South Step 55 West
Step 18 South Step 38 Southeast Step 56 Southwest
Step 19 South Step 57 Southwest
Step 20 Souhteast
5.4 Elevator patterns
Elevator patterns have also been analyzed. The acceleration events in this
case are not so easily noticeable, but they can be seen if we carefully check
the figure 23.
Figure 23: Accelerometer data showing the increment of the values when the elevator starts going up (left red square) and when it stops (right red square).
Even though it is possible to detect a pattern when using an elevator, in
during the investigations in this project it has not been possible to
unequivocally determine it.
6 CHAPTER 6: FUTURE WORK AND CONCLUSIONS
6.1 Conclusions
Measurements and results obtained in the previous chapter allow to come to
several conclusions. The test performed showed that on average the error
obtained in measurements are sometimes high (22% maximum error on a 30
meters walk), but on average it is below 10%.
In the Smart Campus and in the Perception project, the indoor positioning
fingerprint-based systems requires to constantly check for WLAN identifiers
in an area of interest for estimating the current position of a user (see Figure
24). By knowing the distance walked by he or she, this area of interest is
reduced and the number of comparisons is reduced. In addition, it is also
possible to reduce the frequency of checks, allowing battery savings on the
user's device.
Figure 24: This figure shows the areas of interest for checking for WLAN fingerprints in a corridor. The intersection between the blue area (orientation estimation) and the distance
The algorithms proposed in this Master's Thesis dissertation for counting
steps and estimating the distance traveled while walking might be included in
the INIT projects and in the Smart Campus in the near future.
6.2 Future Improvements
As it is explained in Chapter 5, the complete accomplishment of all the
objectives proposed initially in this project have not been fully implemented.
Further investigation is required to obtain the orientation of each of the steps
detected by the algorithms proposed in this research. This will help to reduce
the number of work load of the WLAN positioning checks and increase the
DR effectiveness.
Furthermore, the type of activity a user is performing during its route across
an indoor environment needs to be more reliable. The system must be robust
when a user uses an elevator or climbs and descends stairs. Tests evaluated
in this investigation suggest that it is possible to identify them, but it has not
been possible to implement the functionality in this project.
On the other hand, there are still several challenges not covered in this
project that scientists have not been able to resolve yet. For example, when a
navigation system can determine the moment someone or something passes
to be outdoors to be indoors. This trivial situation for the human mind is very
complex for a computer system to trait.
During the tests done in this project, it became evident that when walking
inside buildings of the university, to hold the smartphone to see the
indications of a navigation system and walk through other students that are
going and coming from all directions is not an easy task. The user must also
pay attention to pedestrian traffic can be confused or even collide with
something or someone else if too concentrated with the device. Inside
subway stations, airports or train stations paying attention to traffic becomes
very important. Voice indications is a possible solution. New devices like the
Google Glass (see Google Glass project in Android Developer Official web
BLIOGRAPHY
• CHANG N, RASHIDZADEH R, AHMADI M. 2010. Robust indoor
positioning using differential Wi-Fi access points. IEEE Transactions
on Consumer Electronics 56(3):1860-7.
• CHEN, G. AND KOTZ, D. (2000) A Survey of Context-Aware Mobile
Computing Research, Dartmouth Computer Science Technical Report
TR2000-381.
• CHIOU Y, WANG C, YEH S. 2010. An adaptive location estimator
using tracking algorithms for indoor WLANs. Wireless Networks
16(7):1987-2012.
• IBARRA BONILLA, M. N., ESCAMILLA-AMBROSIO, P. J., &
RAMÍREZ CORTÉS, J. M. (2011). Pedestrian dead reckoning towards
indoor location based applications. Paper presented at the CCE 2011
-2011 8th International Conference on Electrical Engineering,
Computing Science and Automatic Control, Program and
AbstractBook.
• JENNIFER R. KWAPISZ, GARY M. WEISS, AND SAMUEL A.
MOORE. 2011. Activity recognition using cell phone accelerometers.
SIGKDD Explor. Newsl. 12, 2 (March 2011), 74-82.
• KEVIN CURRAN, EOGHAN FUREY, TOM LUNNEY, JOSE SANTOS,
DEREK WOODS, AIDEN MCCAUGHEY, An evaluation of indoor
location determination technologies. Journal of Location Based
• KRAKIWSKY, E. J., HARRIS, C. B., & WONG, R. V. C. (1988).
Kalman filter for integrating dead reckoning, MAP matching and GPS
positioning. Paper presented at the Record - IEEE PLANS, Position
Location and Navigation Symposium, 39-46.
• LEI FANG; ANTSAKLIS, P.J.; MONTESTRUQUE, L.A.; MCMICKELL,
M.B.; LEMMON, M.; YASHAN SUN; HUI FANG; KOUTROULIS, I.;
HAENGGI, M.; MIN XIE; XIAOJUAN XIE, “Design of a wireless
assisted pedestrian dead reckoning system – the NavMote
experience”, Instrumentation and Measurement, IEEE Transactions
on, Volume 54, Issue 6, 2005. Dept. of Electr. Eng., Univ. of Notre
Dame, IN, USA, pp 2342-2358.
• LINK, J.A.B., SMITH, P, VIOL, N., WEHRLE, K, “FootPath: Accurate
map- ased indoor navigation using smarphones”, Indoor Positioning
and Indoor Navigation (IPIN), 2011 International Conference on,
ComSys, RWTH Aachen Univ., Aachen, Germany, pp 1-8. [Online].
Available: http://www.comsys.rwth-aachen.de/fileadmin/papers/2011/
2011-IPIN-bitsch- ootpath-long.pdf
• Official Android Developer Web Page, http://developer.android.com/
about/dashboards/index.html?Utm_source=ausdroid.net
• Official Android Developer Web Page, https://developers.google.com/
glass/
• QIAN WANG, XIANG CHEN, RUIZHI CHEN, YUWEI CHEN AND XU
ZHANG, “Electromyography-Based Locomotion Pattern Recognition
and Personal Positioning Toward Improved Context-Awareness
Applications”. Systems, Man, and Cybernetics: Systems, IEEE
Transactions on (Volume:43, Issue: 5), 2013. pp 1216 – 1227.
• SUNG D., “Augmented reality in action – travel and tourism”. Pocket
-Lint, 2011 [Online]. Available: http://www.pocket-lint.com/news/108891
-augmented-reality-travel-tourism-apps. Accessed on February 17th
2014.
• WANG, H., BAUER, G., KIRSCH, F., & VOSSIEK, M. (2013). “Hybrid
RFID system-based pedestrian localization: A case study”. Paper
presented at the 2013 10th Workshop on Positioning, Navigation and
APPENDIX I
This appendix contains the main methods of the IndoorNav application.
private void accelerationEvent(SensorEvent event) {
// I just care about ms
if (event.timestamp - lastAccTimeEvent > 1000000) {
float[] values = new float[3]; values[0] = event.values[0]; values[1] = event.values[1]; values[2] = event.values[2];
numAccEvents++;
writer.saveAccelerometerEventsInfo(values, event.timestamp);
accelerometerValuesList.add(values);
// check if we have an step
if (checkForStep()
&& (timeout < event.timestamp -
lastStepTimestamp)) {
detectedSteps++;
// calculate step distance
// distance += calculateStepLength(values);
List<Float> eventsList = new ArrayList<Float>(); for (int i = accelerometerValuesList.size() - 5; i < accelerometerValuesList
.size(); i++) {
eventsList.add(accelerometerValuesList.get(i)[2]); }
// distance += calculateStepLength(values);
distance += calculateStepLength(eventsList);
TextView data = (TextView) findViewById(R.id.WalkingSensorData);
data.setText("\n\n\nsteps: " + detectedSteps + "\nDistance: "
+ distance);
lastStepTimestamp = event.timestamp; }
// checks if a step is detected on the last 5 events
private boolean checkForStep() {
// Add value to values_history
int lookahead = 5;
// acceleration difference to get a step
double diff = -2;
int lastSample = accelerometerValuesList.size() - 1;
if (accelerometerValuesList.size() >= lookahead) { for (int i = 1; i < lookahead; i++) {
// just the z axis
if ((accelerometerValuesList.get(lastSample)[2] -
accelerometerValuesList
.get(lastSample - i)[2]) <= diff) { return true; } } } return false; }
// calculates step length
private double calculateStepLength(List<Float> eventsList) {
// referencia de la formula: Footpath
Double distance; double diff;
Float aMax = eventsList.get(0); Float aMin = eventsList.get(0);
// k is a personal constant. Depends on the person who is walking.
// I set this value to an average person (might work better with 0.55)
double k = 0.54;
// just checks the z axis
for (int i = 1; i < eventsList.size(); i++) { if (eventsList.get(i) > aMax) {
aMax = eventsList.get(i); }
if (eventsList.get(i) < aMin) { aMin = eventsList.get(i); }
}
diff = aMax - aMin; if ((diff) < 0) {
return -Math.pow(Math.abs(diff), (1 / 4)) * k; }
distance = Math.pow(diff, 1.0 / 4) * 0.55 * k; return distance;
}
private void compassEvent(SensorEvent event) { long milisecsTS = event.timestamp / 1000000;
// update compass data just *ten* per second
if (milisecsTS - lastStepTimestamp > 100) {
float[] values = event.values.clone();
compassEventsList.add(values);
compassTimestampList.add(event.timestamp);
TextView textOrientation = (TextView) findViewById(R.id.WalkingOrientation);
String compassInfo = "value: " + values[0] + ". ";
if ((values[0] >= 337.5 && values[0] <= 360)
|| (values[0] < 22.5 && values[0] >= 0)) { compassInfo += "NORTH";
} else if (values[0] >= 22.5 && values[0] < 67.5) { compassInfo += "NORTH EAST";
} else if (values[0] >= 67.5 && values[0] < 112.5) { compassInfo += "EAST";
} else if (values[0] >= 112.5 && values[0] < 158.5) { compassInfo += "SOUTH EAST";
} else if (values[0] >= 158.5 && values[0] < 202.5) { compassInfo += "SOUTH";
} else if (values[0] >= 202.5 && values[0] < 247.5) { compassInfo += "SOUTH WEST";
} else if (values[0] >= 247.5 && values[0] < 292.5) { compassInfo += "WEST";
} else if (values[0] >= 292.5 && values[0] < 337.5) { compassInfo += "NORTH WEST";
} else {
compassInfo += "ERROR"; }
textOrientation.setText("Orientation: " + compassInfo);
lastStepTimestamp = milisecsTS; }
APPENDIX II
Generated file with the smartphone manufacturer, model and sensor
presents XML data and the accelerometer raw data.
Just the first few sensor events are shown.
<PhoneInfo>
<PhoneModel>
ZTE V967S
</PhoneModel>
<PhoneSensors>
BMA050 3-axis Accelerometer
cm36283 Proximity Sensor
cm36283 Light Sensor
</PhoneSensors>
</PhoneInfo>
event #no, x-axis, y-axis, z-axis, timestamp
0, -0.919, 6.253, 7.46, 126049180026042
1, -0.957, 6.273, 6.799, 126049200026042
2, -0.804, 6.138, 6.311, 126049220026042
3, -0.067, 6.301, 6.569, 126049240026042
4, 0.392, 6.694, 6.569, 126049260026042
5, 0.498, 6.646, 6.991, 126049280026042
6, 0.22, 6.493, 7.709, 126049300026042
7, -0.038, 6.253, 7.824, 126049320026042
8, -0.22, 6.11, 7.613, 126049340026042
9, -0.114, 5.976, 7.403, 126049360026042
10, -0.009, 6.301, 7.441, 126049380026042
11, -0.028, 6.32, 7.623, 126049400026042
12, 0.009, 6.119, 8.159, 126049420026042
13, -0.028, 6.043, 8.571, 126049440026042
...