Effects of
Trypanosoma brucei
tryptophanyl-tRNA synthetases
silencing by RNA interference
Liliana Torcoroma García/*, Ney Ribeiro Leite, Juan D Alfonzo**,
Otavio Henrique Thiemann/*/
+Instituto de Física de São Carlos, Universidade de São Paulo, Caixa Postal 369, 13560-590 São Carlos, SP, Brasil *Departamento de Genética e Evolução, Universidade Federal de São Carlos, São Carlos, SP, Brasil **Department of Microbiology, Ohio State
Biochemistry Program and the Ohio State University RNA Group, The Ohio State University, Columbus, OH, US
The kinetoplast genetic code deviates from the universal code in that 90% of mitochondrial tryptophans are specified by UGA instead of UGG codons. A single nucleus-encoded tRNATrp(CCA) is used by both nuclear and mitochondria genes, since all kinetoplast tRNAs are imported into the mitochondria from the cytoplasm. To allow decoding of the mitochondrial UGA codons as tryptophan, the tRNATrp(CCA) anticodon is changed to UCA by an editing event. Two tryptophanyl tRNA synthetases (TrpRSs) have been identified in Trypanosoma brucei: TbTrpRS1 and TbTrpRS2 which localize to the cytoplasm and mitochondria respectively. We used induc-ible RNA interference (RNAi) to assess the role of TbTrpRSs. Our data validates previous observations of TrpRS as potential drug design targets and investigates the RNAi effect on the mitochondria of the parasite.
Key words: tryptophanyl tRNA synthetase - RNA interference - kinetoplastid - Trypanosoma brucei
Parasitic protozoa represent a considerable source of human diseases predominant in the tropical and sub-tropical regions of the globe. Of particular relevance are parasites belonging to the family Trypanosomatidae. Try-panosoma brucei and its subspecies are responsible for heavy socioeconomic losses in 36 sub-Saharan Africa countries (1.6 million DALYs) and lead to an estimated 48 thousand deaths per year. Therapy against African sleeping sickness has always been difficult, especially when the disease has reached an advanced stage with cen-tral nervous system involvement, as few effective drugs are available. For these reasons, the search and valida-tion of new pharmacological targets against trypanoso-miasis is of great concern.
Trypanosomatids are early diverging flagellates that differ from other eukaryotes in a number of features. They contain a remarkable single mitochondrion (the kinetoplast) harboring a large mass of circular DNA molecules concatenated in a unique arrangement, the kinetoplast DNA or kDNA (Lukes et al. 2002). The ki-netoplast genetic code, like many other mitochondrial genomes and to the exception of plants, deviates from the universal code in that 90% of tryptophans are speci-fied by UGA instead of UGG codons, although both codons are used in translation. A single nucleus-encoded tRNATrp(CCA) is used by both the nuclear and
mitochon-drial genes. Since all kinetoplast tRNAs are encoded in the nucleus and later imported into the mitochondria (Lima & Simpson 1996), a C to U deamination event at position 34 of tRNATrp(CCA) changes the anticodon from CCA to UCA allowing the decoding of UGA stop codons to Trp (Alfonzo et al. 1999).
The identification of two tryptophanyl tRNA syn-thetases (TrpRSs) proteins in T. brucei cells was reported (Charrière et al. 2006). TbTrpRS1 (cytoplasmic, acces-sion no. XM821841) and TbTrpRS2 (mitochondrial, ac-cession no. XM820510), where TbTrpRS2 is able of aminoacylate both the unedited tRNATrp(CCA) and the edited tRNATrp(UCA). We used inducible RNA interfer-ence (RNAi) in combination with biochemical techniques to assess the role of TbTrpRSs, thereby extending previ-ous observations (Charrière et al. 2006) and validating the TrpRSs as potential drug design targets.
MATERIALS AND METHODS
The nucleic acid and amino acid sequences of both genes, TbTrpRS1 and 2, were used to search the T. brucei
genomic databases, and the results showed no signifi-cant identity with other T. brucei genes as well as with their human and Escherichia coli homologues. A se-quence identity of 57% is shared between TbTrpRS1 and 2 distributed along the entire sequence. Due to the low sequence identity, we chose the full length ORF se-quences of TbTrpRS1 and 2 for RNAi analysis, based on the idea of increasing the specificity and efficiency of RNAi knockdown (LaCount et al. 2000). T. brucei 29-13 procyclic cells were grown in SDM-79 supplemented with 10% fetal bovine serum in the presence of hygromycin (50 µg/ml) and G418 (15 µg/ml) at 25-26°C without agitation (Wang et al. 2000). Each specific DNA for RNAi experiments was amplified by the polymerase chain reaction (PCR) from T. brucei 29-13 procyclic genomic DNA using the following gene-specific prim-ers, containing the XhoI and HindIII (underlined) restric-Financial support: CNPq (472570/2004-8), Fapesp (98/14138-2).
LTG is a Capes doctorate fellow. NRL is a Fapesp fellow (02/ 01883-9). JDA is supported by a grant from the American Heart Association.
+Corresponding author: thiemann@if.sc.usp.br
tions sites: TbTrpRs1a 5'-CGCCTCGAGATGAC-TGAAGCCGTTGTAACACCGTGGTCT-3', TbTrpRs1b 5 ' - T C A A G C T T T C A C T G G G T T G C C G C C T T-CTTCGCTGGAC-3', TbTrpRs2a 5'-TACTCGAGATG-CGCCGGGCTTCACATGTTTGCACGTC-3' and TbTrpRs2b 5'-CTAAGCTTCTATGCCATAATGTTG-CGCACCTCCGTAAA-3'.The PCRs were carried out in a PTC-100 thermocycler (MJ Research Inc.) with 0.2 units of Taq DNA polymerase (Biotools) according to the manufacturer conditions. The samples were subjected to 3 min denaturation at 94°C followed by 20 cycles of denaturation at 94°C for 0.5 min, annealing at 54°C for 0.5 min, and extension at 72°C for 1.5 min. A final step at 72°C for 10 min was added to maximize the full-length products. Each PCR fragment was cloned into the pCR2.1TOPO vector and sequenced prior to cloning into the XhoI/HindIII sites of the pZJM vector (Wirtz et al. 1999). These constructs were linearized by NotI cleav-age and transfected into procyclic T. brucei 29-13 cell line by electroporation as previously described (Wirtz et al. 1999, Wang et al. 2000). The transfected cells were cloned by the limiting dilution technique and selected under 2.5 µg/ml phleomycin until stable cell lines were obtained. To induce synthesis of the double stranded RNA (dsRNA), cells were incubated in medium contain-ing tetracycline (1.5 µg/ml) for 24 h and transferred daily to fresh medium with tetracycline. Growth curves were obtained using cells fixed with 4% (v/v) formaldhehyde in PBS and counted using a hemacytometer.
For cell morphology analysis, non-induced and tet-induced cultures were examined at different time inter-vals after RNAi induction by light microscopy. We used different staining techniques: (a) DAPI (4,6-diamidino-2-phenylindole, Sigma) for nuclear and kinetoplast DNA. Cells were washed in PBS, and then fixed and stained with DAPI (75 ng/ml) for 1 min and analyzed by fluo-rescence microscopy at 350 nm of λ excitation; (b)
Mitotracker: the mitochondrion of living trypanosomes was visualized with the potential sensitive vital stain MitoTracker Red CMXRos (λEm 579nm and λEx 599nm from molecular probe), a derivative of X-rosamine. Cells in log phase of growth were incubated with 100 nM Mitotracker Red CMXRos at 28oC for 5
min in SMGHP, then, the cells were washed with fresh media and finally, incubated without dye for 20 min; (c)
DAPI-RED: fluorescence images of cells stained with 60 µM DAPI and Mitotracker Red CMXRos 5 µM. For fixation, cells were washed with PBS and suspended in 4% freshly made paraformaldehyde in PBS. The percent-age of morphologic anomalies (number nucleus, kine-toplasts, and form) was determined in 150 cells.
To determine the percentage of TbTrpRSs mRNA in-hibition, total T. brucei RNA was isolated using Trizol (Life Technologies) after RNAi induction from the dif-ferent cell lines at difdif-ferent time points. The TbTrpRS1 and TbTrpRS2 mRNA were estimated by semi-quantita-tive RT-PCR (Kit One Step RT-PCR from Qiagen) and by quantitative real-time PCR (QPCR), using the spliced leader (SLRNA) primer 5'-AACTAACGCTATATA-AGTATCAGTTTCTGTACTTTATTG-3' (Campbell et al. 1984) and TbTrpRs1b and TbTrpRs2b primers. For the
semi-quantitavite RT-PCR experiments 100 ng of total RNA of each sample were added to a final reaction vol-ume of 50 µl. The samples, after RT-PCR were analyzed in a 2% agarose gel. The bands were quantitated using the Kodak ds 1D digital science V.3.0.1 software. The analysis was performed comparing the intensity of the ethidium bromide stained bands of control (non-induced) and RNAi induced samples. QPCR was performed using the Absolute QPCR SYBR Green Mix (Abgene Advanced Biotecnologies Ltd.) as previously described (Yin et al. 2001) and performed in a Rotor Gene Real Time PCR (Corbett Research, Uniscience). The QPCR data obtained was analyzed using paired t-tests on the linear 2-∆Ct data
set (Livak & Schmittgen 2001). The RT-PCR and QPCR experiments of TbTrpRSs were performed. As a quantitation standard the T. brucei glycosomal glyceral-dehydes 6-phosphate dehydrogenase (gGAPDH, X59955.1) gene was used with the primer pair TbGAPDHa 5'-CCTC GGGAATGAGATTGATGTCGT-TGCTGT-3' and TbGAPDHb 5'-CACATACTCCAC-ACCAAGCTTTCCC-3' in a standard PCR, as described above. Samples from induced, non-induced and non-trans-fected (control) cells were tested.
Oxygen uptake by T. brucei cells was measured with a biological oxygen monitor DM4 equipped (Digimed) with oxygen probe. The rate (ppm) was calculated by as-suming the oxygen content of air-saturated water is 0.276 mM at 28°C (according to manufacturer instructions). The cell concentration used was 1*10E6 cells/ml.
RESULTS
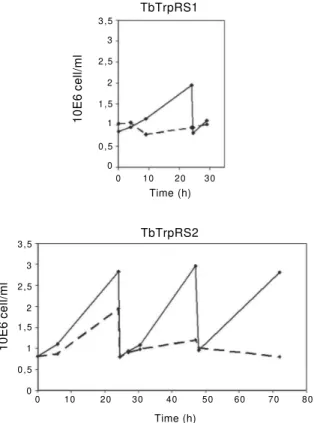
RNAi expression against TbTrpRS1 resulted in se-vere growth inhibition 4 h after induction (reduction of 84% relative to control cells) with cell death after 24 h of induction. TbTrpRS2 knockdown after 6 h of tetracy-cline induction produced a 79% growth inhibition and complete cell death after 72 h of induction. Both cell lines exhibited eventual complete arrest of growth, which was more quickly achieved in post-induced TbTrpRS1 cultures (24 h) than in TbTrpRS2 (72 h), as shown in Figs 1, 2. These cultures showed no recovery after release from tetracycline induction, confirming the lethal and irre-versible effect of the gene knockdowns (data not shown).
Expression of TbTrpRS1 dsRNA led to total degra-dation of the specific mRNA, which was undetectable by semi-quantitative RT-PCR. QPCR analysis revealed that transcript levels were reduced more than 16 fold in cells after 24 h of TbTrpRS1 dsRNA induction (Fig. 2). Expression of TbTrpRS2 dsRNA also resulted in an effi-cient degradation of the cognate mRNA resulting in an approximately 3-fold decrease after 48 h of induction and a complete silencing at 72 h of induction, after which TbTrpRS2 mRNA amounts were not detectable by either semi-quantitative RT-PCR or QPCR (levels < 13 folds) (Fig. 2). These data confirmed the efficiency of silenc-ing of expression of the TbTrpRSs by RNAi. Transcript levels were not significantly changed in the non-induced TbTrpRS2 controls or in the wild type T. brucei 29-13 cells (P = 0.62). An unrelated transcript for T. brucei
in-fluence the expression of the other (data not shown). The non-induced T. brucei cells transfected with the TbTrpRS1 RNAi construct exhibited a small reduction (0.039 folds; P = 0.06) of the TbTrpRS1 mRNA as com-pared to the non-transfected T. brucei 29-13 cells. This phenomenon can be explained by a leakage in the T7 dual-promoter system, which has been previously observed (Durand-Dubief et al. 2003).
TbTrpRS1
Time (h)
TbTrpRS2
3 , 5
3
2 , 5
2
1 , 5
1
0 , 5
0
0 10 20 30
0 10 20 30 40 50 60 70 80
3 , 5
3
2 , 5
2
1 , 5
1
0 , 5
0
Time (h)
10E6 cell/ml
10E6 cell/ml
TbTrpRS2 TbTrpRS1
2913 UI I-24h UI I-24h I-48h I-72h
GAPDH
Densitometry -1.0 N.D -1.8 -2.5 N.D
QPCR -0.014 >(16.0) -2.8 >(13.3) Fig. 1: growth of tetracyclin induced (dotted line) and non-induced (solid line) TbTrpRS1 and 2 RNAi strains of Trypanosoma brucei 29-13 cells.
Fig. 2: reverse-transcription-polymerase chain reaction (RT-PCR) and quantitative real-time PCR (QPCR) of Trypanosoma brucei citoplasmatic tryptophanyl tRNA synthetase (TbTrpRS1) and 2 mRNA. 2913: non-transfected cells. UI: TbTrpRS1 non-induced cells and I-24 h, I-48 h and I-72 h cells induced after 24, 48, and 72 h, respectively. GAPDH gene was used as a control and is shown for comparison. Quantification was per-formed by both, band densitometry (Densitometry lane) from semi-quanti-tative RT-PCR gel bands shown in the figure and by QPCR (data not shown).
A B
C
N
F
Fig. 3: phase contrast images from Trypanosoma brucei cells. A: non-induced TbTrpRS1 cells. Arrows indicate N: nucleus; F: flagella; B: TbTrpRS1 cells 24 h after tetracycline induction. Arrows indicate cell with several detached flagella; C: TbTrpRS2 cells 48 h after RNAi induction.
To analyze the cell morphology, non-induced and tet-racycline induced cultures were examined. The pheno-type of the control (non-induced) cells appeared normal (Figs 3A, 4A). The distribution of cell morphologies of induced and non-induced knockdowns is presented in the Table. The cells were classified in two categories ac-cording to the number of kinetoplasts (K) and nuclei (N) per cell. “Normal” constituted cells with 1K1N or with 2K1N/2K2N, representing different stages of cell divi-sion. Cells were classified as “abnormal” when contain-ing a different number of K or N. TbTrpRS1 knockdown cells also presented a round phenotype and were classi-fied as ‘spheres’. In the control cultures, the population mainly (90-94%) constituted of 1K1N cells and a mi-nority of dividing cells (2K1N or 2K2N) as shown in Fig. 4A and in the Table.
We used the mitochondria-specific stain, Mitotracker (molecular probes), in order to assay functional changes occurring during TbTrpRS2 RNAi induction. A typical reticular pattern is visible throughout the non-induced cells, representing the stained mitochondria, and this
PC DAPI-UV DAPI-RED Mitotracker
A
B
C
D
E
Fig. 4: cell morphology, kinetoplast, and nuclear DNA of Trypanosoma brucei mitochondrial tryptophanyl tRNA synthetase (TbTrpRS2) strain after different periods of incubation with tetracycline. PC: phase contrast images. DAPI-UV: DAPI stained viewed using both, visible and UV lights. DAPI-RED: fluorescence images of cells stained with Mitotracker Red CMXRos and DAPI stained observed in the DAPI channel; Mitotracker: fluorescence images of cells stained with the potential sensitive vital stain Mitotracker Red CMXRos in live cells; A: non-induced TbTrpRS2; B: 24 h after RNAi induction; C: 48 h after RNAi induction; D: example of Zooid morphology that appeared after 48 h of RNAi induction; E: 72 h after RNAi induction.
TABLE
Cell morphology of Trypanosoma brucei cells after RNAi induction
Normal Abnormal
1K1N 2K1N 2K2N 1K0N 2K0N 0K2N 1K2N 0K0N 1K3N Sphere
Cells % % % % % % % % % %
T.b. 29-13 control 83 11 3 3
TbTrpRS1
Non-induced 79 11 3 3 2 2
Induced 24 h 9 2 3 3 3 3 3 41 33
TbTrpRS2
Non-induced 78 12 2 4 2 2
Induced 24 h 51 13 5 9 5 6 2 8 1
Induced 48 h 48 8 6 16 4 2 6 8 2
Induced 72 h 21 4 19 43 4 4 2 1 2
K: kinetoplast; N: nucleus; T.b. 29-13 control: wild type T. brucei 29-13 cells; TbTrpRS1: TbTrpRS1 transfected T. brucei 29-13 cells; TbTrpRS2: TbTrpRS2 transfected T. brucei 29-13 cells.
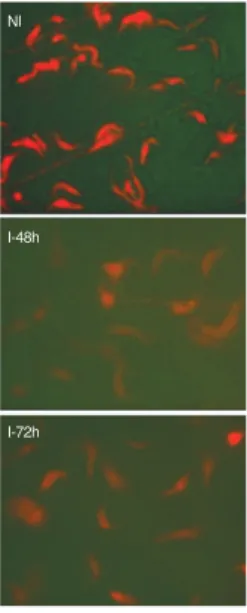
patter is significantly altered after TbTrpRS2 RNAi in-duction. Induced cells show a decrease in the mitochon-dria stain, in particular after 48 h of induction (Fig. 4C), indicating dramatic changes of metabolic function. To corroborate these results, the respiration rate or demand of oxygen (DO) was determined using a biological oxy-gen monitor DM4 (Digimed). The uninduced cells ex-hibit non-significant changes in their respiration rate compared with the control (P = 0.789). The respiration rate (ppm) was significantly decreased (64%) at 48 h post-induction (Fig. 5). This result is consistent with the three-fold decrease in TbTrpRS2 mRNA (Fig. 2). After 72 h the DO from these cells was undetectable. The quan-titative mRNA analysis from TbTrpRS2 RNAi induced samples suggested that the decrease in the DO and the reduction of the mitochondrial potential occurred after the mRNA depletion (Figs 5, 6). According to these re-sults, we can conclude that slight perturbations in the expression of TbTrpRS2 can trigger significant and im-mediate alterations in the mitochondrial function and redox potential. In addition, at 72 h post-induction, the complete degradation of specific mRNA in the knock-down cells was compatible with the complete lost of respiration activity and mitochondrial membrane poten-tial (Figs 5, 6). Furthermore, the inhibition of TbTrpRS2 synthesis could decrease the levels of mitochondrial translation, with a decline of mitochondrial redox po-tential, respiration capability and finally triggering cell death. The TbTrpRS1 RNAi induced deleterious phenotype (Figs 1, 2) prevented an investigation of its role in mito-chondria function, although such a role seems improbable.
DISCUSSION
Fig. 5: assessment of respiratory function, oxygen demand (DO) of Try-panosoma brucei mitochondrial tryptophanyl tRNA synthetase (TbTrpRS2). C: T. brucei 29-13 control cells; UI: non-induced TbTrpRS2; I-24 h and I-48 h: TbTrpRS2 24 h and 48 h after induction respectively. At 72 h DO was non-detectable in this assay.
100
80
60
40
20
0
C UI I-24h I-48h
Time (600s)
DO (%)
NI
I-48h
I-72h
constructs. This contributed to a more pronounced se-quence-specific knockdown, leading in a clearer physi-ological effect. Our results show that the outcome of RNA interference on TbTrpRS2 is a rapid decrease of mitochondrial activity, leading to a rapid cell death. The rapid rate which mutant phenotypes develop after ex-pressing TbTrpRSs dsRNA indicate that these proteins have short half-lives since those enzymes are not abun-dant in the cells (data not shown). Our results confirm the central role that TbTrpRS1 and 2 play in cell viabil-ity, validating these proteins as targets for inhibitor de-velopment. In particular TbTrpRS2 is of interest due to its low sequence identity to other TbTrpRSs genes, es-pecially that of humans, and for its role in blocking mi-tochondrial activity and resulting in cell death.
ACKNOWLEDGEMENTS
To the members of the Protein Crystallography and Struc-tural Biology Group (IFSC-USP) for the helpful discussions in the course of this work. To Prof. Dr David Campbell Laboratory for providing pZJM vector and T. brucei 29-13 procyclic cells (Microbiology Immunology Molecular Genetics, University of California), Prof. Dr Heloisa Selistre de Araujo (LBBM, Federal University of São Carlos) for the QPCR support and Prof. Dr Luiz Antonio Daniel (São Carlos Engineering School, University of São Paulo) for support in the DO measurements.
REFERENCES
Alfonzo JD, Blanc V, Estevez AM, Rubio MA, Simpson L 1999. C to U editing of the anticodon of imported mitochondrial tRNATrp allows decoding of the UGA stop codon in Leish-mania tarentolae. EMBO J 18: 7056-7062.
Campbell DA, Thornton DA, Boothroyd JC 1984. Apparent
discon-tinuous transcription of Trypanosoma brucei variant surface antigen genes. Nature 311: 350–355.
Charrière F, Helgadottir S, Horn, EK, Söll D, Schneider A 2006. Dual targeting of a single tRNATrp requires two different tryptophanyl-tRNA synthetases in Trypanosoma brucei. PNAS 103: 6847-6852.
Durand-Dubief M, Kohl L, Bastin P 2003. Effieciency and speci-ficity of RNA interference generated by intra- and intermo-lecular double stranded RNA in Trypanosoma brucei. Mol Bioch Parasitol 129: 11-21.
Kim S, Lee SW, Choi EC, Choi SY 2003. Aminoacyl-tRNA syn-thetases and their inhibitors as a novel family of antibiotics. Appl Microbiol Biotechnol 61: 278-288.
LaCount DJ, Bruse S, Hill KL, Donelson JE 2000. Double-stranded RNA interference in Trypanosoma brucei using head-to-head promoters. Mol Bioch Parasitol 111: 67-76.
Lima BD, Simpson L 1996. Sequence-dependent in vivo impor-tation of tRNA into the mitochondrion of Leishmania tarentolae. RNA 2: 429-440.
Livak KJ, Schmittgen TD 2001. Analysis of relative gene ex-pression data using real-time quantitative PCR and the 2-Delta 2-Delta CT Method. Methods 25: 402-408.
Lukes J, Guilbride DL, Votýpka J, Zíková A, Benne R, Englund PT 2002. Kinetoplast DNA network: evolution of an improb-able structure. Eukaryotic Cell 1: 495-502.
Ploubidou A, Robinson DR, Docherty RC, Ogbadoyi EO, Gull K 1999. Evidence for novel cell cycle checkpoints in trypano-somes: kinetoplast segregation and cytokinesis in the absence of mitosis. J Cell Sci 112: 4641-4650.
Wang Z, Morris JC, Drew ME, Englund PT 2000. Interference of Trypanosoma brucei gene expression by RNA interfer-Fig. 6: fluorescence images of cells stained with Mitotracker Red CMXRos showing the accumulation of the redox potential sensitive dye by procyclic
ence using integratable vector with opposing T7 promoters. J Biol Chem 275: 40174-9.
Wirtz E, Leal S, Ochatt C, Cross GA 1999. A tightly regulated inducible expression system for conditional gene knockouts and dominant-negative genetics in Trypanosoma brucei. Mol Biochem Parasitol 99: 89-101.