Artigo
*e-mail: [email protected]
DEVELOPMENT OF A SECOND TYPE ELECTRODE BASED ON THE SILVER/SILVER IBUPROFENATE PAIR FOR IBUPROFEN QUANTIFICATION IN PHARMACEUTICAL SAMPLES
Selene I. Rivera-Hernándeza, Giaan A. Álvarez-Romeroa,*,Silvia Corona-Avendañob, M. Elena Páez-Hernándeza, Carlos
A. Galán-Vidala, Mario Romero-Romob and María Teresa Ramírez-Silvac
aÁrea Académica de Química, Universidad Autónoma del Estado de Hidalgo, Mineral de la Reforma, México bÁrea Ingeniería de Materiales, Universidad Autónoma Metropolitana-Azcapotzalco, Ciudad de México, México cDepartamento de Quimica, Universidad Autónoma Metropolitana-Iztapalapa, Ciudad de México, México
Recebido em 18/06/2016; aceito em 20/07/2016; publicado na web em 02/09/2016
Ibuprofen is a widely used pharmaceutical because of its therapeutic properties; it is considered a safe medicament, thus it does not require medical prescription to be sold. However, in order to ensure consumer’s health it is indispensable that the pharmaceutical industry relies on analytic methods for its quantiication. Potentiometry has proven to be a successful technique using second type electrodes, which in agreement with Nernst’s equation can detect anions activity. On consideration of this, this research work presents the development of a second type electrode based on the silver/silver ibuprofenate pair. This involved modifying a pure silver wire using a sodium ibuprofenate solution, to obtain the redox pair. The following analytic parameters were obtained with the aid of the modiied electrode: a sensitivity of -0.049 V decade [ibuprofenate]−1, 8 µmol L-1 for the detection limit and a quantiication limit of
1.2 µmol L-1. The repeatability value in terms of the relative standard deviation was 5.9%. After performing an interferences analysis using some ions and excipients, it was corroborated that there were none, thus allowing appropriate quantiication on a real sample. Keywords: ibuprofen, second type electrode, silver ibuprofenate.
INTRODUCTION
Non-steroidal anti-inlammatory drugs (NSAID’s) belong to a group of medicaments widely used due to their usable combination of therapeutic properties, since they are used as analgesics, antipyretics, anti-inlammatories and anti-thrombotics. Although their chemical structures are different, their therapeutic properties are very similar.1 Because of their action mechanism, namely inhibiting the synthesis of prostaglandins, they are helpful during pain treatment.2 Ibuprofen is found among the NSAID’s as a prepared pharmaceutical, it is sold as a racemic mixture of the isomers (S)-(+) (dextro) and (R)-(-) (levo); however, it is the isomer (S)-(+) that shows the properties mentioned above. Is commercially available in presentations of 200, 400 and 800 mg, as a tablets, gel or as suspension; it is important to consider that since 1984 ibuprofen is considered a safe pharmaceutical so its sale does not require medical prescription.3
Ibuprofen (acid α-methyl-4-(isobutyl)-phenylacetic) belongs to
the family of 2-aril-propionc acid. Ibuprofen is a white crystalline powder, although it is sometimes found as colorless crystals with a wax consistency; it is partially insoluble in water but easily dissolved in acetone, methanol and methylene chloride, and partially soluble in dilute hydroxide and carbonate solutions;4 it displays a signiicant consumption index as it happens to be the third most popular medicament in the world, with a large production reported in kilotons (estimated in 15000 ton each year).5 As safe medicament, it can be degraded by the human body into its principal metabolites, namely: hydroxyibuprofen, carboxyibuprofen and carboxy-hydratropic acid that are excreted through urine.6 However, in spite that it does not represent risks for the consumer health, it is necessary that the pharmaceutical industry accomplishes strict quality control and manufacturing policies to ensure that dosage is complied with, in agreement with national standards of each country. Such methodologies are compiled in the national pharmacopoeias for
each country: the method reported to determine ibuprofen in the British pharmacopoeia is based on an acid-base titration in non-aqueous media, that is carried out in methanol and sodium hydroxide, observing the color change through using phenolphthalein as indicator; for the pure compound this is useful, although when using color pills interferences may occur.7 Further, the US pharmacopoeia, USP, uses HPLC with a UV detector and a wavelength of 214 nm,8 this as expected increases the overall analysis costs and the samples require a pre-treatment (where ibuprofen is dissolved in acetonitrile) to ensure accuracy and precision. Given the diverse disadvantages associated to the techniques compiled in the national pharmacopoeias, the literature now has many reports on diverse methods to facilitate the ibuprofen determination. Amidst some of the outstanding techniques, there are reports on: capillary electrophoresis,9 spectroluorometry,10 spectrophotometry,11,12 chemioluminiscence;13 however, recently the use of electrochemical techniques has been proposed, as voltammetry, where boron-doped diamond electrodes have been used in order to study and evaluate the different ibuprofen redox processes.14,15 The ibuprofen electroactivity can be proited from, thereby forming a radical cation followed by decarboxylation.14 However, potentiometry has been the most explored technique for quantifying ibuprofen, due to its good sensitivity, high selectivity, better precision and accuracy, electrodes capable of being miniaturized, easily built, low cost and no destruction of the sample;15,16 although, just a few potentiometric sensors have been reported for the determination and quantiication of ibuprofen. Sensors based in membranes containing ion-exchangers,17 cyclodextrins,18 ion pair complexes,19 and ionophores20 have been reported for the quantiication of ibuprofen with good results, although, the construction of the selective membranes is complicated, expensive, and sometimes responses are attained after prolonged times.
characteristics, Santini et al., proposed a simple second type electrode for ibuprofen analysis, based on the Hg/HgIbu pair with very good results.22 In spite of this, the use of Hg has been discontinued due to its environmental risks. In this research, we present the development of a new second type electrode proposal, based on the pair silver / silver ibuprofenate, (Ag/AgIbu), which in agreement with the Nernst equation, allows quantiication of ibuprofenate ions.
EXPERIMENTAL
Reagents
The following reagents were used to prepare all working solutions: sodium nitrate (Sigma-Aldrich, 99.0%), sodium ibuprofen salt (Sigma-Aldrich), Ibuprofen (Sigma-Aldrich, 99.0%), sodium hydroxide (Sigma-Aldrich, 98%), nitric acid (Sigma-Aldrich, 70%), monobasic sodium phosphate (Sigma-Aldrich 99.0%), dibasic sodium phosphate (Sigma-Aldrich), sodium sulphate (Sigma-Aldrich 99.0%), sodium benzoate (Fluka, 99.0%), ammonium oxalate (J.T. Baker, 99.6%), sodium acetate (Baker Analyzed, 99.6%), sodium chloride (J. T. Baker, 99.0%), glycine (Sigma-Aldrich, 98.5%), manitol (Sigma-Aldrich, 99.6%), glucose (Sigma-Aldrich,99.5%), sodium bicarbonate Aldrich, 99.5%), sodium carbonate (Sigma-Aldrich, 99.5%). All solutions were prepared using deionized water (18.2 MΩ cm) from a Mili-Q equipment. Prior to all electrochemical experiments, all solutions were bubbled with nitrogen at 1 minute per mL solution, to displace the oxygen dissolved. In this same sense, is relevant to state that all experiments were carried out with solutions freshly prepared prior to each experiment, and when the indicator electrode was not being used, it was stored in a 1x10⁻³ mol L-1 sodium
ibuprofenate solution. Apparatus
The electrochemical experiments were carried out using an EPSILON-BASi potentiostat-galvanostat, aided by a typical set up of three electrodes, where the working electrode was a high purity (99.99% +) silver wire, a graphite bar served as counter electrode(Sigma-Aldrich, OD = 3mm and 150 mm long, 99.99%) and a double junction Ag/AgCl (sat. KCl BASi) reference electrode, itted with a BASi Luggin capillary. For the potentiometric experiments, all potentials are referred to a double junction Ag/AgCl, (sat. KCl Orion 900200) and the measurements were carried out using a Metler Toledo Seven Multipotentiometer.
Electrochemical characterization
In order to establish the electrochemical activity of the ibuprofen molecule, cyclic voltammetry (CV) in the anodic direction was performed in a 0.1 mol L-1 NaNO
3 solution with 1x10⁻³ mol L-1 of sodium ibuprofenate. CV parameters are: 0.1 V s-1 for the potential scan rate and a potential window of -1.3 to 1.3 V vs Ag/AgCl (sat. KCl) using graphite as working electrode. Another CV was performed using a silver electrode in a 0.1 mol l-1 solution of NaNO
3 with 1x10⁻³ mol L-1 of sodium ibuprofenate using the same technique parameters. Silver/SilverIbuprofenate (Ag/AgIbu) modification
Preliminary experiments showed the formation of insoluble silver ibuprofenate when mixing sodium ibuprofenate with AgNO3 in solution. Therefore, in order to modify the silver electrode with AgIbu to achieve the redox pair Ag/AgIbu, CV, chronopotentiometry and chronamperometry were proposed. Chronamperometry resulted
to be the best technique for the electrode modiication since all the silver surface was covered.
Optimization of the electrode’s modification
Point optimization was used to optimize the potential and the application time of the chonamperometric technique, with the sensitivity being the optimized parameter. The sensitivity is obtained through the construction of different analytical curves. Considering that a potentiometric electrode should follow the Nernstian behavior, the sensitivity (given through the slope of the analytical curve) must be near 0.059 V (activity decade) −1.
Sensitivity, detection limit and linear range
The solutions used to build the analytical curve exhibited activities (estimated by means of the simpliied Debye-Hückel equation) in the 10−4 to 10−3 mol L-1 concentration range. The activities of
various sodium ibuprofenate solutions were linearly itted using the measured experimental potentials and the least squares method. The slope recorded represents the sensitivity of the electrode, it is expected a value of 0.059 V decadeibuprofenate−1 (which corresponds to the Nernst value), while the detection limit is to be estimated along with the linear range, using graphical methods, one of which consists in identifying the intersection between the best straight line found through least squares during calibration of the system and a slope to the linear part of the superior curve and a slope to the lower linear part, parallel to the axis.23
Repeatability
Repeatability is the response variation when successive measurements are made with the same electrode under identical concentration. In this case, this parameter was evaluated measuring the potential of 30 consecutive measurements in an 8.98 mmol L-1 sodium ibuprofenate solution and estimating the percent of relative standard deviation.
Influence of pH
Since the electrode responds to the ibuprofen ionized form, pH of working solution value must be greater than the pKa value, which is 4.4 in agreement with that reported by the Food and Drug Administration (FDA);24 hence, the range studied included the range from 5.0 to 9.0, where the ibuprofenate ion predominates in the system. The pH was varied using concentrated HNO3 or NaOH. Stabilization time, response time and drift
In order to determine the time elapsed for the electrode to become stable, it was submerged in a 0.1 mol L-1 NaNO
3 solution (used as supporting electrolyte) and then time was monitored until a constant potential was achieved; once the reading variation showed no modiications, sodium ibuprofenate solution was added in order to reach an activity of 0.12 mmol L-1 (corresponding to the lowest activity of the linear concentration range), then the time taken for the electrode to become stable was recorded. After, the highest concentration 8.98 mmol L-1 was added, subsequently the procedure was then repeated.
This parameter can be known if the proposed electrode requires constant calibration when used after prolonged experimental times. Interferent analysis
This was carried out using the Fixed Match Potential Method recommended by IUPAC.25 The potentiometric selectivity coeficient, KA,Bpot, was estimated as follows: a given quantity of the primary ion, aA’, was added to a standard solution containing a constant activity, aA,
of primary ions and the potential difference, ∆E, was then recorded. Thereafter, the interfering ion was added to the reference solution until reaching the potential change recorded previously upon addition of the primary ion. The value of KA,Bpot was estimated through the following equation.
(1) The ions probed in this case were those commonly found in potable and residual waters and in excipients of pharmaceutical samples; such ions were chosen with reference to those most reported in the literature for potentiometric sensors.
Analysis of real samples
Solid pharmaceutical samples are prepared as follows: 200 mg of commercial tablets were pulverized and dissolved in a 0.1 mol L-1 phosphates buffer pH 7. In order to separate the insoluble part of the sample, this was iltered and the solution was gauged to a volume of 50 mL. An aliquot of 10 mL is taken to carry out the quantitative measurements from which an aliquot was diluted using the phosphate buffer solution. In the case of liquid samples, 145 microliters were measured and gauged to 10 mL using a 0.1 mol L-1 phosphates buffer pH 7. The acid-base titration methodology was used to statistically compare the results obtained with the potentiometric methodology, as it is recommended by the European Pharmacopeia.
The measurements were effected using the method of standard addition, where for the potentiometry case is given as:
(2)
where Cp= Ibuprofen concentration in the sample (mol L-1); Cs= Ibuprofen concentration in the standard (mol L-1); s= Sensitivity of the ion selective electrode (mV decadeibuprofenate-1); Vp= Sample Volume (L); Vs= Volume of the standard added (L); Ep= Potential measured in the sample (mV); Eps= Potential measured in the solution enriched (mV). The concentration of the ibuprofenate standard was 100 mmol L-1, while that of ibuprofen in the sample was 2.54 mmol L-1.
After recording the measurements, a Student t statistic test was performed to corroborate whether there were a meaningful difference among the ibuprofen mass, mg, reported in the sample label and that found when using the silver / silver ibuprofenate second type electrode.
RESULTS AND DISCUSSION
Electrochemical profile of the system silver / silver ibuprofenate
The cyclic voltammogram for a sodium ibuprofenate solution
is shown in Figure 1. It can be observed that there were neither oxidation nor reduction peaks associated to the ibuprofen molecule, which suggests that ibuprofen does not oxidizes under the proposed conditions, making this an ideal setting to carry out the modiication of the silver electrode.
Further, when substituting the graphite electrode with the silver wire, cyclic voltammetry under the same conditions (Figure 2) shows a different proile, namely, an oxidation peak (I) appeared which is associated to formation of the Ag+ ion at 0.57 V, although when the scan was reverted, the reduction to Ag0 peak (II) becomes apparent at −0.22 V.
The studies demonstrate that when the Ag0 oxidation occurs to Ag+,the electrode is undergoing a changing process, because the electrodeposition of a white precipitate is taking place corresponding to formation of silver ibuprofenate.
Optimization of the second type electrode Ag /AgIbu
In order to modify the silver electrode to obtain the redox pair, namely Ag /AgIbu, chronoamperommetry was done imposing a potential in the 0.60 to 1 V range, then the analytical curves were built, from which the values of the slope were obtained along with their standard deviation and correlation coeficient. The results are shown in Table 1, from which it can be preliminary concluded that the optimum potential is 0.8 V, because it is the slope value closest to the Nernstian. The subnernstian value obtained may indicate that there are other complex chemical processes involved in the overall chemical equilibria that governs the electrode’s response.
The time optimization during which the potential was imposed was carried out modifying the electrode at 0.8 V during different periods, which were chosen within the 5 to 30 s range, as can be observed in Table 2, the optimum slope was obtained at 30 s.
Figure 2. Cyclic voltammogram recorded in the 1x10⁻³ mol L-1 sodium
ibu-profenate solution in 0.1 mol L-1 NaNO
3 as supporting electrolyte with the
Ag electrode. Potential window −1.3 to 1.3 V vs Ag /AgCl (sat. KCl) at 0.1 V
s−1 potential scan rate. Peak I) oxidation of the Ag0, peak II) reduction of Ag+
Figure 1. Cyclic voltammogram of 1x10⁻³ mol L-1 sodium ibuprofenate in 0.1
mol L-1 NaNO
The second type electrode responds to the following equilibrium:
where
(3)
In the equation, it can be perceived why the electrodes of the second type are capable of sensing the anions; however, it is necessary to remember that the Nikolsky-Eisenman equation24 is the most correct one when considering the interference effect.
where:
(4)
E= Potential difference of the ISE’s galvanic cell, experimentally determined when the sole variables are the solution activities. R= Ideal gases constant (8.3144 J K−1 mol−1)
T= Temperature (K)
F= Faraday constant (9.6485x10⁴ C mol−1)
aA= Activity of ion A
aB and ac= Activities of the interfering ions B and C, respectively KA,Bpot= Potentiometric selectivity coeficient for ion B with respect to ion A
ZA= Charge number, corresponding to the charge of the principal ion. ZB and Zc= Charge number of the ions B and C, respectively.
After optimizing the potential and its application period, the analytical curve was built (Figure 3), from which analytic parameters can be obtained. These are shown in Table 3, from where it can be
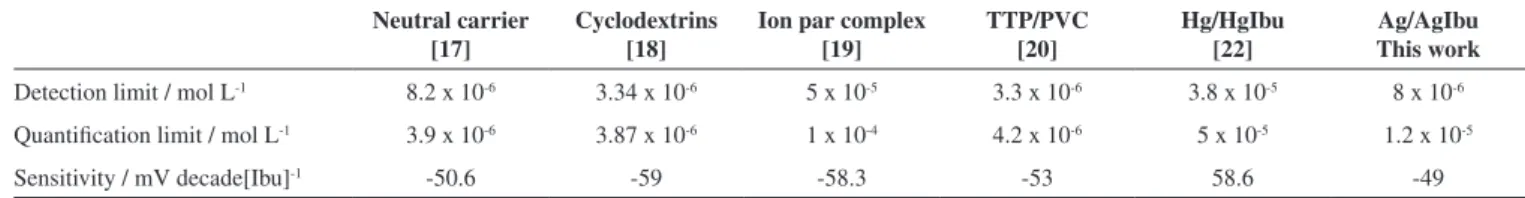
observed that the obtained values are very competitive with others reported in literature for ibuprofen sensors. Although, the sensitivity obtained with this strategy is lower than 0.059 V decadeibuprofenate
−1,
which corresponds to a subNernstian behaviour.
It is important to underline that the Ag/AgIbu electrode compared with the others presented in Table 3, is simpler to construct since the actual modiication of the silver wire takes only 30 s, while the construction of the other potentiometric sensors involves various steps, some of them time consuming.16-19 Compared with other second type potentiometric electrodes, the Ag/AgIbu electrode does not comprise toxic substances like mercury.22
Repeatability study
After taking 30 recordings, an average value was obtained of 0.246 V, with a relative standard deviation of 5.98%. This value indicates that the electrode turns out to be useful to carry out at least 30 consecutive measurements, due to the value of the relative standard deviation which does not surpass 6%.
pH study
This study was carried out at different pHs, namely: 5, 6, 7, 8 and 9, where the ionized form of ibuprofen predominates (pKa 4.4); thus when plotting the potential as a function of pH, slight changes can be observed in the potential, particularly between 5 and 7 (Figure 4). However, in the prepared pharmaceuticals it was found in its acid form, therefore it was necessary to buffer the system to a pH value to allow the ibuprofen to be in its ionized form; this buffering was carried out with the 0.1 mol L-1 phosphate buffer to obtain a value of pH 7. Study of the stabilization time, response and drift
The time elapsed for the electrode to become stable in the supporting electrolyte was 186 s, for the lowest activity (0.12 mmol L-1) the response time was 246 s whereas for the largest, the time taken for the electrode to respond was 198 s.
Table 1. Slope values, standard deviation and correlation coeficient at different potentials
Potential (V) (V decadeSlope −1
Ibuprofenate)
Standard
Deviation R2
0.60 -0.015 0.008 0.9966
0.70 -0.033 0.009 0.9193
0.80 -0.036 0.008 0.9465
0.90 -0.018 0.002 0.9791
1.0 -0.028 0.003 0.9873
Table 2. Slope values, typical error and correlation coeficient at different times
Time (s) (V decadeSlope −1 Ibuprofenate)
Standard
Deviation R2
5 -0.035 0.005 0.9775
10 -0.036 0.005 0.9997
15 -0.035 0.009 0.9277
30 -0.049 0.002 0.9976
Table 3. Comparison of the analytical parameters obtained in this work and those reported in literature for ibuprofen potentiometric sensors
Neutral carrier
[17] Cyclodextrins [18] Ion par complex [19] TTP/PVC [20] Hg/HgIbu [22] This workAg/AgIbu
Detection limit / mol L-1 8.2 x 10⁻⁶ 3.34 x 10⁻⁶ 5 x 10⁻⁵ 3.3 x 10⁻⁶ 3.8 x 10⁻⁵ 8 x 10⁻⁶ Quantiication limit / mol L-1 3.9 x 10⁻⁶ 3.87 x 10⁻⁶ 1 x 10⁻⁴ 4.2 x 10⁻⁶ 5 x 10⁻⁵ 1.2 x 10⁻⁵
Sensitivity / mV decade[Ibu]-1 -50.6 -59 -58.3 -53 58.6 -49
Figure 5 shows the potential changes as a function of time; from the plot it can be observed that the times taken for the Ag/AgIbu electrode to become stable and to respond are relatively short, thus suggesting that the electrode responds fast, thereby allowing the analyses to be performed within short periods.
On considering the drift, this was measured acquiring a set of not random data at a constant concentration, and carrying out a linear it, that gave a value of 0.0001 V s−1. Considering this value, constant
analytical plots must be constructed during long time experiments, so the drift error can be neglected.
Interferents analyses
For this purpose, different ions used were commonly found in water and in some excipients used in prepared pharmaceuticals. Table 4 shows the values of KA,Bpot obtained through the Fixed Matched Potential Method. From the results obtained it can be said that the second type electrode displayed greater afinity toward the ibuprofenate ion than to the ions chosen as interfering agents.
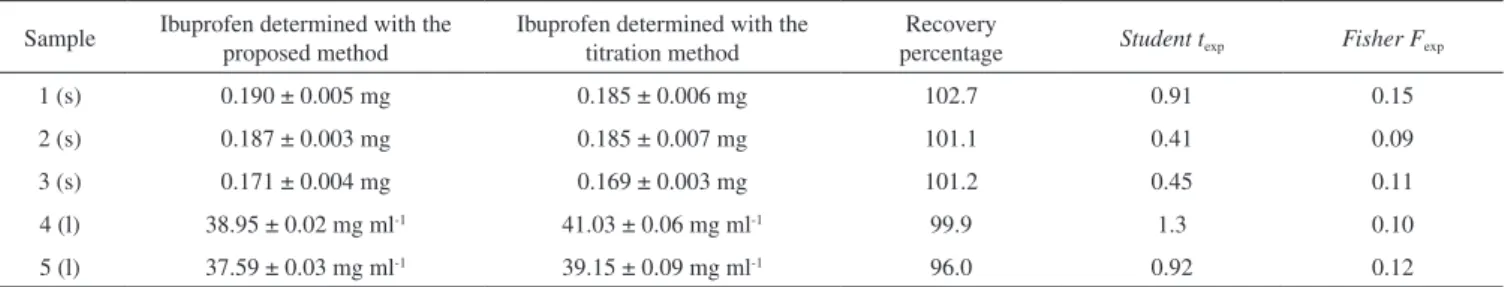
Analyses of real samples
In order to obtain the concentration measured with the electrode it was thought appropriate to use the standard addition method; after performing the statistic t test on the data acquired, a comparison was established between the outcome with this work’s electrode and that found with the accepted titration methodology. The results obtained are shown in Table 5.
CONCLUSIONS
An electrode of the second type was designed and built based on the Ag / AgIbu pair, using chronoamperometry. With this second type electrode, the ibuprofenate ion was quantiied in standard solutions, obtaining acceptable analytic parameters. The main advantages after using this device were its facility of construction and low costs involved, its rapid electrochemical response that led to signiicant reductions of analytical periods, and the fact that it can be used to quantify pharmaceutic samples with reliable results.
ACKNOWLEDGEMENTS
The authors thank CONACYT for the inancial support given through Project 180989. Also, GAAR, MEPH, CAGV, SCA and MARR thank the SNI for the distinction of their memberships and the stipend received. SIRH thanks CONACYT for the stipend received to support her Master’s studies 509512/286216.
The authors wish to thank PRODEP (Project RedNIQAE-2015) for the inancial support.
Figure 5. Change in the response of the electrode as a function of time after adding several ibuprofenate ion concentrations using the Ag / AgIbu second type electrode as working electrode
Figure 4. Potential variation obtained with the second type electrode Ag / AgIbu as a function of pH
Table 4. Values of the potentiometric constants for some ions estimated through the Fixed Matched Potential Method
Interferent Value of KA,Bpot (x 10−3)
Nitrate 7.22
Sulphate 7.22
Benzoate 9.63
Oxalate 3.22
Acetate 3.62
Chloride 14.4
Glicine 5.79
Manitol 7.22
Glucose 9.63
Table 5. Statistical comparison of the results obtained with the proposed potentiometric method and the established methodology of the European Pharmacopoeia (acid-base titration).Student texp for n=3: 2.78, Fisher Fcrit: 39
Sample Ibuprofen determined with the proposed method Ibuprofen determined with the titration method percentageRecovery Student texp Fisher Fexp
1 (s) 0.190 ± 0.005 mg 0.185 ± 0.006 mg 102.7 0.91 0.15
2 (s) 0.187 ± 0.003 mg 0.185 ± 0.007 mg 101.1 0.41 0.09
3 (s) 0.171 ± 0.004 mg 0.169 ± 0.003 mg 101.2 0.45 0.11
4 (l) 38.95 ± 0.02 mg ml-1 41.03 ± 0.06 mg ml-1 99.9 1.3 0.10
5 (l) 37.59 ± 0.03 mg ml-1 39.15 ± 0.09 mg ml-1 96.0 0.92 0.12
REFERENCES
1. Saeb-Parsy, K.; Assomull, R. G.; Kelly, E.; Instant Pharmacology, 1st ed., Wiley: England, 1999.
2. Ganda, K.; Dentist’s Guide to Medical Conditions, Medications and Complications, 2nd ed., Wiley Blackwell: New Delhi, 2013.
4. Pharmacopée Européenne 2005. Ibuprofène. Monographies.
5. Paíga, P.; Santos, H. M. L. M.; Amorim, C. G.; Araújo, A. N.; Montene-gro, B. S. M. M. C.; Pena, A.; Delerue-Matos, C.; Environ. Sci. Pollut. Res. 2012, 20, 2410.
6. Sabri, N.; Hanna, K.; Yargeau, V.; Sci. Total Environ. 2012, 427-428,
382.
7. British Pharmacopoeia 2009. British Pharmacopoeia Volume I y II. Monographs: Medicinal and Pharmaceutical Substances. Ibuprofen. 8. USP 31, Oficial Monographs/Ibuprofen
9. Sádecká, J.; akrt, M.; Hercegová, A.; Polonský, J.; Skačáni, I.; J. Pharm. Biomed. Anal. 2001, 25,881.
10. Damiani, P. C.; Bearzotti, M.; Cabezón, M. A.; J. Pharm. Biomed. Anal. 2001, 25, 679.
11. Ragehy, E. N. A.; Abdelkawy, M.; Bauyoumy, A. E.; Anal. Lett. 1994,
27, 2127.
12. Wahbi, A. A.; Hassan, E.; Hamdy, D.; Khamis, E.; Barary, M.; Pak. J. Pharm. Sci. 2005, 18,1.
13. Kaczmarek, M.; Lis, S.; Anal. Methods 2012, 4,1964.
14. Lima, A. B.; Faria, E. O.; Montes, R. H. O.; Cunha, R. R.; Richter, E. M.; Munoz, R. A. A.; dos Santos, W. T. P.; Electroanalysis 2013,25, 1585.
15. Chaves, S.; Aguilar, P.; Torres, L; Gil, E.; Luz, R.; Damos, F.; Muñoz, R.; Richter, E.; Dos Santos, W.; Electroanalysis2015, 27, 2785.
16. Álvarez-Romero, G. A.; Lozada-Ascencio, S. M.; Rodríguez-Ávila, J. A.; Galán-Vidal, C. A.; Páez-Hernández, M. E.; Food Chem. 2010, 120, 1250.
17. Nazarov, V. A.; Sokolova, E. I.; Androchick, K. A.; Egorov, V.V.; Belyaev, S. A.; Yurkshtovich, T. L.; J. Anal. Chem. 2010, 65,960.
18. Sousa, T. F. A.; Amorim C. G.; Montenegro, M. C. B. S. M.; Araújo, A. N.; Sens. Actuators, B2013, 176, 660.
19. Lenik, J.; Wardak, C.; Cent. Eur. J. Chem. 2010, 8, 382.
20. Hassan, S. S. M.; Mahmoud, W. H.; Elmosallamy, M. A. F.; Almarzooqui, M. H.; Anal. Sci. 2010, 19, 675.
21. Skoog, A. D.; Holler, J. F.; Crouch, S. R.; Principios de Análisis
Instru-mental,6th ed., CENGAGE Learning: Ciudad de México, 2008.
22. Santini, A. O.; de Oliveira, J. E.; Pezza, H. R.; Pezza, L.; Microchem. J. 2006, 84,44.
23. Bier, A. W.; Introduction to Ion-selective Measurement. Available at:
https://us.vwr.com/assetsvc/asset/en_US/id/7979405/contents, accessed August, 2016.
24. http://www.fda.gov/Drugs/GuidanceComplianceRegulatoryInformation/ Guidances/ucm201606.htm, Accessed August, 2016.
25. Umezawa, Y.; Bühlmann, P.; Umezawa, K.; Tohda, K.; Shigeru, A.;