Vol.61: e18150711, 2018
http://dx.doi.org/10.1590/1678-4324-2018150711 ISSN 1678-4324 Online Edition
BRAZILIAN ARCHIVES OF BIOLOGY AND TECHNOLOGY
A N I N T E R N A T I O N A L J O U R N A L
Carbon Dioxide
Biofixation and Production of
Spirulina
sp.
LEB 18 Biomass with Different
Concentrations of NaNO3
and NaCl
Luiza Moraes
1, Gabriel Martins da Rosa
1, Michele da Rosa Andrade Zimmermann de
Souza
1, Jorge Alberto Vieira Costa
1*
1Universidade Federal do Rio Grande – Escola de Químca e Alimentos, Laboratório de Engenharia Bioquímica, Rio Grande, Rio Grande do Sul, Brasil
ABSTRACT
Microalgae are efficient at using solar energy to turn CO2 and nutrients into biomass containing lipids, proteins, carbohydrates and other compounds that may be used to produce bioproducts for human and animal consumption and pharmaceutical use. The aim of this study was to assess the effect of the NaNO3 and NaCl concentration on the growth kinetics, the biomass composition and the ability to biofix CO2 using the microalga Spirulina sp. LEB 18. The assays were carried out according to a 22 central composite design (CCD) with different concentrations of NaNO3 (1.25, 1.88 and 2.50 g L-1) and NaCl (1.00, 15.0 and 30.0 g L-1). The assays were carried out in 2 L vertical tubular photobioreactors at 30°C, 12 h light/dark and an injection of 12.0% v/v of CO2 at 0.3 vvm. The best growing results (Xmax = 1.60 g L-1, Pmax = 0.109 g L-1 d-1, μmax = 0.208 d-1) and CO2 biofixation rate (197.4 mg L-1 d-1) were observed in the assay with 1.25 g L-1 NaNO
3 and 1.00 g L-1 NaCl. Increasing the NaCl concentration produced biomass with a higher carbohydrate content, while increasing the NaNO3 concentration reduced the protein concentration. According to the results, in addition to using Spirulina as a source of protein, it can also be used as a source of carbohydrates and to biologically remove CO2 from the atmosphere.
Keywords: CO2; fixation; growth kinetics; microalgae; nutrients.
*
Author for correspondence:[email protected]
INTRODUCTION
In light of the growing concern about global warming and the sustainable management of resources, microalgae biotechnology is a promising alternative for reducing excess CO2 emissions and for treating wastewater because it can produce biomass, which has several uses (Hende et al. 2012).
Microalgal biomass can be a source of biocompounds, including lipids, proteins, carbohydrates, vitamins and pigments (Spolaore et al. 2006). These compounds can be processed into products with high added value, such as biopolymers, pharmaceuticals, cosmetics, human food and animal feed (Ho et al. 2011). Microalgae have many favorable characteristics: they present high biomass productivity, are tolerant to seasonal variations and have a high photosynthetic efficiency to fix CO2 and accumulate quantities of compounds, such as lipids and carbohydrates (Subhadra and Edwards, 2010).
The growth kinetics and biochemical composition of microalgae can be influenced by several factors: temperature, pH, nutrient concentration of the medium, salinity, illuminance and growth phase. The definition of these parameters, whether qualitative or quantitative, can significantly change the biomass composition, inhibiting or stimulating the synthesis of biomolecules (Hu, 2004). Exposing the cultivations to conditions of stress, such as limited phosphorus and nitrogen (Mutlu et al. 2011), illuminance (Ho et al. 2012) and high salinity (Rao et al. 2007), may trigger the accumulation of biocompounds reserve.
Spirulina is a filamentous and alkaliphilic cyanobacterium. Its biomass is exceptional because it contains between 60 and 70% (w w-1) proteins, pigments (such as chlorophyll and phycocyanin) and poly-unsaturated fatty acids (such as ɣ-linolenic). Spirulina’s carbohydrate concentration can vary from 12 to 20% (w w-1) and the lipid concentration from 6 to 13% (w w-1) (Cohen, 1997). Given these low values of reserve compounds, changes in the concentration of nutrients in the culture medium can increase the content of lipids and carbohydrates.
The carbon source that is required for Spirulina cultivation represents 60.0% of the costs with nutrient (Alava et al. 1997). The CO2 concentration of 10-15% is the average value found in the combustion gases of power plants (Lee et al. 2002). The use of carbon source alternative present in the combustion gases can minimize the problems that are caused by the emission of this greenhouse gas and reduce costs with this nutrient (Hughes and Benemann, 1997) for cultivation.
Therefore, the aim of this study was to investigate the effect of the NaNO3 and NaCl concentration on the growth kinetics, biomass composition and ability of Spirulina sp. LEB 18 to biofix CO2.
MATERIALS AND METHODS
Microorganism and cultivation medium
The microalga used was Spirulina sp. LEB 18 (Morais et al. 2008), which was maintained in Zarrouk medium (Zarrouk, 1966). This strain belongs to the Cultures Collection of the Laboratory of Biochemical Engineering, Federal University of Rio Grande (FURG).
Adaptation of the inoculum
Cultivation conditions
The assays were carried out according to a 22 central composite design (CCD) (4 assays + 2 central points) (Table 1). The independent variables that were assessed in the culture medium were the concentrations of NaNO3 and NaCl.
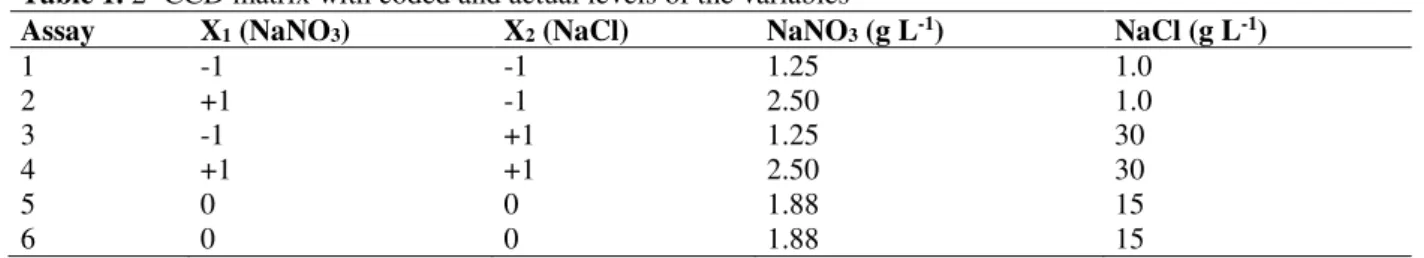
Table 1. 22 CCD matrix with coded and actual levels of the variables
Assay X1 (NaNO3) X2 (NaCl) NaNO3 (g L-1) NaCl (g L-1)
1 -1 -1 1.25 1.0
2 +1 -1 2.50 1.0
3 -1 +1 1.25 30
4 +1 +1 2.50 30
5 0 0 1.88 15
6 0 0 1.88 15
The experiments were carried out in fed-batch mode with CO2 in 2 L vertical tubular photobioreactors with a working volume of 1.5 L at 30 °C, 12 h light/dark photoperiod, and 41.6 μmolphotons m-2 s-1 (Morais and Costa, 2007) for 14 d. The stirring of the cultivations was promoted by the continuous injection of compressed air at 0.3 vvm, and during the light phase, the gas mixture was enriched with 12.0% v/v of CO2 for 15 min (Morais and Costa, 2007) every 2 h (RCO2fed = 3.24 d-1). In these conditions, but with no CO2 addition and with standard Zarrouk medium, a control assay was carried out. The daily variation in volume due to evaporation was corrected with the addition of sterile distilled water until the working volume of the photobioreactor was restored.
Analytical determinations
Samples were collected daily to monitor the biomass concentration. The biomass concentration (BC) was determined spectrophotometry using a standard curve of Spirulina sp. LEB 18 (Absorbance = 1.2515*BC + 0.0478, with R2 = 0.9934, and estimated error of 3.38%). This curve was obtained by measuring the optical density of the Spirulina inoculum in a spectrophotometer at 670 nm, by relating the optical density and dry weight biomass, as performed by Costa et al. (2002). At the end of the experiments, the biomass was centrifuged at 18,000 g for 20 min at 25 °C, resuspended three times in distilled water and then centrifuged again under the same conditions to remove salts from the medium. Subsequently, the biomass was dried at 40 °C for 24 h and stored at -20 °C until its characterization.
The concentrations of carbon (C) and nitrogen (N) in the biomass were determined in an elemental analyzer (Perkin Elmer 2400, USA) using acetanilide as the standard. The protein concentration was calculated from the concentration of elemental nitrogen using 5.22 as the conversion factor, which is specific for cyanobacteria (Lourenço et al. 2004). The lipid concentration was determined using the Folch method (Folch et al. 1957). The concentration of carbohydrates in the biomass was determined by the adapted 3.5-DNS method (Miller, 1959) with the prior acid hydrolysis of polysaccharides.
Assessment of the growth parameters
The maximum biomass concentration (Xmax, g L-1) of the Spirulina cultivations was obtained for each assay, and the kinetic parameters were calculated. The biomass productivity (Px, g L-1 d-1) was calculated according to Equation 1, where Xt (g L-1) is the biomass concentration at time t (d), and X0 (g L-1) is the biomass concentration at time t0 (d). The maximum specific growth rate (μmax, d-1) was obtained from the exponential regression of the logarithmic phase of the microalgal growth.
P
x=
X
t − t
t− X
0 o(1)
CO2 biofixation rate (RCO2)
productivity for each assay, xcbm (mgcarbon mgbiomass-1) was the mass fraction of carbon as determined using an elemental analysis of biomass, and MCO2 and MC were the molar masses of carbon dioxide and carbon, respectively.
R
CO2= P
max∗ x
cbm∗
M
CO2M
C(2)
Statistical Analysis
The responses that were obtained in the experiments were evaluated by experimental design methodology use Statistica 6.0 software (StatSoft Inc., USA). The standard error was calculated based on the replications of the central points (pure error) (Teófilo and Ferreira, 2006) with a 95.0% confidence level.
RESULTS AND DISCUSSION
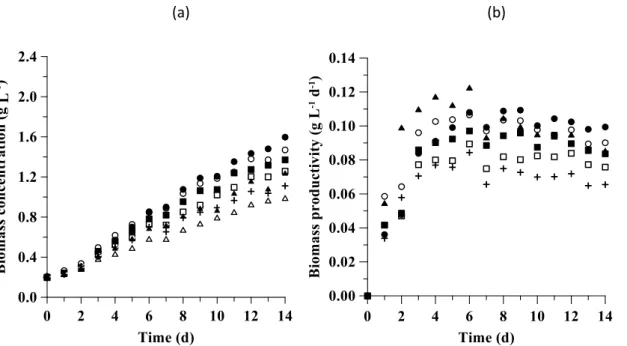
The profiles of the biomass concentration and biomass productivity of Spirulina sp. LEB 18 are shown in Figure 1. The microalga did not present a lag phase of growth due to the pre-adaptation of the inoculum, and the exponential phase was defined between the third and sixth days (Fig 1A), with coefficients of determination (R2) greater than 0.99 for all assays.
The biomass concentration was similar for the seven assays during the 4 and 5 d of cultivation, even in those with the lowest NaNO3 concentrations (1.25 g L-1) and highest NaCl concentrations (30 g L-1). The highest profile of biomass concentrations (Fig 1A) and biomass productivity (Fig 1B) were observed in the assay using 1.25 g L-1 NaNO3 and 1.0 g L-1 NaCl and were observed lower profiles of these parameters in the control assay.
(a)
(b)
Figure 1.Profiles of biomass concentration (a) and biomass productivity (b) as a function of time for assays 1 (●), 2
(○), 3 (■), 4 (□), 5 (+), 6 (▲) and control (Δ) as obtained with Spirulina sp. LEB 18 cultivation
The growth that was observed in the cultivations with the highest tested NaCl concentrations tested (15.0 and 30.0 g L-1) corroborates the fact that Spirulina tolerates higher osmotic pressures compared to the concentration that Zarrouk medium usually provides, which is 1.0 g L-1 salt. Many cyanobacteria are considerably tolerant to saline stress because they have various physiological mechanisms, including the accumulation of inorganic or organic osmoregulators (Reed et al. 1986; Mackay et al. 1984) and the active extrusion of intracellular sodium (Gabbay-Azaria et al. 1992; Peschek et al. 1994).
Table 2. Real levels of the variables and maximum biomass concentration (Xmax), maximum biomass productivity (Pmax) and maximum specific growth rate (μmax) of Spirulina sp. LEB 18 cultivation
Assay NaNO3 (g L-1)
NaCl (g L-1)
Xmax
(g L-1)
Pmax
(g L-1 d-1)
µmax
(d-1)
1 1.25 1.0 1.60 0.109 0.208
2 2.50 1.0 1.47 0.107 0.177
3 1.25 30 1.37 0.097 0.177
4 2.50 30 1.26 0.089 0.175
5 1.88 15 1.11 0.084 0.177
6 1.88 15 1.23 0.080 0.174
Control* 2.50 1.0 0.99 0.062 0.104
*Control assay carried out with no CO2 addition
The highest values of biomass concentration, biomass productivity, and specific growth rate were observed in assay 1, with 1.0 g L-1 NaCl and 1.25 g L-1 NaNO3 (Table 2). This result shows that the 50.0% reduction in the nitrogen source was not a limiting factor for the growth of the microalga. When there is a shortage of a nitrogen source, the microalga’s metabolism can use chlorophyll and other pigments as an intracellular nitrogen source (Jiang et al. 2011). Colla et al. (2007) found that a 75.0% reduction in the NaNO3 concentration of a Spirulina cultivation did not reduce the biomass productivity.
Our study corroborates this result, as the concentration of NaNO3 was reduced by 50.0% compared to the standard concentration of Zarrouk medium.
Increased of salinity normally harms cell growth due to the higher level of ionic and osmotic stress. This damage is due to changes in the ionic cellular proportions and to the selective permeability of the cell membrane to ions (Brand, 1984; Glass, 1983). This study found that 15.0 and 30.0 g L-1 NaCl in the culture medium reduced the maximum biomass concentration by 30.6% and the biomass productivity by 26.6%, taking into account the maximum and minimum values that were reached among the assays for both studied responses.
Table 3. Concentration of proteins, carbohydrates, lipids and elemental carbon in the biomass and CO2 biofixation rate (RCO2) for Spirulina sp. LEB 18
Assay Proteins (%w w-1)
Carbohydrates (% w w-1)
Lipids (%w w-1)
Carbon (%w w-1)
RCO2
(mg L-1 d-1)
1 62.4 11.3 10.3 49.2 197.4
2 60.1 15.3 16.7 48.6 189.7
3 60.3 16.7 9.2 49.5 176.2
4 55.8 14.8 10.3 46.0 150.9
5 55.6 20.8 15.9 48.3 149.5
6 56.0 20.6 12.6 48.3 141.5
Control* 58.3 15.4 12.8 48.6 -
*Control assay carried out with no CO2 addition
Limiting the nitrogen source in the cultivation of microalgae encourages the metabolism of lipids and carbohydrates. The carbon that is present in the cells will be directed to the production of reserve compounds. Therefore, competition between the synthesis of lipids and carbohydrates will occur, given that the latter are the first reserve compounds to be synthesized, followed by lipids, which are stored when the period of nitrogen shortage is longer (Siaut et al. 2011).
Table 4 presents the estimate of the main effects (L) of the concentration of NaNO3 (g L-1), the concentration of NaCl (g L-1) and the effect of the interaction between them on the concentration of proteins, carbohydrates and lipids found in the biomass of Spirulina and in the CO2 biofixation rate by Spirulina cultivation.
Table 4. Estimate of the main effects (L) and interaction between the variables for the concentrations of proteins, carbohydrates, lipids in the biomass and CO2 biofixation rate (RCO2) for Spirulina sp. LEB 18
Factor Proteins Carbohydrates Lipids RCO2
Effect p Effect P Effect p Effect p
Mean 58.4 0.001 14.5 0.002 12.5 0.050 167.7 0.009
Curvature - - 12.4 0.010 - - - -
NaNO3 (L) -3.39 0.048 1.04 0.090 3.77 0.360 -16.4 0.211
NaCl (L) -3.18 0.052 2.44 0.040 -3.78 0.360 -29.9 0.118
NaNO3 * NaCl (L) -1.10 0.147 -2.97 0.030 -2.63 0.470 -8.82 0.363
The concentration of NaNO3 in the culture medium had a significant (p <0.05) and negative (-3.39) effect on the protein concentration in the biomass, indicating that increasing the concentration of this nutrient in the culture medium decreases the concentration of proteins in the microalgal biomass. Thus, the maximum concentration of proteins in biomass (62.4%) was found in assay 1, which had a lower nitrogen concentration (1.25 g L-1 of NaNO3). However, the most pronounced reduction of protein (4.5%) occurred when it increased the concentration of nitrogen (1.25 to 2.50 g L-1) and maintained the sodium chloride concentration at 30 g L-1. In this context, it is believed that the use of NaCl at thirty times the normal level may have had a synergistic effect with increasing the nitrogen source.
Nitrogen is an essential element and is indispensable for the growth of microalgae because the formation of amino acids, proteins, enzymes, coenzymes and chloroplasts, and so forth is associated with the uptake of this compound (Turpin, 1991). Therefore, the results that were obtained in this study can be explained by the fact that the same concentration of NaNO3 was used for the inoculum adaptation. Another explanation for the higher content of proteins being found with the lowest concentration of NaNO3 is that, according to Colla et al. (2007), at 30 °C, the absorption of the culture medium’s nitrogen by the microalgae is limited.
In all of the assays that were carried out, regardless of the concentrations of NaCl and NaNO3 that were used in the cultivation, the concentrations of proteins in the Spirulina sp. LEB 18 biomass were superior to the results found by Ravelonandro et al. (2011). These authors found that the protein concentration in the biomass of Spirulina platensis decreased from 50.0 ± 2.0% to 38.0 ± 1.0% when the NaCl concentration increased from 13.0 to 35.0 g L-1.
consumption (Spolaore et al. 2006). In Zarrouk culture medium, on bench and pilot scales, the protein concentration in Spirulina can reach values between 62.0% (w w-1) (Borges et al. 2013) and 86.0% (w w-1) (Morais et al. 2009), respectively.
The NaCl concentration and the interaction between the variables (NaNO3 X NaCl) had a significant effect (p <0.05) on the concentration of carbohydrates in the biomass of Spirulina sp. LEB 18. The concentration of NaCl had a positive effect (2.44), which shows that increasing the concentration of this compound in the culture medium may increase the amount of carbohydrates of the microalgal biomass. However, the interaction had a negative and, in modulus, higher effect (-2.97) regarding the concentrations of carbohydrates in the biomass. Therefore, this effect demonstrates that an increase in the amount of NaCl and NaNO3 in the culture medium may reduce the concentration of carbohydrates of the biomass.
The experimental design contemplated the optimal point (central points) for carbohydrates concentration of the Spirulina biomass compared to the tested concentrations of NaNO3 and NaCl. This was in such a way that the estimate of curvature was statistically significant (Table 4), and the realization of axial points (-1.41 and 1.41) of the experimental design would probably lead to the optimization of the concentration of the microalgal carbohydrate.
A low nitrate, phosphate and bicarbonate concentration combined with an increased concentration of sodium chloride in the culture medium results in a substantial increase in the carbohydrate fraction of the microalgal cells and reduces the total protein content (Tadros, 1991). Vonshak et al. (1988) and Martel et al. (1992) reported that Spirulina platensis that was subjected to saline stress increased the metabolism of carbohydrate production in cells. According to Vonshak (1997), in the presence of 0.5 mol L-1 (29.3 g L-1) NaCl in the cultivation, the maximum accumulation of carbohydrates in the Spirulina biomass was 64.4% (w w-1).
When the microalga Scenedesmus obliquus was deprived of nitrogen, there was a 26.0% reduction in protein concentration, whereas the concentrations of lipids and carbohydrates increased by approximately 11.0% and 14.0%, respectively. In this study, the carbohydrate concentrations increased with the time of deprivation and peaked at 51.8% after 7 d of cultivation (Ho et al. 2012).
The concentration of lipids in the biomass of Spirulina sp. LEB 18 did not present reproducibility in the central points (Table 3). The concentration of lipids was not significantly (p > 0.05) influenced by the levels of NaNO3 and NaCl in the culture medium or by the interaction between these variables (Table 4). However, the lipid concentrations that were observed in this study were higher than the 5.0% that was reported by Borges et al. (2013) when using Spirulina sp. LEB 18 and to the 4.0% found by Batista et al. (2013) when using the biomass of Spirulina maxima.
CO2 Biofixation by Spirulina
The CO2 biofixation rate by Spirulina was not significantly influenced by the concentrations of NaNO3 and NaCl in the culture medium or by the interaction between the variables (p > 0.05) (Table 4).
In addition to nitrogen limitation and higher salinity, adding CO2 to the cultivation can increase biocompounds, such as carbohydrates and lipids, due to the greater incorporation of carbon by the microalga (Hsueh et al. 2009).
Microalgae contain approximately 50.0% (w w-1) carbon in their composition (Amaro et al. 2011). The elemental concentration of carbon for the assays was maintained in the range of 46.0 to 49.5%, with the maximum (49.5%) found in assay 3 (Table 3), with 1.25 g L-1 NaNO3 and 30 g L-1 NaCl.
The maximum CO2 biofixation rate was 197.4 mg L-1 d-1 (assay 1), 38.7% higher than the lowest RCO2 that was obtained in assay 6 (142.0 mg L-1 d-1). In assays 3 and 4, the reductions of RCO2 were also checked against assay 1. This behavior indicates that the concentrations of 15.0 and 30.0 g L-1 NaCl may result in decreased biomass productivity and thus in the reduction of CO2 biofixation by the microalga.
The CO2 biofixation rates that were found in this study (Table 3) were higher than the maximum RCO2 that was obtained in assays with Spirulina sp. LEB 18 (118 mg L-1 d-1), Chlorellavulgaris LEB 106 (124 mg L-1 d-1) and Scenedesmusobliquus LEB 22 (88 mg L-1 d -1) in Zarrouk medium and 12% v/v of CO2 (1.08 d-1) by Radmann et al. (2011). This result
stress and nitrogen limitation. Thus, the results that were obtained in this study reveal that the cultivation and production of Spirulina biomass can be carried out and that the applicability of biomass can be expanded, for example, in the production of carbohydrates.
CONCLUSION
The highest growing results (Xmax=1.60 g L-1, Pmax=0.109 g L-1 d-1, μmax=0.208 d-1) and CO2 biofixation rate (197.4 mg L-1 d-1) were obtained when Spirulina sp. LEB 18 was cultivation with 1.25 g L-1 NaNO3 and 1.0 g L-1 NaCl. Increasing the NaCl concentration in the culture medium can increase the concentration of carbohydrate in the biomass. The concentration of lipids was not significantly affected by the concentrations of NaCl and NaNO3. Regarding the protein concentration in the biomass, increasing the concentration of NaNO3 in the medium can reduce the concentration of this compound in the biomass. Thus, osmotic stress and the nitrogen deficiency increased the biosynthesis of carbohydrates and did not alter the protein concentration of the Spirulina. Besides, in these conditions, Spirulina was able biofix of CO2, reducing the emissions of this greenhouse gas.
ACKNOWLEDGEMENTS
The authors thank Eletrobras-CGTEE (Centrais Elétricas Brasileiras S.A.-Companhia de Geração Térmica de Energia Elétrica) and CAPES (Coordenação de Aperfeiçoamento de Pessoal de Nível Superior) for the financial support provided to conduct this work, and the Program of Support to Publication of the Academic Production/PROPESP/FURG/2015.
REFERENCES
1. Alava D, Mello PC, Wagener K. The relevance of the CO2 partial pressure of sodium bicarbonate solutions for the mass cultivation of the microalga Spirulina. J Brazil Chem Soc. 1997; 8: 447-450.
2. Amaro HM, Guedes A, Malcata FX. Advances and perspectives in using microalgae to produce biodiesel. Appl Energ. 2011; 88 (10): 3402–3410.
3. Batista AP, Gouveia L, Bandarra NM, Franco JM, Raymundo A. Comparison of microalgal biomass profiles as novel functional ingredient for food products. Algal Research. 2013; 2:164–173.
4. Borges JA, Rosa GM, Meza LHR, Henrard AA, Souza MRAZ, Costa JAV. Spirulina sp. LEB-18 culture using effluent from the anaerobic digestion. Braz J Chem Eng. 2013; 30 (2): 277-287.
5. Brand LE. The salinity tolerance of forty-six marine phytoplankton isolates. Estuar Coast Shelf S. 1984; 18 (5): 543-556.
6. Cohen Z. The Chemicals of Spirulina. In: Vonshak A. Spirulina platensis (Arthrospira) Physiology, cell-biology and biotechnology. London: Taylor & Francis Ltd; 1997. p. 175-204.
7. Colla LM, Reinehr CO, Reichert C, Costa JAV. Production of biomass and nutraceutical compounds by Spirulina platensis under different temperature and nitrogen regimes. Bioresource Technol. 2007; 98 (7): 1489-1493.
8. Costa JAV, Colla LM, Duarte Filho P, Kabke K, Weber A. Modeling of Spirulina platensis growth in fresh water using response surface methodology. World J Microb Biot. 2002; 18: 603-607.
9. Folch J, Lees M, Stanley GHS. A simple method for isolation and purification of total lipids from animal tissues. J Biol Chem. 1957; 226: 497-509.
10. Gabbay-Azaria R, Schofeld M, Tel-Or S, Messinger R, Tel-Or E. Respiratory activity in the marine cyanobacterium Spirulina subsalsa and its role in salt tolerance. Arch Microbiol. 1992; 157:183–190.
11. Glass ADM. Regulation of ion transport. Annu Rev Plant Phys. 1983; 34 (1): 311-326. 12. Hende SV, Vervaeren H, Boon N. Flue gas compounds and microalgae: (Bio-) chemical
13. Ho S-H, Chen C-Y, Chang J-S. Effect of light intensity and nitrogen starvation on CO2 fixation and lipid/carbohydrate production of an indigenous microalga Scenedesmus obliquus CNW-N. Bioresource Technol. 2012; 113: 244–252.
14. Ho S-H, Chen C-Y, Lee D-J, Chang J-S. Perspectives on microalgal CO2-emission mitigation systems - A review. Biotechnol Adv. 2011; 29: 189–198.
15. Hsueh HT, Li WJ, Chen HH, Chu H. Carbon bio-fixation by photosynthesis of Thermosynechococcus sp. CL-1 and Nannochloropsis oculta. J Photoch Photobio B. 2009; 95: 33–39.
16. Hu Q. Environmental effects on cell composition. In: Richmond A. Handbook of Microalgal Culture: Biotechnology and Applied Phycology. Ed. Blackwell Science Ltd, 2004. p. 83–93.
17. Hughes E, Benemann J. Biological fossil CO2 mitigation. Energy Convers Manage. 1997; 38: 467–473.
18. Jiang L, Luo S, Fan X, Yang Z, Guo R. Biomass and lipid production of marine microalgae using municipal wastewater and high concentration of CO2. Appl Energ. 2011; 88: 3336-3341.
19. Lee, JS, Kim, DK, Lee, JP, Park, SC, Koh, JH, Cho, HS, Kim, SW, 2002. Effects of SO2 and NO on growth of Chlorella sp. KR-1. Bioresource Technol. 2002; 82: 1–4.
20. Lourenço SO, Barbarino E, Lavín PL, Marquez UML, Aidar E. Distribution of intracellular nitrogen in marine microalgae: calculation of new nitrogen-to-protein conversion factors. Eur J Phycol. 2004; 39: 17-32.
21. Mackay MA, Norton RS, Borowitzka LJ. Organic osmoregulatory solutes in cyanobacteria. J Gen Microbiol. 1984; 130: 2177–2191.
22. Martel A, Yu S, Garcia-Reina G, Lindblad P, Pedersen M. Osmoic-adjustement in the cyanobacterium Spirulina platensis: presence of and α-glucosidase. Plant Physiol bioch. 1992; 30 (5): 69-74.
23. Miller GL. Use of de dinitrosalicylic acid reagent for determination of reducing sugar. Anal Chem. 1959; 31 (3): 426-428.
24. Morais MG, Costa JAV. Carbon dioxide fixation by Chlorella kessleri, C. vulgaris, Scenedesmus obliquus and Spirulina sp. cultivated in flasks and vertical tubular photobioreactors. Biotechnol Lett. 2007; 29: 1349–1352.
25. Morais MG, Radmann EM, Andrade MR, Teixeira GG, Brusch LRF, Costa JAV. Pilot scale semicontinuous production of Spirulina biomass in southern Brazil. Aquaculture. 2009; 294 (1–2): 60–64.
26. Morais MG, Reichert CC, Dalcanton F, Durante AJ, Marins LF, Costa JAV. Isolation and Characterization of a New Arthrospira Strain. Z Naturforsch. 2008; 63: 144-150.
27. Mutlu YB, Isik O, Uslu L, Koç K, Durmaz Y. The effects of nitrogen and phosphorus deficiencies and nitrite addition on the lipid content of Chlorella vulgaris (Chlorophyceae). Afr J Biotechnol. 2011; 10 (3): 453-456.
28. Peschek GA, Obinger C, Fromwald S, Bergman B. Correlation between immuno-gold lables and activities of cytochrome-c oxidase(aa3-type) in membranes of salt stressed cyanobacteria. FEMS Microbiol Lett. 1994; 124: 431–437.
29. Radmann EM, Camerini FV, Santos TD, Costa JAV. Isolation and application of SOX and NOX resistant microalgae in Biofixation of CO2 from thermoelectricity plants. Energ Convers Manage. 2011; 52: 3132-3136.
30. Rao AR, Dayananda C, Sarada R, Shamala TR, Ravishankar GA. Effect of salinity on growth of green alga Botryococcus braunii and its constituents. Bioresource Technol. 2007; 98: 560–564.
31. Ravelonandro PH, Ratianarivo DH, Joannis-Cassand C. Improvement of the growth of Arthrospira (Spirulina) platensis from Toliara (Madagascar): Effect of agitation, salinity and CO2 addition. Food Bioprod Process. 2011; 89: 209–216.
32. Reed RH, Borowitzka LJ, Mackay MA, Chudek JA, Foster R, Warr SRC, et al. Organic solute accumulation in osmotically stressed cyanobacteria. FEMS Microbiol Rev. 1986; 39: 51–56.
34. Spolaore P, Joannis-Cassan C, Duran E, Isambert A. Commercial applications of microalgae. J Biosci Bioeng. 2006; 101: 87-96.
35. Sudhir P-R, Pogoryelov D, Kovács L, Garab G, Murthy SDS. The Effects of Salt Stress on Photosynthetic Electron transport and Thylakoid Membrane Proteins in the Cyanobacterium Spirulinaplatensis. J Biochem Mol Biol. 2005; 38 (4): 481-485.
36. Subhadra B, Edwards M. An integrated renewable energy park approach for algal biofuel production in United States. Energ Policy. 2010; 38 (9): 4897–4902.
37. Tadros, M. Chemical composition of cyanobacteria: Spirulina maxima in response to nutrients, in bath cultures. In: Second International Marine Biotechnology Conference (IMBC/91), 1991, Baltimore, USA. p.13-16.
38. Teófilo RF, Ferreira MMC. Quimiometria II: planilhas eletrônicas para cálculos de planejamentos experimentais, um tutorial. QuimNova. 2006; 29 (2): 338-350.
39. Toledo-Cervantes A, Morales M, Novelo E, Revah S. Carbon dioxide fixation and lipid storage by Scenedesmusobtusiusculus. Bioresource Technol. 2013; 130: 652–658. 40. Turpin, DH. Effects of inorganic N availability on algal photosynthesis and carbon
metabolism. J Phycol.1991; 27: 14–20.
41. Vonshak A, Guy R, Guy M. The response of the filamentous cyanobacterium Spirulina platensis to salt stress. Arch Microbiol. 1988; 150: 417-420.
42. Vonshak A. Outdoor mass production of Spirulina. In: Vonshak A. Spirulina platensis (Arthrospira) Physiology, cell-biology and biotechnology. London: Taylor & Francis Ltd, 1997. p. 79-99.
43. Zarrouk, C. Contribution à l’étude d’unecyanophycée. Influence de diversfacteurs physiques et chimiquessur la croissance et photosynthese de Spirulina maxima Geitler. Ph.D. Thesis, University of Paris, 1966.