Artigo
*e-mail: [email protected]
A SENSITIVE AND ROBUST LC-MS/MS METHOD WITH MONOLITHIC COLUMN AND ELECTROSPRAY IONIZATION FOR THE QUANTITATION OF EFAVIRENZ IN HUMAN PLASMA: APPLICATION TO A BIOEQUIVALENCE STUDY
Danilo Cesar Galindo Bedor*, Jose Homero de Souza Filho,Virna Ligiane Souza Ramos, Talita Mota Gonçalves, Carlos Eduardo Miranda de Sousa e Davi Pereira de Santana
Departamento de Ciências Farmacêuticas, Universidade Federal de Pernambuco, Rua Prof. Arthur de Sá, s/n, Cidade Universitária, 50740-520 Recife - PE, Brasil
Recebido em 12/7/10; aceito em 17/12/10; publicado na web em 25/3/11
An LC-MS/MS method has been developed for the determination of efavirenz (EFZ) in human plasma using hydrochlorothiazide as internal standard (I.S.). An ESI negative mode with multiple reaction-monitoring was used monitoring the transitions m/z 313.88 69.24 (EFZ) and 296.02→204.76 (I.S.). Samples were extracted using liquid-liquid extraction. The total run time was 2.0 min. The
separation was achieved with HPLC-RP using a monolithic column. The assay was linear in the concentration range of 100 – 5000 ng mL-1. The mean recovery was 83%. Intra- and inter-day precision were < 9.5% and < 8.9%, respectively and accuracy was in the range ± 8.33%. The method was successfully applied to a bioequivalence study.
Keywords: efavirenz; bioequivalence; LC-MS/MS.
INTRODUCTION
Efavirenz, (S)-6-chloro-4-(cyclopropylethynyl)-1,4-dihydro-4-(triluoromethyl)-2H-3,1-benzoxazin-2-one,1 is a non-nucleoside
reverse transcriptase inhibitor2 and is the irst anti-HIV drug licensed
for once-daily use (Figure 1). This is because of its long half-life, whi-ch means effective concentrations are maintained for long periods.3
Several methods are described in literature for the quantiication of efavirenz in biological luids by high performance liquid chroma-tography with ultraviolet detection (HPLC-UV),4-22 HPLC with
luo-rescence detector,23 liquid chromatography with mass spectrometry
detection (LC-MS),24 liquid chromatography with mass spectrometry
in tandem detection(LC-MS/MS)25-29 and matrix assisted laser
desorp-tion/ionization with time-of-light in tandem detection (MALDI-TOF/ TOF).30 When sample throughput is an important issue, such as in
pharmacokinetic applications, the development of rugged methods with short analysis times becomes an important consideration.31-33 The
purpose of this study was to develop and validate a fast and sensitive bioanalytical method, used for the quantiication of efavirenz in hu-man plasma samples with respect to their selectivity, sensitivity and capacity for high-throughput analysis of samples in complex matrices.
It was successfully applied to a bioequivalence study of two formula-tions of 600 mg efavirenz tablets. Recently, HPLC method34 was used
for its high sensitivity and selectivity. But the long analysis time (10 min) may not meet the requirement for high throughput and speed in biological specimen analysis of pharmacokinetic (PK) studies. With a comparative sensitivity with those reported (LOQ on- column was 0.5 pg), the chromatographic run time was 2.0 min, which was only one ifth of that reported.34 The method was fully validated and applied
to a live subjectPK study in 30 volunteers after oral administration of coated efavirenz tablets (600 mg).
EXPERIMENTAL
Chemical and reagents
Efavirenz reference standard was acquired from Cristália (99.97%) and hydrochlorothiazide pharmacopeial reference stan-dard, used as internal standard (I.S.) was acquired from the Instituto Nacional de Controle de Qualidade em Saúde (INCQS, Rio de Ja-neiro, Brazil). HPLC-grade methyl tert-butyl ether, acetonitrile and isopropyl alcohol used were from J.T. Baker(Phillipsburg, NJ, USA) and the water was puriied using a MilliQ system from Millipore (Billerica, MA, USA).
LC-MS/MS instruments
LC-MS/MS consisting of a low pressure quaternary gradient system (LC 10ADvp), an autosampler (SIL 10ADvp), a degasser (DGU-14A), a system controller (SCL 10Avp) all from Shimadzu (Kyoto, Japan), and a Quattro-LC triple quadrupole mass spectrometer equipped with an electrospray ionization source for mass detection and all the control and data processing was achieved with the Mass-lynx Software v3.5 (Micromass, Manchester, UK).
For sample extraction, a Jouan M23i refrigerated centrifuge (St. Herblain, France) was used. Samples were stored at -70 ºC in a REVCO freezer (Asheville, NC, USA) until analysis.
Chromatography conditions
Chromatographic separation was performed on an Onix C18
co-lumn (50 x 4.6 mm I.D., monolithic). Isocratic elution mode of the analytes from the column was achieved with a mobile phase consisting of acetonitrile/water (50:50 v/v + 5% of isopropyl alcohol) at a low rate of 1.5 mL min-1. The column was kept at 35 °C. Before use, the
mobile phase was iltered through a 0.45 µm nylon membrane. The injection volume was 5 µL and the analysis time was 2.0 min. Mass spectrometer conditions
The HPLC eluent was split 1:10 to 150 µL min-1 into the mass
spectrometer. The mass spectrometer was operated using an electros-pray source conigured to negative ion mode (ESI-) and acquisition was done using multiple reaction-monitoring (MRM). Nitrogen (UHP N2) served as desolvation gas at 389 L h
-1. The dwell time was 0.5 s
for each transition, the inter-channel delay and the inter-scan delay were 0.1 s. The ion transitions selected for MRM detection were: m/z 313.88→69.24 and 296.02→204.76 for EFZ and IS, respectively.
Preparation of calibration curve standards and quality control (QC) samples
The stock solutions of efavirenz (1.0 mg mL-1) and the internal
standard stock solution (1.0 mg mL-1) were made in acetonitrile:water
(1:1 v/v). The working solutions of efavirenz were prepared from 1000 to 5000 ng mL-1. The internal standard working solution was
also prepared in mobile phase at a concentration of 3000 ng mL-1.
The calibration curves for efavirenz were prepared in human plasma at nine concentration levels of 100, 200, 400, 800, 1000, 1500, 2500, 3500 and 5000 ng mL-1. Quality control samples were
also prepared in human plasma at the following concentrations: 100, 300, 2000 and 4000 ng mL-1 (low, medium and high quality
controls respectively). All calibration samples were prepared by adding 100 µL of efavirenz stock solution to 9900 µL of human plasma, taken from a pool of 6 volunteers. Drug-free plasma for the preparation of standards and QC was obtained from Hemocenter of Pernambuco, HEMOPE (Recife, Pernambuco). The concentration of efavirenz stock solution used was adjusted to give the dilution (10x dilution) of the concentration required by the calibration sample to be prepared.
Sample preparation
A 25 µL aliquot of the IS solution (hydrochlorothiazide 3 µg mL-1) and 1000 µL of methyl terc-butyl ether were added to 100
µL of plasma sample. The sample was vortex-mixed for 1 min. The organic and aqueous phases were separated by centrifugation at 2000 x g for 5 min. The upper organic phase was transferred to a glass tube and evaporated at 40 ºC under a stream of nitrogen. The residue was redissolved in 400 µL of mobile phase, of which 200 µL was transferred into 250 µL glass vials and placed in the autosampler for analysis. The injection volume was 5 µL.
Study design
The bioequivalence studies were conducted using a two-way crossover experimental design, open-label, balanced, two-period (a three weeks washout interval between dose was used), two-sequence, randomized study in 30 healthy volunteers from 18 to 45 years of age. All volunteers were required to sign an informed consent form, and the clinical protocol had the approval of the Ethics Committee
of the Universidade Federal de Pernambuco (UFPE). Blood samples (8 mL) were collected from an indwelling catheter (BD Angiocath, Becton, Dickinson and Company, Franklin Lakes, New Jersey) in the antecubital forearm vein. Samples were obtained before each dose and at 0.5, 1, 1.5, 2, 2.5, 3, 3.5, 4, 5, 6, 8, 10, 12, 24, 36, and 48 h after dosing. After collection of each sample, the catheter was lushed with 1 mL of heparinized saline (Blausiegel Ind. E Com. Ltda., Cotia, Brazil) 10 IU/mL. Blood samples were immediately transferred to two 4-mL EDTA-containing tubes (ZheJiang GongDong Medical Tech-nology Company, Ltd., Taizhou, Zhejiang, China) and centrifuged at room temperature for 5 min at 1350 g (JOUAN SA, Saint-Herblain, France). Plasma was transferred to cryogenic tubes with disposable polypropylene tips and stored frozen at –70 °C until analyzed. Pharmacokinetics and statistical analysis
Efavirenz plasma concentrations were analyzed as a function of time. The following pharmacokinetic parameters were obtained for each formulation: The maximum plasma concentration (Cmax), the amount of time that a drug is present at the maximum concentration in plasma (tmax), area under of the curve from time zero to the last time point at which concentrations were measurable (AUC0–t), and area
un-der of the curve from time zero to ininite (AUC0–∞). Cmax and Tmax
were obtained directly from the original data set, and AUC0–t was
calculated using the linear trapezoidal rule. AUC0–∞was calculated
as AUC0–t + Ct/ke, where Ct was the last measured concentration and
ke (elimination rate constant) was calculated using linear regression analysis of the log-linear portion of the plasma concentration–time curve. The plasma half-life (t1/2) was calculated as ln2/ke.
Values for Tmax were compared using the Wilcoxon rank sum test. Applying a noncompartmental model to the log-transformed data, efavirenz Cmax, AUC0–t, and AUC0–∞ were compared by ANOVA for
a crossover design, taking into account the effects of formulation, period, sequence, and subject.
The ratios and 90% conidence intervals (CIs) of Cmax, AUC0–t,
and AUC0–∞ were calculated for both formulations, and 2 one-sided
t tests were used to evaluate whether the 90% CIs of the geometric mean ratios (test:reference) for these parameters met the Agência Nacional de Vigilância Sanitária (ANVISA) and Food and Drug administration (FDA) criterion for bioequivalence (ie, were within the 80-125% range).
All pharmacokinetic and statistical analyses were performed using WinNonlin Professional Software version 5.1 (Pharsight Cor-poration, Mountain View, California).
RESULTS AND DISCUSSION
LC-MS/MS
LC optimization
MS/MS optimization
Figure 2 shows the EFZ negative ion electrospray product ion mass spectra. Efavirenz and I.S. produced deprotonated precursor ion, [M - H]- at m/z 313.88 and 296.02, respectively. The base peak
of EFZ and I.S. as observed from their respective product ion spectra were at m/z 69.24 and 204.76, respectively. The source temperature was optimized at 110 ºC, desolvation temperature was 300 ºC, and desolvation gas low was 389 L h−1. The capillary voltage was set at
3.2 kV, while optimized cone voltage values for EFZ and I.S. were 27 and 37 V, respectively. The collision energy was optimized for EFZ (40 V) and 23 V for IS. The multiplier was set at 800 V and argon was used as the collision gas at a pressure of 1.88 x 10⁻³ psi
in the collision cell.
Method validation
Selectivity
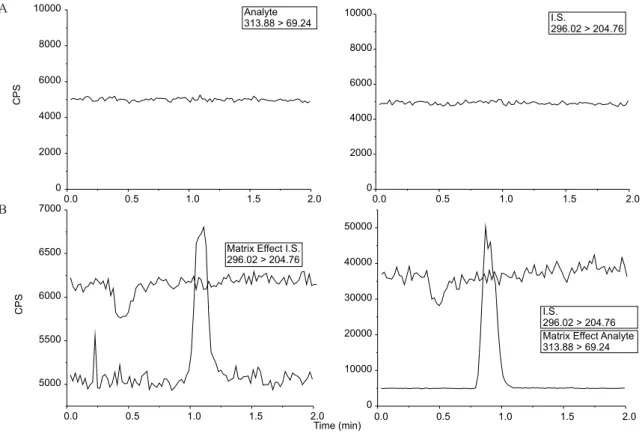
Selectivity (Figure 3A) was assessed by comparing the chro-matograms of 7 different blank human plasma samples (including lipemic, hemolysed and plasma spiked with the anticoagulant used in bioequivalence study, EDTA) with the corresponding spiked plasma. The matrix effect was evaluated by monitoring the MS signal during an infusion of a standard EFZ solution, while injecting a blank human plasma sample. No signiicant ion suppression effect was observed in retention time of the analyte and I.S. (Figure 3B).
Linearity
The quality of bioanalytical data is highly dependent on the qua-lity of the standard curve and the calibration model used to generate
it.35,36 The calibration curve of EFZ was linear over the range from
100.000 to 5000.000 ng mL-1 (100.000, 200.000, 400.000, 800.000,
1000.000, 1500.000, 2500.000, 3500.000 and 5000.000 ng mL-1)
for the LC-MS/MS method y = 0.9792 (± 0.0331) x + 0.0377 (± 0.0761), r2 = 0.994587 (± 0.002640), n = 3. For the
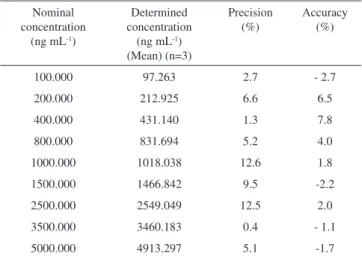
quantiica-tion of efavirenz, a linear least-squares regression with a weighting factor of 1/x2was used. Table 1 shows the results obtained with linearity test.
Recovery
The recovery of EFZ was evaluated with three quality controls (low, medium and high) by comparing the peak area ratios (peak area of the solution/peak area of the plasma sample extracted). Mean extraction recoveries of efavirenz at 300.000, 2000.000 and 4000.000 ng mL-1 were 83 ± 3%, 79 ± 6%, 88 ± 9%, respectively
(n = 6). Mean recovery of the internal standard (3000.000 ng mL-1)
was 84 ± 2% (n=6). Figure 2. Negative ion mode electrospray mass spectra of efavirenz (Product
ion)
Figure 3. Chromatograms demonstrating selectivity of the method. Samples of blank plasma (A) and plasma spiked with efavirenz at a concentration corres-ponding to the LLOQ and I.S. with matrix effect experiment (B)
A
Precision and accuracy
The results for inter-assay precision and accuracy for the quality control samples at concentration levels of 100.000, 300.000, 2000.000 and 4000.000 ng mL-1 for EFZ are summarized in Table 2. The
intra-assay precision RSD varied from 2.8 to 9.3%. The inter-assay precision RSD for samples at the lower limit of quantiication (LLOQ) was 7.4% and the intra-assay precision RSD varied from 4.6 to 8.7%. Although several methods for the quantiication of EFZ have been reported in the literature,4-30,34 the method described here has
demonstrated to be precise and accurate for the determination of these analytes in plasma in accordance with international standards. The shorter analysis time achieved here would result in higher throughput in the quantiication of samples.
Stability studies
The stability studies were performance with low and high QCs concentrations. Table 3 lists data for benchtop, autosampler, freeze/ thaw and storage stability. Benchtop stability was investigated to ensure that efavirenz remained stable in plasma samples at room tem-perature for a time period that covered sample preparation short-term stability. Two sets of plasma samples at concentrations of 300.000 and 4000.000 ng mL-1 for EFZ were left at room temperature (23 ºC)
for 6 h. The samples were then processed and analyzed. The results indicated that EFZ was stable for the entire period of the experiment. Due to the occasional need for delayed injection or reinjection of extracted samples, stability of EFZ in the inal solution was evaluated
in the autosampler at room temperature (23 ºC). Two sets of plasma samples at concentrations of 300.000 and 4000.000 µg mL-1 of
efa-virenz were extracted, loaded into the autosampler and kept in the autosampler for 33 h before injection. The quantitative results indi-cated (Table 3) that EFZ was stable in the autosampler for at least 33 h. For freeze-thaw stability, QCs samples at two concentrations. The QCs were submitted to two freeze-thaw cycles, each cycle consisting of removing the QCs from the freezer, thawing them unassisted to room temperature, keeping samples at room temperature for 3 h and refreezing at – 70 ºC. The samples were processed along with a stan-dard curve and concentrations were determined. The results indicated that EFZ had an acceptable stability after three freeze-thaw cycles in human plasma. The storage stability at – 70 ºC was also tested using QCs samples. The stability was closely monitored during validation and sample analysis periods, and no degradation of the compounds was observed. The 10-week stability data is also listed in Table 3. The results indicated that EFZ did not show evidence of signiicant degradation in plasma for at least 10 weeks when stored at – 70 ºC.
Statistical analyses, pharmacokinetic parameters
Figure 4 shows the averaged plasma concentration-versus-time curves for efavirenz after administration of the reference and test formulations. The reference formulation was Stocrin® (Merck Sharp
& Dohme) in a dosage of 600 mg EFZ administered as a coated tablet and the test formulations were administered at the same dose regimen and consisted also of coated tablets. Table 4 show the values of the main pharmacokinetic parameters used in the bioequivalence study: Cmax, AUC0-t, AUC0-∞, Tmax.
The mean Cmax for the reference product was 2.961 ± 1.032 µg mL-1 according to a recent publication.17 The plasma
half-life obtained in this study was 45.485 h for reference formulation according the literature data.37
The shortest conidence interval (90%) for the ratio of Cmax means was 36.1% (lower limit) and 45.3% (upper limit). Mean Cmax calculated by the method of least squares for the reference drug was 2.8 and 1.1 µg mL-1 for the test, resulting in a ratio (C
maxtest/
Cmaxreference) of 40.4 and a test power of 94.3%.The area under the
concentration-time curve from zero time to the time of the last sample collection, AUC(0-t) had lower and upper shortest conidence limits (90%) of 61.9 and 79.1, respectively. The AUC(0-t) means calculated by method of least squares were 63.7 µg/mL.h for the reference drug and 44.6 µg/mL.h for the test drug resulting in a ratio (test/reference) of 70.0 and a test power for AUC(0-t) of 91.2%.
When the area under the concentration-time curve from zero to ininite (AUC0-inf) was calculated, the lower and upper shortest Table 1. Results of precision and accuracy of concentrations levels of
line-arity test Nominal concentration
(ng mL-1)
Determined concentration
(ng mL-1) (Mean) (n=3)
Precision (%)
Accuracy (%)
100.000 97.263 2.7 - 2.7
200.000 212.925 6.6 6.5
400.000 431.140 1.3 7.8
800.000 831.694 5.2 4.0
1000.000 1018.038 12.6 1.8
1500.000 1466.842 9.5 -2.2
2500.000 2549.049 12.5 2.0
3500.000 3460.183 0.4 - 1.1
5000.000 4913.297 5.1 -1.7
Table 2. Precision and accuracy of efavirenz
Nominal conc. (ng mL-1)
Intraday (ng mL-1) (n=6)
Interday (ng mL-1) (n=24)
Day 1 Day 2 Day 3
Mean (R.S.D.%)
Mean (R.S.D.%)
Mean (R.S.D.%)
Mean
(S.D.) Prec. (R.S.D.%)
Acc. (R.E.%) 100.000 106.295
(7.23)
103.021 (8.73)
110.173
(4.64) 106.496 (7.913) 7.4 6.5
300.000 324.372 (5.48)
330.082 (2.79)
287.083 (8.36)
315.943
(26.381) 8.4 5.3
2000.000 1893.604 (9.24)
2145.503 (5.55)
1949.428 (7.40)
1995.195
(177.772) 8.9 - 0.2
4000.000 4196.729 (5.77)
3810.731 (5.77)
3927.206 (9.30)
3968.348
conidence limits (90%) were 68.18 and 87.70, respectively. The mean AUC(0-inf) calculated for the reference and test formulation by the least squares were 63.2 and 81.7 µg/mL.h resulting in a ratio (test formulation/reference formulation) of 77.3 and a power of test of 90.1%.
DISCUSSION
In many bioanalytical applications, sample preparation and total analysis time can signiicantly reduce the throughput of an analytical
procedure.38-40,44 This is critical for some applications such as
phar-macokinetic studies that handle a large number of samples. Theron et al.44 described a method for quantiication of EFZ in human saliva
with a LLOQ of 6.11 ng mL-1, but with a long analysis time 8.5
min. Recent approaches applied to increase overall productivity in high-throughput applications include the use of simultaneous positive and negative electrospray ionization41 and the use of ultra
performance liquid chromatography (UPLC) for shorter analysis times.42 In this study LC-MS/MS with liquid-liquid extraction
me-thod for the quantiication of efavirenz demonstrated good precision, accuracy and linearity, with a short analytical time, reducing the total analysis time. Several LC-MS/MS methods described in the literature were developed for simultaneous quantiication of various anti-HIV agents with a long analytical time.16,24,26,27,29,43 This method
for quantitation of efavirenz in human plasma show an analytical time of 2.0 min and was successfully applied in a bioequivalence study. The use of mass spectrometric detection in MRM mode is less demanding on chromatographic separation between analytes and early-eluting interferents due to improved selectivity and this feature can be explored to increase sample throughput by reducing sample analysis time, provided adequate selectivity without ion suppression is achieved.
Several articles describe methods for efavirenz quantitation in biological luids but did not show comparative pharmacokinetic proile and application of high-throughput samples, with most of them being applied to therapeutic drug monitoring.4,6,13,23 In 2006
Ramachandran et al.17 describes a bioanalytical method by HPLC
with UV detection and application in 3 volunteers with 10 collected blood samples in different times after the administration of Efavirenz and did not show application of high-throughput samples.
CONCLUSION
We have described a simple, rapid LC-MS/MS assay for the quan-tiication of efavirenz in human plasma, which showed acceptable precision and adequate sensitivity. Hence, it can be easily adopted for the high-throughput routine bioanalysis of efavirenz. Despite the negative result of the bioequivalence study (with test formulation differing signiicantly from the reference), the method proved ade-quate for the determination of differences between pharmaceutical formulations and demonstrated a robust scale for analysis of 1260 samples with high throughput.
REFERENCES
1. Best, B. M.; Goicoechea, M.; Expert Opin. Drug Metabol. Toxicol. 2008, 4, 965.
2. Clercq, E. D.; Antiviral Res. 1998, 38, 153. 3. Hillery, A.; Pharm. Sci. Tech. Today 1999, 2, 389.
4. Veldkamp, A. I.; van Heeswijk, R. P. G.; Meenhorst, P. L.; Mulder, J. W.; Lange, J. M. A.; Beijnen, J. H.; Hoetelmans, R. M. W.; J. Chromatogr., B: Anal. Technol. Biomed. Life Sci. 1999, 734, 55.
5. Marzolini, C.; Telenti, A.; Buclin, T.; Biollaz, J.; Decosterd, L. A.; J. Chromatogr., B: Anal. Technol. Biomed. Life Sci. 2000, 740, 43. 6. Aymard, G.; Legrand, M.; Trichereau, N.; Diquet, B.; J. Chromatogr.,
B: Anal. Technol. Biomed. Life Sci. 2000, 744, 227.
7. Proust, V.; Toth, K.; Hulin, A.; Taburet, A. M.; Gimenez, F.; Singlas, E.; J. Chromatogr., B: Anal. Technol. Biomed. Life Sci. 2000, 742, 453. 8. Sarasa-Nacenta, M.; Lopez-Pua, Y.; Lopez-Cortes, L. F.; Mallolas, J.;
Gatell, J. M.; Carné, X.; J. Chromatogr., B: Anal. Technol. Biomed. Life Sci. 2001, 763, 53.
9. Simon, V. A.; Thiam, M. D.; Lipford, L. C.; J. Chromatogr., A 2001, 913, 447.
Table 3. Results of the degradation of efavirenz in biological matrix of stability studies
Stability test
Efavirenz (n=4) Nominal
conc. (ng mL-1)
Precision (R.S.D.)
(%)
Accuracy (R.E.)
(%) Bench top stability 300.000 8.1 -2.1 4000.000 3.6 -1.6 Autosampler stability 300.000 10.0 -6.8 4000.000 10.4 5.3 Freeze-thaw stability 300.000 10.3 -2.6
4000.000 8.4 0.8
42-days storage stability 300.000 6.0 5.3
4000.000 7.9 1.9
Solution stability 300.000 5.2 -2.6 4000.000 4.9 -3.8
Table 4. Pharmacokinetic parameter for test and reference formulations
Pharmacokinetic parameter
Test formulation mean (RSD%)
Reference formulation mean (RSD%) AUC(0-t) (µg/mL h) 48.769 ± 18.8 66.887 ± 21.1 AUC(0-inf) (µg/mL h) 68.788 ± 24.8 86.842 ± 31.2 Cmax (µg/mL) 1.225 ± 0.6 2.961 ± 1.0
tmax (h) 7.00 ± 6.6 3.233 ± 2.1
t1/2 (h) 49.173 ± 20.5 45.485 ± 20.9 AUC(0-t) - Area under of the curve from time zero to the last time point at which concentrations were measurable. AUC(0-inf) - Area under of the curve from time zero to ininite. Cmax - The maximum plasma concentration. tmax - The amount of time that a drug is present at the maximum concentra-tion in plasma. t1/2 - The plasma half-life
10. Langmann, P.; Schirmer, D.; Vath, T.; Zilly, M.; Klinker, H.; J. Chro-matogr., B: Anal. Technol. Biomed. Life Sci. 2001, 755, 151.
11. Rezk, N. L.; Tidwell, R. R.; Kashuba, A. D. M.; J. Chromatogr., B: Anal. Technol. Biomed. Life Sci. 2002, 774, 79.
12. Turner, M. L.; Reed-Walker, K.; King, J. R.; Acosta, M. L.; J. Chro-matogr., B: Anal. Technol. Biomed. Life Sci. 2003, 784, 331.
13. Kappelhoff, B. S.; Rosing, H.; Huitema, A. D. R.; Beijnen, J. H.; J. Chromatogr., B: Anal. Technol. Biomed. Life Sci. 2003, 792, 353. 14. Rezk, N. L.; Tidwell, R. R.; Kashuba, A. D. M.; J. Chromatogr., B: Anal.
Technol. Biomed. Life Sci. 2004, 805, 241.
15. Dailly, E.; Rafi, F.; Jolliet, P.; J Chromatogr., B: Anal. Technol. Biomed. Life Sci. 2004, 813, 353.
16. Colombo, S.; Beguin, A.; Marzolini, C.; Telenti, A.; Biollaz, J.; De-costerd, L. A.; J. Chromatogr., B: Anal. Technol. Biomed. Life Sci. 2006, 832, 138.
17. Ramachandran, G.; Kumar, A. K. H.; Swaminathan, S.; Venkatesan, P.; Kumaraswami, V.; Greenblatt, D. J.; J. Chromatogr., B: Anal. Technol. Biomed. Life Sci. 2006, 835, 131.
18. Notari, S.; Bocedi, A.; Ippolito, G.; Narciso, P.; Pucillo, L. P.; Tossini, G.; Donnorso, R. P.; Gasparrini, F.; Ascenzi, P.; J. Chromatogr., B: Anal. Technol. Biomed. Life Sci. 2006, 831, 258.
19. Weller, D. R.; Brundage, R. C.; Balfour, H. H.; Vezina, H. E.; J. Chro-matogr., B: Anal. Technol. Biomed. Life Sci. 2007, 848, 369.
20. Sailaja, A. L.; Kumar, K. K.; Kumar, D. V. R. R.; Kumar, C. M.; Yugand-har, N. M.; Srinubabu, G.; Chromatographia 2007, 65, 359.
21. Rebiere, H.; Mazel, B.; Civade, C.; Bonnet, P. A.; J. Chromatogr., B: Anal. Technol. Biomed. Life Sci. 2007, 850, 376.
22. Kwara, A.; Lartey, M.; Sagoe, K. W.; Xexemeku, F.; Kenu, E.; Oliver-Commey, J.; Boima, V.; Sagoe, A.; Boamah, I.; Greenblatt, D. J.; Court, M. H.; J. Clin. Pharmacol. 2008, 48, 1032.
23. Matthews, C. Z.; Woolf, E. J.; Mazenko, R. S.; Haddix-Wiener, H.; Chavez-Eng, C. M.; Constanzer, M. L.; Doss, G. A.; Matuszewski, B. K.; J. Pharm. Biomed. Anal. 2002, 28, 925.
24. D’Avolio, A.; Siccardi, M.; Sciandra, M.; Lorena, B.; Bonora, S.; Trentini, L.; Perri, G. D.; J. Chromatogr., B: Anal. Technol. Biomed. Life Sci. 2007, 859, 234.
25. Volosov, A.; Alexander, C.; Ting, L.; Soldi, S. J.; Clin. Biochem. 2002, 35, 99.
26. Rentsch, K. M.; J. Chromatogr., B: Anal. Technol. Biomed. Life Sci. 2003, 788, 339.
27. Rouzes, A.; Berthoin, K.; Xuereb, F.; Djabarouti, S.; Pellegrin, I.; Coupet, A. C.; Augagneur, S.; Budzinski, H.; Saux, M. C.; Breilh, D.; J. Chromatogr., B: Anal. Technol. Biomed. Life Sci. 2004, 813, 209. 28. Colombo, S.; Beguin, A.; Telenti, A.; Biollaz, J.; Buclin, T.; Rochat, B.;
Decosterd, L. A.; J. Chromatogr., B: Anal. Technol. Biomed. Life Sci. 2005, 819, 259.
29. Heine, R. T.; Rosing, H.; van Gorp, E. C. M.; Mulder, J. W.; van der Steeg, W. A.; Beijnen, J. H.; Huitema, A. D. R.; J. Chromatogr., B: Anal. Technol. Biomed. Life Sci. 2008, 867, 205.
30. Notari, S.; Mancone, C.; Alonzi, T.; Tripodi, M.; Narciso, P.; Ascenzi, P.; J. Chromatogr., B: Anal. Technol. Biomed. Life Sci. 2008, 863, 249. 31. Queiroz, S. C. N.; Collins, C. H.; Jardim, I. C. S. F.; Quim. Nova 2001,
24, 68.
32. Pereira, A. S.; Bicalho, B.; Lilla, S.; De Nucci, G.; Quim. Nova 2005, 28, S107.
33. Xu, R. N.; Fan, L.; Rieser, M. J.; El-Shourbagy, A.; J. Pharm. Biomed. Anal. 2007, 44, 342.
34. Mogatle, S.; Kanfer, I.; J. Pharm. Biomed. Anal. 2009, 49, 1308. 35. Nagaraja, N. V.; Paliwal, J. K.; Gupta, R. C.; J. Pharm. Biomed. Anal.
1999, 20, 433.
36. Singtoroj, T.; Tarning, J.; Annerberg, A.; Ashton, M.; Bergqvist, Y.; Whitea, N. J.; Lindegardh, N.; Day, N. P. J.; J. Pharm. Biomed. Anal. 2006, 41, 219.
37. Porche, D. M.; JANAC 2000, 11, 95.
38. Renew, J. E.; Huang, C. H.; J. Chromatogr., A 2004, 1042, 113. 39. Souverain, S.; Rudaz, S.; Veuthey, J. L.; J. Chromatogr., A 2004, 1058,
61.
40. Alnouti, Y. ; Srinivasan, K. ; Waddell, D. ; Bi, H. ; Kavetskaia, O. ; Gusev, A. I.; J. Chromatogr., A 2005, 1080, 99.
41. Zhang, J.; Gage, E. M.; Ji, Q. C.; El-Shourbagy, T. A.; Rapid Commun. Mass Spectrom. 2007, 21, 2169.
42. Kay, R. G.; Gregory, B.; Grace, P. B.; Pleasance, S.; Rapid Commun. Mass Spectrom. 2007, 21, 2585.
43. Elens, L.; Veriter, S.; Fazio, V. D.; Vanbinst, R.; Boesmans, D.; Wal-lemacq, P.; Haufroid, V.; Clin. Chem. 2009, 55, 170.