Vol. 21, No. 4
December 2000
IN THIS ISSUE...
Health Situation Analysis in the Americas, 1999-2000
This article presents a summary of the health situation and trends in the Americas, supported by basic data provid-ed through PAHO’s Core Health Data and Country Profile Initiatives and diverse national health analyses.
Demographic and Urbanization Trends
During the latter part of the twentieth century, an impor-tant demographic transition occurred in the Region of the Americas. The decline of mortality and fertility rates during the last 30 years, with an impact on population growth and structure, has led demographers to use the term “demographic transition”. In 1950, the population of the Americas was 331 million and in 1999, it was estimated at 823 million, represent-ing nearly 14% of the world’s population. About one-third of that population resides in the United States, while another third can be found in two other countries: Mexico and Brazil. The remaining third is scattered among the 45 countries and territories in the Region.
The demographic transition in the Americas and, in par-ticular, Latin America and the Caribbean, began with a de-cline in infant and child mortality. Between the periods 1980-1986 and 1990-1996, most of the countries halved their mor-tality rates from communicable diseases among children un-der 1 year of age.
The average life expectancy at birth in Latin America in the period 1995-1999 stood at 70 years, the target set by the “Strategy for Health For All by the year 2000” for the end of the century. In the Region, the range is from 54.1 to 79.2 years, a difference of more than 25 years between the re-gion’s two extreme countries. In many countries, the internal sub-national rates vary with larger gaps, reflecting substan-tial differences in the relative and absolute risk of dying pre-maturely.
Between 1950-1955 and 1995-2000, the gap between male and female life expectancy grew from 3.3 to 5.7 years in Latin America, from 2.7 to 5.2 years in the Caribbean, and from 5.7 to 6.6 years in North America. This change in the
popula-tion’s demographic profile has resulted in the aging of the general population with a concomitant increase in chronic and degenerative diseases and disabilities, which affects fe-males more frequently.
The level of population growth resulting from the varied mortality and fertility rates characterizes the demographic transition in the Americas. Four typologies have been used to identify the level of this transition in the corresponding countries.
Group 1. Incipient transition (high birth rate; high mortality; moderate natural growth (2.5%)): Bolivia and Haiti.
Group 2. Moderate transition (high birth rate; moderate mor-tality; high natural growth (3.0%)): El Salvador, Guatemala, Honduras, Nicaragua, and Paraguay.
Group 3. Full transition (moderate birth rate; moderate or low mortality; moderate natural growth (2.0%)): Brazil, Colombia, Costa Rica, Dominican Republic, Ecuador, Guyana, Mexico, Pan-ama, Peru, Suriname, Trinidad and Tobago, and Venezuela. Group 4. Advanced transition (moderate or low birth rate and mortality; low natural growth (1.0%)): Argentina, Bahamas, Barbados, Canada, Chile, Cuba, Jamaica, Martinique, Puerto Rico, United States, and Uruguay.
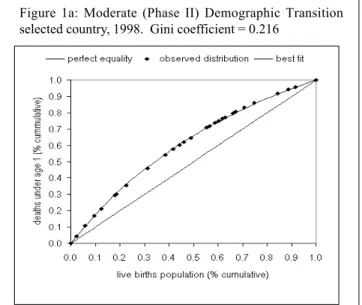
It has become clear that averages do not tell the whole story, therefore measures of distribution of mortality and morbidity indicators are becoming more common. Following is an example of work in this direction that involves the use of Gini coefficients1.
Figures 1a-b present the Gini coefficients for two coun-tries with different levels of demographic transition (moder-ate and advanced transition). The degree of inequality in
Dr. Carlos Castillo-Salgado Chief, Special Program for Health Analysis
Pan American Health Organization
1. The Gini Coefficient is based on the Lorenz curve, a graphic repre-sentation of a variable with its uniform distribution (i.e., situation of equality) in the population. A diagonal line represents this uniform distribution. The greater the distance between the Lorenz curve and the diagonal line, the greater the inequality. The possible values of the Gini Coefficient range from zero to one. The indicator would be equal to zero in conditions of perfect equality.
• Editorial: Health Situation Analysis in the Americas, 1999-2000
• Health Situation Analysis:
• News: Outbreak of Poliomyelitis in the Dominican Republic and
infant mortality, as measured by the corresponding Gini coef-ficient, is more than two times higher in a country that is currently in a moderate demographic transition than one in a full demographic transition. It is also important to note marked differences in the magnitude of health inequalities between Latin American populations that share the same stage of de-mographic transition.
The regional average urban population for the year 2000 is estimated at 76.0%. However, the average is 85.3% for the Southern Cone and 48.3% for Central America. Figure 2 illus-trates the distribution of urban population in some countries
of the Region by geographic sub-national units ranging from 11% to 99%. The growth of urbanization in the Americas has had important health implications in the sense that it has increased the absolute risk of significant social problems, such as violence and accidents.
Health status and epidemiological polarization Most of the health situation analyses of the countries of the Americas have highlighted the remarkable progress made during the twentieth century in postponement of death, and the increasing span of healthy life for some population groups. On the other hand, these analyses also have underscored the large disparities that still exist between the national aver-age expected lifespan vis-a-vis that of the disadvantaver-aged groups. Although major advances have been made in con-trolling infectious and parasitic diseases, these remain im-portant causes of death with rates similar to those for non-communicable diseases.
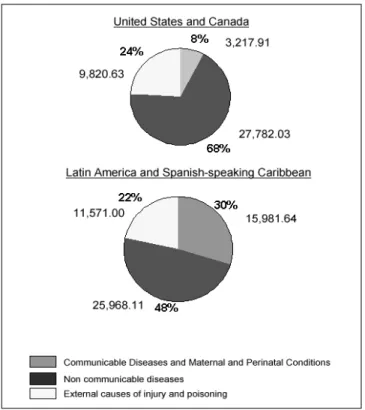
Toward the end of the twentieth century, mortality rates have declined in virtually every country of the Americas. The average life span has increased in Latin America by 18 years in four decades. However, a unique pattern of mortality has emerged in the Region that reflects an epidemiological polarization. This epidemiological polarization is character-ized by a prolonged coexistence of two mortality patterns, one typical of the developed societies (chronic and degener-ative), and the other of poor societal living conditions (infec-tious and parasitic) combined with high mortality from acci-dents and violence. The relative contribution of chronic dis-eases to the mortality pattern is as important as that of com-municable diseases. This polarization is reflected in the struc-ture of causes of death presented in Figure 3. This profile indicates the persistence of large health gaps between differ-ent social groups and areas within countries. Not all popula-tion subgroups have achieved full access to health and ade-quate living conditions that are needed to sustain marked shifts in the causes of death. Increasing gaps in income and
Figure 1: Inequalities in infant mortality Lorenz Curve and Gini Coefficient.
Cumulative distribution of deaths under age 1 among cumulative population of live births ranked by magnitude of infant mortality rate.
Figure 1b: Advanced (Phase IV) Demographic Transition selected country, 1997. Gini coefficient = 0.090
Figure 1a: Moderate (Phase II) Demographic Transition selected country, 1998. Gini coefficient = 0.216
social inequalities still raise concerns because of their effect on the widening of mortality differentials in the Region.
Using national averages, between 1980 and 1999, we observe a decrease in the number of years of potential life lost (YPLL) throughout the Region. While part of this change can be attributed to the aging of the population, the principal cause was the decline in mortality in the first years of life. However, the intensity and speed of this decline was not the same in all the countries or even in different areas of the same country.
Inequalities in the risk of becoming ill and dying prema-turely correlate with inequalities in the distribution of resourc-es. For example, the infant mortality rates vary from country to country and within a given country. In several countries with a relatively high income level, this indicator ranges from 13.4 to 109.8 per 1,000 live births at the subnational level. The inclusion of a subnational disaggregation of information be-comes, then, very important and quite relevant, since as indi-cated previously, national averages of health indicators do not reflect the heterogeneity that exists in the frequency dis-tribution of health indicators within a given country. The observed regional and national inequalities in health are rep-licated with greater intensity at the subnational and local levels.
Non-communicable diseases accounted for 49.7% of the mortality of adult population in the Americas while external causes accounted for 13.8 % of deaths. In the period 1990-1995, 89% of homicide victims were males as reported in a substantial number of countries. This represented a 65%
in-crease over the 1980-1985 level for males; for females, the increase was 30%. In all the subregions, nearly three times as many males as females died from motor vehicle accidents between 1980 and 1996.
Information from different population groups and not only national averages should be used to formulate health policies. In addition, sustained impetus is needed for local disaggregation of information for health analysis. There is pressing need for improving empirical public health informa-tion that facilitates the periodic assessment of the health sit-uation and trend analysis of all population groups and geo-graphic levels and not only the national averages.
PAHO’s response
One of the basic responsibilities of the Organization is to facilitate the collection and dissemination of health infor-mation and there is a long and fruitful history of PAHO’s involvement in this area in the member countries. In 1995 PAHO launched its Regional Core Data/Country profile Ini-tiative which sought to use modern technology to system-atize the collection, analysis and dissemination of essential health data. The availability of geographically disaggregated national data is essential for detecting disparities and direct-ing resources to close those gaps that may be described as inequitable. Under the impulse of this initiative, twenty Min-istries of Health have established systems for collecting, an-alyzing and publishing core data in a fairly uniform format.
It is now important to continue improving the compara-bility, validity, and reliability of health information to identify and quantify the inequalities that disproportionately affect certain segments of societies, while giving recognition to the main factors that determine health inequalities. PAHO is col-laborating with national health authorities, academic institu-tions, and civil society groups to continue refining the meth-odological and operational instruments for subnational and local health assessments, as well as for the selection of ap-propriate and useful indicators and indices. Emphasis is be-ing placed on useful, practical basic instruments and indices that can be applied and generated at the national level.
The Organization is committed to working toward the consolidation of health information systems and communi-cation platforms in the member countries. This strategy will help to document the impact of health interventions on re-ducing the health disparities that are so much a feature of the health landscape of this Region.
This document was presented during the Pan American Health Organization’s 42nd Directing Council (52nd Session of the Regional Committee). Document No. CD42/6 (Eng.)
Dengue in Central America: The Epidemics of 2000
Introduction
Prior to 1981, dengue and its more severe form, dengue hemorrhagic fever (DHF), were considered to be a public health problem of Asia and posed little or no threat to the Region of the Americas. This scenario changed suddenly as a result of the Cuban epidemic of 1981, the first major DHF epidemic in the Americas. For the following 10 years, spo-radic cases of dengue and DHF were observed. Then in 1990, Venezuela experienced the second major epidemic in the Region. These events clearly marked dengue and DHF as an emerging disease in the Americas.
The epidemiologic pattern of the disease has evolved in the Americas in a similar way as it did in Asia several de-cades ago. Expanded distribution and increased infestations
of Aedes aegypti occurred during and after World War II in
Asia as it did in the Americas after the failure of the Ae.
aegypti eradication initiative (1). In both of these regions,
expanded distribution of the vector was followed by increased transmission of multiple dengue virus serotypes, resulting in hyperendemicity in many countries. In every country in Southeast Asia where epidemic DHF became a major public health problem, the disease first appeared sporadically for several years, ultimately culminating in major epidemics. Most of those countries subsequently developed a continuing cycle of dengue and DHF epidemics at three to five year intervals, with epidemics becoming progressively more se-vere. Some countries of Central America are experiencing similar continued cycles of epidemics.
During the summer of 2000, Costa Rica, El Salvador, Gua-temala, and Nicaragua underwent outbreaks of dengue fever that also included cases of DHF and deaths. The deteriora-tion of the control programs, associated with climatic condi-tions, prolonged and intensified the effects of the disease.
Costa Rica
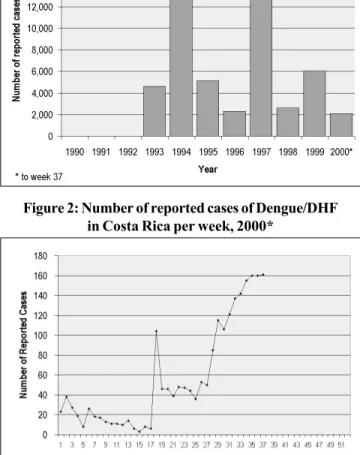
Costa Rica was one of the last two countries in the Re-gion to report cases of dengue. After about 30 years of being free of Ae. aegypti, Costa Rica became reinfested in 1988. Five years later, in 1993, the country reported 4,612 cases of dengue fever. In 1994, the number of cases rose to 13,929 and then decreased over the next two years, until 1997, when 14,267 cases were reported. The first manifestation of DHF occurred in 1995 in the Chorotega Region and in the follow-ing year, the first two deaths from DHF were registered. In 1997, an epidemic recorded 14,267 cases, the largest for Costa Rica in a single year. In the following three years, the num-bers of reported cases decreased (2). The cycles of reported dengue cases can be appreciated in Figure 1.
Data presented in Figure 2 are numbers of dengue and DHF cases reported by epidemiological week of 2000. Throughout the first 17 weeks, there were few cases, but a sudden surge and drop followed in weeks 18 and 19, with 104 and 46 cases respectively. After this decline, a steady and sharp increase was observed starting on week 27 until week 37. Up to week 37, there were a total of 2,113 reported cases and an incidence rate of 52.52 cases per 100,000 population.
The serotype responsible for the first epidemic of 1993 was identified to be DEN-1, which was also associated with outbreaks in subsequent years. In 1994, all serotypes were detected in several regions of the country. Coincidentally, more case fatalities occurred the following year. From 1995 to 1998, DEN-1 and 3 were circulating simultaneously. For 1999 and 2000, the identity of the circulating serotypes was not reported.
Figure 1: Number of reported cases of Dengue/DHF in Costa Rica per year, 1990-2000*
Y ear D E N -1 D E N -2 D E N -3 D E N -4
1 9 9 3 x
1 9 9 4 x x x x
1 9 9 5 x x
1 9 9 6 x x
1 9 9 7 x x
1 9 9 8 x x
1 9 9 9 2 0 0 0
Table 1: Dengue serotypes circulating in Costa Rica, 1993-2000
El Salvador
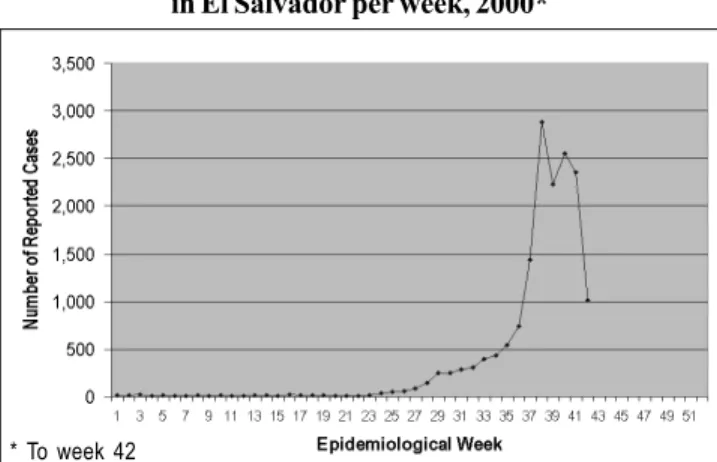
There were no registered cases of dengue in El Salvador until 1980, when the first epidemic occurred with 2,060 cases. During the following 10 years, cycles of increasing and de-creasing number of reported cases occurred. In 1993 and 1995, there were 9,015 and 9,658 reported cases, respectively, the highest numbers of cases ever registered in El Salvador at the time (2). The data presented in Figure 3 shows that the number of cases in 2000 surpassed the 1993 and 1995 data. This is the largest epidemic ever registered in El Salvador’s history.
For 2000, the number of reported cases of dengue and DHF were low until weeks 29 through 36. During this time, a gradual increase was observed. By week 37, there were 1,438 cases, almost double the number of cases in week 36. The highest number of cases recorded was of 2,882 in week 38. Data presented in Figure 4 shows a sharp decrease by week 42 with 1,012 cases. Up to week 42, a total of 16,355 cases of dengue and DHF were reported, with 31 deaths of 336 con-firmed cases of DHF. A case fatality rate of 9.22% for DHF and an incidence rate of 260.60 cases per 100,000 population for combined dengue and DHF were calculated.
As this epidemic progressed, there was a shift in the rates of cases per department. Initially, the department of Sonsonate had the highest rate, but by the end the depart-ment of San Salvador resulted in having the highest rate of 291 cases per 100,000 inhabitants, followed by Cabañas (231 per 100,000), La Libertad (179 per 100,000), Chalatenango (137 per 100,000) and Sonsonate (135 per 100,000).
Virus isolation studies show that serotypes DEN-1, 2 and 4 were co-circulating in the 1980’s. Data presented in Table 2 shows serotype circulation per year from 1990 to 2000. Throughout most of these years, two serotypes or more were found to circulate simultaneously. Serotype 3 was iso-lated for the first time in 1991 and was detected later in 1995 and 1998. The only serotype isolated during the 2000 epi-demic was DEN-2.
Figure 4: Number of reported cases of Dengue/DHF in El Salvador per week, 2000*
Y ear D E N -1 D E N -2 D E N -3 D E N -4
1 99 0 x
1 99 1 x x
1 99 2 x x
1 99 3 x x
1 99 4 x x
1 99 5 x x x x
1 99 6 1 99 7
1 99 8 x
1 99 9 x
2 00 0 x
Figure 3: Number of reported cases of Dengue/DHF in El Salvador per year, 1990-2000*
Guatemala
From 1948-1959 efforts were made to eradicate Ae. aegypti in compliance with the recommendations of the Pan Ameri-can Health Organization. Guatemala was certified as free of
Ae. Aegypti at the XI Meeting of the WHO Directors Council
in 1959 (1).
However, by 1967, the Ae. aegypti larvae was discov-ered in the city of Escuintla. Five years later, in 1972, Ae.
aegypti was found again in Escuintla and in Taxisco. With a
combination of economic limitations, ecological factors, and rapid expansion, this species gradually re-infested other com-munities until the first dengue epidemic occurred in Escuintla in August of 1978 (1). Unfortunately, it took four months to control this epidemic. Subsequently, actions were taken to control and reduce the Ae. aegypti re-infestations but these efforts were not sufficient. In 1987, a new outbreak of dengue occurred and since then, the disease has spread to all areas infested by the vector. The appearance of dengue forced control schemes to change their approach, which had previ-ously been oriented to avoid reintroduction of yellow fever, to a program based on source reduction and focal treatment with larvicides. Unfortunately, the program focused solely on infested areas, allowing the vector to spread and infest other free areas. In 1991, the re-evaluation of the vector con-trol program made it necessary to reassume measures similar to those of a pre-control attack program.
Table 2: Dengue serotypes circulating in El Salvador, 1990-2000
In the early 1980s there were few cases of dengue re-ported each year. The first major outbreak occurred in 1987 with 2,318 cases. The serotype isolated from patients during this outbreak was DEN-1. In 1991, the number of cases of dengue and DHF peaked to 10,968. A sharp decrease in the number of reported cases was observed in 1992 with only 1,286 cases but in the following years the number of cases increased gradually (2). This trend can be seen in Figure 5.
Honduras
Like Guatemala, Honduras participated in the Dengue eradication programs of the 1950’s. Ae. aegypti reinfestation occurred in 1968 in Honduras. By 1978, this country under-went its first major dengue epidemic of the DEN-1 serotype. Since then, dengue has become well established in most parts of the country. Throughout the 1980s, Honduras reported few cases, averaging 1,000 cases per year. As seen in Figure 7, the number of cases increased from 1,700 in 1990 to 27,560 cases in 1995 (2). Following this year, the number of reported cases has been consistently lower than 1995, but in compari-son to the number of cases in the 1980s, it is about seven times greater.
Figure 5: Number of reported cases of Dengue/DHF in Guatemala per year, 1990-2000*
Y ear D E N -1 D E N -2 D E N -3 D E N -4 1 9 9 0 x
1 9 9 1 x x x
1 9 9 2 x x x
1 9 9 3 x
1 9 9 4 x x
1 9 9 5 x x x x
1 9 9 6 x x x x
1 9 9 7 x x x x
1 9 9 8 x x
1 9 9 9 x x x x
2 0 0 0 x
Table 3: Dengue serotypes circulating in Guatemala, 1990-2000
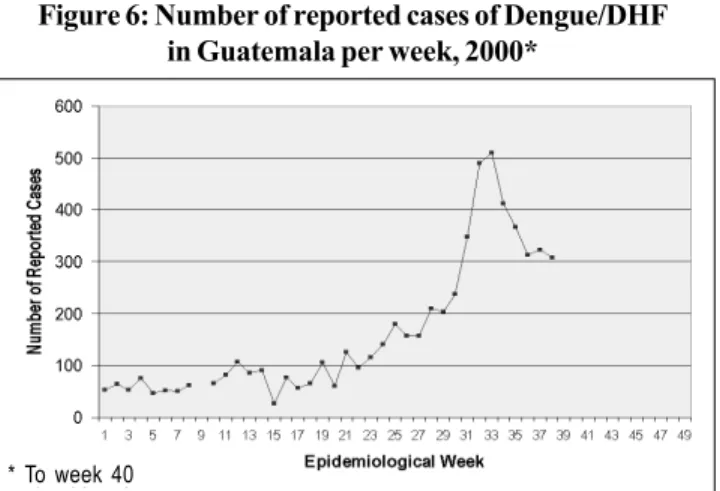
Guatemala’s dengue situation for 2000 is that 5,963 cases were reported up to epidemiological week 40, an 85% increase from the number of cases reported the previous year during the same period. During 2000, there have been 18 confirmed cases of DHF with six deaths, a case fatality rate of 33%. An incidence rate of 52.38 cases per 100,000 population has been observed to week 40. As can be seen in Figure 6, a steady increase in the number of cases starting in week 25 is ob-served with a peak of 519 cases in week 35. The most affected departments are Zacapa, Santa Rosa, Escuintla and El Progreso. During 2000, only the DEN-2 serotype has been isolated.
Prior to the 1990s, DEN-1 was the only serotype found circulating except in 1988 when serotypes 1, 2, and 4 were isolated. In Table 3, it can be appreciated that several sero-types have been found circulating in Guatemala simulta-neously during seven of the past ten years.
Figure 6: Number of reported cases of Dengue/DHF in Guatemala per week, 2000*
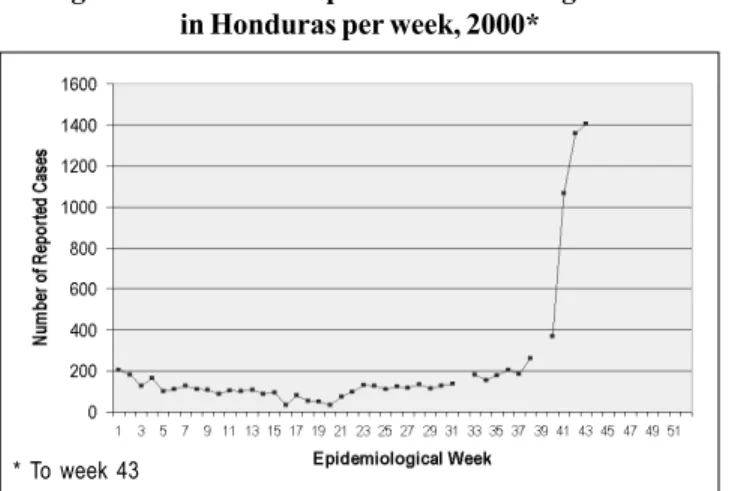
During 2000, dengue activity in Honduras was not as prominent as it had been in previous years. Up to week 43 of 2000, the number of reported cases was lower than cases for the 1997-1999 period. A graph of the number of reported cases for 2000 by epidemiological week is presented in Fig-ure 8. From week 22 to 40, the number of reported cases increased slightly from 90 cases to 370, respectively. How-ever, suddenly, 1,065 cases were reported in week 41, a three-fold increase compared to the previous week. Following week 41 to 43, this upward trend continued. For 2000 up to week 43 there were 8,715 cases reported with an incidence rate of 134.39 cases per 100,000 population.
* To week 40
* To week 40* To week 40
* To week 43
A national emergency was declared by the Honduran government due to the sudden increase in reported cases. According to the Ministry of Health of Honduras, almost all departments have reported a sharp increase in the cases after week 37. Departments with the highest number of cases are Tegucigalpa, Juticalpa, Comayagua with 2,369, 1,245 and 1,189 cases of dengue, respectively. The serotype respon-sible for this rise in the number of cases was found to be DEN-2.
Virus isolation studies show that serotype DEN-1 was responsible for the first outbreak of 1978. In the early 1980’s, serotypes 2 and 4 were isolated on different years and were found co-circulating with DEN-1 by the end of the decade. Table 4 shows this trend until 1995, when serotype 3 was first detected. Since then, DEN-3 has been isolated and has circu-lated simultaneously with DEN 2 in 1998 and 1999.
this decade. Following the 1994 and 1995 epidemics, Nicara-gua reported relatively low numbers of cases in 1996 and 1997. However, the cases continued to increase and decrease in the following years.
Y ear D E N -1 D E N -2 D E N -3 D E N -4
1 9 9 0 x x x
1 9 9 1 x x x
1 9 9 2 x x x
1 9 9 3 x x x
1 9 9 4 x x x
1 9 9 5 x x x x
1 9 9 6 x
1 9 9 7 x
1 9 9 8 x x
1 9 9 9 x x
2 0 0 0 x
Table 4: Dengue serotypes circulating in Honduras, 1990-2000
Figure 8: Number of reported cases of Dengue/DHF in Honduras per week, 2000*
Figure 9: Number of reported cases of Dengue/DHF in Nicaragua per year, 1990-2000*
Figure 10 presents the number of reported cases of den-gue and DHF for 2000 by epidemiological week. The number of cases increases steadily after week 21 and peaks at week 26 with 289 cases. Throughout the following weeks, the num-ber of reported cases fluctuated but compared to week 26, a decrease in the number of cases can be observed. Up to week 42, 5,233 cases were reported with an incidence rate of 102.94 cases per 100,000 population.
Serotypes responsible for Nicaragua’s first epidemic of 1985 were identified as DEN-1 and 2. Table 5 presents sero-types circulating in Nicaragua during the 1990s and 2000. For most of the years subsequent to 1993, two or three serotypes were found co-circulating. In addition, DEN-3 was first iso-lated in the 1994 and 1995 epidemics. For 2000, serological testing has isolated serotypes DEN-2 and 3.
Nicaragua
Nicaragua’s first major dengue outbreak occurred in 1985 with 17,483 reported cases. This epidemic was associated with severe symptoms and a few fatal cases of DHF. During the following years, there were relatively low numbers of re-ported cases. By the end of 1994 and 1995, 20,469 and 19,260 cases were registered, respectively (2). Figure 9 shows an increase and decrease in the number of cases throughout
* To week 41 * To week 43
* To week 41
Panama
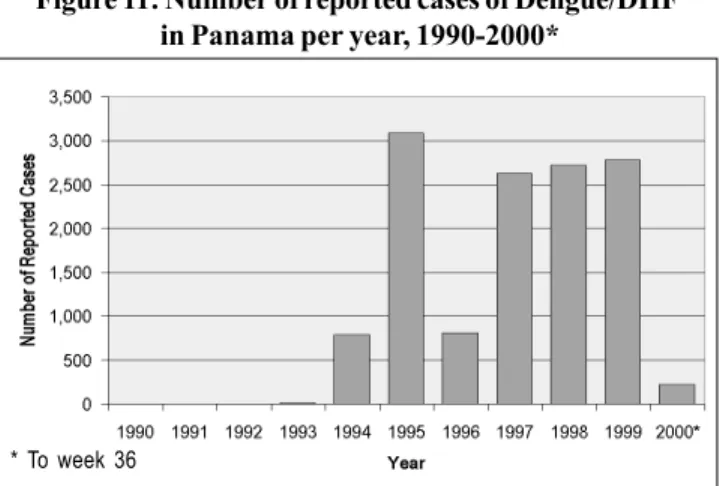
Efforts towards eradication of the vector was undertaken in 1949 in Panama. In 1958, this country was certified as being free of Ae. aegypti. However, reinfestation occurred in Panama in 1985. Eight years later, in 1993, the first case of autochtho-nous dengue fever was confirmed since the last dengue epi-demic of 1942. By the end of 1993, 14 cases of dengue fever were confirmed and DEN–2 was isolated. Figure 11 depicts the rise in incidence of dengue cases in Panama from 1990-2000.
Y ear D E N -1 D E N -2 D E N -3 D E N -4
1 9 9 3 x
1 9 9 4 x x x x
1 9 9 5 x x
1 9 9 6 x
1 9 9 7 x
1 9 9 8 x x
1 9 9 9 x x x x
2 0 0 0
Table 6: Dengue serotypes circulating in Panama, 1990-2000 Figure 11: Number of reported cases of Dengue/DHF
in Panama per year, 1990-2000*
Figure 12: Number of reported cases of Dengue/DHF in Panama per week, 2000*
Y ear D E N -1 D E N -2 D E N -3 D E N -4
1 9 9 0 x
1 9 9 1 1 9 9 2
1 9 9 3 x
1 9 9 4 x x
1 9 9 5 x x x
1 9 9 6 1 9 9 7
1 9 9 8 x x
1 9 9 9 x x x
2 0 0 0 x x
Table 5: Dengue serotypes circulating in Nicaragua, 1990-2000
Although the largest outbreak occurred in 1995, with 3,083 cases, the number of cases did not decrease by much during the period of 1997 through 1999 (2). In comparison to most Central American countries, Panama has not experienced a major epidemic.
Panama is the only country that has detected autoch-thonous cases of dengue fever in the absence of a major epidemic. After the re-appearance of dengue in this country, appropriate control measures have been taken. This is prima-rily due to its active surveillance program, which has been maintained since September of 1988.
Although Panama did not experience an epidemic during the summer of 2000 as did some of the countries in Central America, there was an increase in the number of cases during
the first few weeks of 2000, followed by a rapid decrease until week 10. Few cases were reported in the following weeks. Up to week 36, there was a total of 220 cases, including one case of DHF. Panama’s incidence rate for 2000 is 7.70 cases per 100,000 population. A graphical representation is found in Figure 12.
The circulation of the different serotypes from 1993 to 2000 in Panama is depicted in Table 6. Virus isolation studies in Panama show that DEN-1 serotype was detected for five years and has circulated with other serotypes. In 1994 and 1999, all four serotypes were isolated. For 2000, the identifi-cation of serotype has currently not been reported.
R e f e r e n c e s :
(1) Halstead, S., Gomez-Dantes, H.: Dengue: A Worldwide Problem, a Common Strategy
(2) Gratz, N., Knudsen, B.: The Rise and Spread of Dengue, Dengue haemorrhagic Fever and Its Vectors: A Historical Review, World Health Organization, CTD/ FIL(DEN) 96.7
* To week 36
Source: PAHO. Division of Disease Prevention and Control.
West Nile Fever is a disease caused by the West Nile (WN) virus, a flavivirus belonging taxonomically to the Japa-nese Encephalitis serocomplex. It is a vector-borne disease that is transmitted to a wide range of vertebrates by infected mosquitoes. Because of spatial and temporal proximity of avi-an avi-and humavi-an infections, epidemiologists have concluded that transmission follows an enzootic cycle. Birds act as nat-ural reservoir hosts infecting mosquitoes, which in turn infect vertebrates (1).
In humans, the WN virus usually produces either asymp-tomatic infection or mild febrile illness. Symptoms of infection include fever, headache, and body aches, occasionally with skin rash and swollen lymph glands. More severe infection may be marked by headache, high fever, neck stiffness, stu-por, disorientation, coma, tremors, convulsions, muscle weak-ness, paralysis and rarely death (2). Meningoencephalitis is an occasional complication of this disease. Case definitions of probable and confirmed cases have been developed by the United States Centers of Disease Control and Prevention (CDC) (Table 1).
The WN virus was first isolated from an adult woman in the West Nile District of Uganda in 1937. The first recorded epidemics of West Nile fever occurred in Israel during the 1950’s. During this time, the virus became recognized as a cause of severe human meningoencephalitis. Subsequently, its presence was noted in Egypt, Israel, India and areas of Africa. In 1974, the largest known epidemic caused by WN virus occurred in South Africa. Recent outbreaks of WN viral encephalitis in humans have occurred in Algeria in 1994, Ro-mania in 1996-1997, the Czech Republic in 1997, the Democrat-ic RepublDemocrat-ic of the Congo in 1998, Russia in 1999, the United States in 1999-2000 and Israel in 2000 (2) (Figure 1).
In the Americas, the first recorded epidemic of WN viral encephalitis occurred in the New York metropolitan area dur-ing the late summer of 1999. A total of 62 cases of neurological disease and 7 deaths were reported. In addition to humans, concurrent epizootics occurred in birds and horses especially affecting the American crow (3). During this epidemic/epi-zootic, the virus was detected in 4 states, Connecticut, Mary-land, New Jersey and New York. In 2000, there were 18 cases with 1 death and epizootic activity in birds and/or mosquitoes was recorded in 12 states (Connecticut, Delaware, Maryland, Massachusetts, New Hampshire, New Jersey, New York, North Carolina, Pennsylvania, Rhode Island, Vermont, Virginia) and the District of Columbia (4).
It has not been determined how WN virus was intro-duced into the Western hemisphere. However, migratory birds are suspected as being principal introductory hosts for sever-al reasons (1): outbreaks of the virus in temperate regions generally occur during late summer or early fall, coinciding with the arrivals of large concentrations of migratory birds; outbreaks often occur among humans living near wetlands
West Nile Virus in the Americas
where high concentrations of birds come into contact with large numbers of mosquitoes; and antibodies to the virus have been found in the blood of many migratory bird species of temperate regions. In addition to migratory birds, internation-al travel of infected persons to New York, importation of in-fected birds or mosquitoes are other possible sources of WN virus introduction.
As a result of the 1999 outbreak, U.S. public health offi-cials questioned the preparedness of the public health infra-structure to respond to vector-borne diseases and recognized the ease with which emerging infectious pathogens can move into new geographic areas. Furthermore, public health agen-cies did not know how far the virus would spread and if it would sustain during the winter season (5). To address these issues, guidelines for an active surveillance system and pre-vention and control programs were established by the CDC and U.S. Department of Agriculture (USDA) (3).
An enhanced surveillance system is a priority for states along the Atlantic Ocean and Gulf of Mexico. These states, from Massachusetts to Texas, were selected to participate in WN virus surveillance on the basis of having been affected by the 1999 outbreak and/or having high potential to become affected because of bird migration patterns to the south. A major objective of WN virus surveillance is to detect epizoot-ic activity early so that intervention can occur before severe human illnesses (4). From the 1999 outbreak epidemiological findings, WN virus-infected birds were identified before hu-man cases in their same county of residence suggesting that avian surveillance data are sensitive indicators of epizootic transmission and may predict human illness. The emphases on surveillance activities included: the monitoring of
arbovi-Figure 1: Geographic distribution of the Japonese Encephalitis Serocomplex of the Family Flaviviridae, 2000
St. Louis Encephalitis Rocio and St. Louis (Brazil) West Nile Virus Japanese encephalitis
rus activity in wild birds, sentinel birds, and dead crows; sur-veillance of mosquito populations to detect WN virus and other arbovirus activity; passive surveillance for the pres-ence of WN virus outside of the bird-mosquito cycles, as in horses and other animals; and passive surveillance for cases of viral encephalitis (3).
The success of the surveillance activities in the U.S. has depended on the availability of laboratories that can provide diagnostic support. The immunoglobulin M and G enzyme-linked immunosorbent assays (ELISA) are available in public health and veterinary laboratories to provide the first-line test-ing for human and animal serum and cerebrospinal fluid spec-imens. Selected public health and reference laboratories have the capabilities to isolate and identify the virus, perform neu-tralization tests to identify specific flavivirus antibody, and perform immunohistochemistry to detect WN virus in autop-sy tissues. All laboratory investigations handling the virus is conducted under bio-safety level 3 containment.
The most effective method to prevent transmission of WN virus or other arboviruses to humans is to reduce human exposure to mosquitoes. Public health services should have capabilities to control mosquito populations by larval con-trol; control of adult mosquito populations by aerial applica-tion of insecticides; and educating the public about vector-borne diseases, how they are transmitted and how to prevent or reduce risk of exposure.
Because WN virus is a zoonosis affecting mosquitoes and vertebrates, a close coordination and data exchange be-tween federal, state and local public health, vector control, agriculture and wildlife departments is essential for the suc-cess of addressing this vector-borne disease. A functional arbovirus surveillance and response capability with an ade-quately equipped reference laboratory with trained staff and veterinary/entomology health capacity is required (3).
The decrease in the number of cases of severe human illness from 1999 (62 cases) to 2000 (18 cases) in the U.S. may be attributed to prevention and control measures taken by state and local public health departments. However, previous experience in Europe has shown that incidence of human ill-ness can be variable and outbreaks sporadic. In spite of a decrease in cases, WN virus activity has continued to expand to new locations and will persist. Research of migratory bird patterns shows that “members of one or more avian species that pass through New York and gather in wetlands in large, dense groups potentially reach every part of the southeast-ern United States, Mexico and Central America, the Caribbean Islands, and South America during their migration south to wintering sites and nearly every part of North America during their migration north to breeding sites” (1) (6) (7). As noted by Blaskovic and Ernek (8), “the role of birds in ecology of arboviruses depends upon whether the migrating vector finds favourable conditions in the new environment and whether
Confirmed Case Probable Case Non-Case
A confirmed case of WN encephalitis is defined as a febrile illness associated with neurologic manifestations ranging from headache to aseptic meningitis or enceph-alitis, plus at least one of the following:
• Isolation of WNV from or demon-stration of WN viral antigen or ge-nomic sequences in, tissue, blood, CSF, or other body fluid;
• Demonstration of IgM antibody to WN virus in CSF by IgM-capture EIA.
• A > 4-fold serial change in plaque-reduction neutralizing (PRNT) anti-body titer to WN virus in paired, ap-propriately timed serum or CSF sam-ples
• Demonstration of both WN virus-specific IgM (by EIA) and IgG (screened by EIA or HI and con-firmed by PRNT) antibody in a sin-gle serum specimen.
A probable case is defined as a compat-ible illness (as confirmed case) that does not meet any of the above laboratory criteria, plus at least one of the follow-ing:
• Demonstration of serum IgM anti-body against WN virus (by EIA); • Demonstration of an elevated titer
of WN virus-specific IgG antibody in convalescent-phase serum (screened by EIA or HI and con-firmed by PRNT).
A non-case is defined as an illness that doe not meet any of the above laborato-ry criteria, plus:
• A negative test for IgM antibody to WNV (by EIA) in serum or CSF col-lected 8-21 days after onset of ill-ness;
and/or
• A negative test for IgG antibody to WNV (by EIA, HI, or PRNT) in se-rum collected > 22 days after onset of illness.
Note: Although tests of tissues or fluids by PCR, antigen detection, or virus isolation can be used to confirm WN encephalitis cases, they cannot be used to rule-out cases because the negative predictive values of these test methods in this disease are unknown.
Despite the availability of an effective vaccine, measles continues to be one of the leading causes of childhood mor-bidity and mortality in many regions of the world, represent-ing 30% of the estimated 3 million deaths due to vaccine-preventable diseases in the world every year. In the Region of the Americas, the interruption of measles virus transmis-sion was set as a target for the year 2000 by the ministers of health at the XXIV meeting of the Pan American Sanitary Con-ference in 1994. While several different genotypes of wild measles virus are circulating worldwide, virologic surveillance conducted since 1997 has suggested that only the D6 geno-type is circulating in the Americas, indicating continued en-demic circulation. As summarized below, most countries have already achieved the goal of interrupting indigenous measles transmission, which represents great progress in the fight against the disease.
In 1990, during the last major epidemic in the Region, 250,000 cases of measles were reported. In 1996, an all-time low of 2,109 confirmed cases were reported in the Region. Nevertheless, there was a resurgence in 1997, with 52,284 con-firmed cases reported from Brazil. The epidemic continued throughout 1998, with 14,332 confirmed cases reported from 17 (35%) of the 48 countries in the Region, 71% of which from Argentina. Over the past two years, there has been no report-ed measles case in all of Central America and Cuba, in most of the Caribbean and in the majority of South American coun-tries. In 1999, the 3,091 confirmed cases were reported from 11 countries, a reduction of 78% compared to 1998 and 94% com-pared to 1997. Ongoing endemic transmission occurred only in 4 countries - Bolivia (1,441 cases), Brazil (797 cases),
Ar-Interrupting Measles Transmission in the Americas
gentina (313 cases) and the Dominican Republic (274 cases). Also during 1999, Canada, Chile, Costa Rica, Mexico, Peru, Uruguay and the United States reported measles importations, but the spread was limited by the high vaccination coverage.
As of 28 October 2000, only 1,148 confirmed measles cas-es were reported in the Region, and the disease was affecting only 30 (<1%) of the approximately 12,000 municipalities in the Region. Countries with high measles vaccination cover-age presenting imported measles cases, such as Canada (194 cases as of 28 October 2000), the United States (71), Peru (1) and Costa Rica (1), have also succeeded in keeping measles transmission at low levels. Other countries that reported cas-es include Argentina, Brazil, Bolivia, the Dominican Republic and Haiti (see box 1).
The case of the Dominican Republic and Haiti is of spe-cial concern, as endemic transmission continues in spite of nationwide vaccination campaigns, mainly because measles coverage in the campaigns did not reach 95%, leaving pock-ets of susceptible populations. Reasons for the lack of cover-age included deficient supervision and monitoring of house-to-house vaccination, delayed case investigations that pre-vented rapid assessment of the situation in areas with poor coverage and severe logistical obstacles. These outbreaks highlight the difficulty of stopping the spread of measles in areas with low vaccination coverage. Maintaining a high lev-el of vaccine-induced immunity is the most effective approach for the control of measles. In this regard, PAHO’s recommen-dations include the appropriate and timely implementation of the following strategies to achieve, maintain, and monitor the interruption of endemic measles transmission in the region:
References:
(1) Gubler, D.. Surveillance for West Nile Virus in the Americas, PAHO/WHO, Third Meeting of the Surveillance Networks for Emerging Infectious Diseases in the Amazon and Southern Cone Regions, 2000.
(2) Centers for Disease Control and Prevention. West Nile Virus, Division of Vector-Borne Infectious Diseases, 2000.
(3) Centers for Disease Control and Prevention. Epidemic/Epizootic West Nile Virus in the United States: Guidelines for Surveillance, Prevention and Control, 1999.
Source: PAHO. Division of Disease Prevention and Control.
Communicable Diseases Program (HCP/HCT) the local vectors are capable of transmitting the appropriate
virus. The presence of arbovirus antibody in migratory birds indicates only a virus-host interaction but does not explain when and where the infection occurred.” For these reasons, surveillance (mainly of dead birds), prevention activities and mosquito control need to be well established and maintained. Additionally, future research should define criteria for pre-dicting where the virus will go next (1).
(4) Centers for Disease Control and Prevention. Update: West Nile Virus Activity -Eastern united States, 2000. Morbidity Mortality Weekly Report, 2000; 49; 1044-1047.
(5) Centers for Disease Control and Prevention. Guidelines for Surveillance, Prevention, and Control of West Nile Virus Infection – United States, Morbidity Mortality Weekly Report, 2000; 49;25-8.
(6) Bull J. Birds of New York State. Garden City (NY): Doubleday; 1974.
(7) Rappole, J., Derrickson, S., Hubalek, Z., Migratory Birds and Spread of West Nile Virus in the Western Hemisphere. Emerging Infectious Diseases, 2000; 6:319-327.
(8) Blaskovic D., Ernek E. Birds as hosts of arboviruses in connection of migratory birds and their role in the distribution of arboviruses. Novosibirsk, Russia: Nauka; 1972. p. 161-7.
1) Obtaining >95% routine coverage with measles-contain-ing vaccine in all municipalities. Countries should vali-date coverage regularly through house-to-house moni-toring and/or comparing the number of measles vaccine doses administered to the number of first doses of DTP or the number of doses of Bacille Calmette-Guerin vac-cine;
2) Performing follow-up campaigns at least every 4 years
and achieving >95% vaccination coverage in all munici-palities. Supervisors should verify the vaccination cov-erage daily during the campaign through house-to-house monitoring;
3) Vaccinating and monitoring coverage among groups at
high risk for acquiring or transmitting the disease (i.e., health-care workers, migrant workers, groups philosoph-ically opposed to vaccination, military recruits, and other young adults of rural origin);
4) Conducting reliable, routine surveillance for disease and actively validating data by looking for disease during all house-to-house vaccinations, regular visits to schools and health-care centers by each district’s supervisor, in-cluding monthly visits to high-risk areas (those where coverage is low, that do not submit weekly reports, with limited access to health services, where tourism or immi-gration are high, or that have had cases during the pre-ceding weeks); and
5) Investigating all outbreaks, including a) conducting
household visits within 48 hours of identifying a sus-pected case and investigating all contacts and settings where case-patients were during both their exposure pe-riods (7—18 days preceding rash onset) and their infec-tious periods (from the first respiratory symptoms until 4 days after rash onset); b) collecting blood and either throat or nasopharyngeal swabs or urine specimens at the first contact with the suspected case-patients, sending them to the country’s measles reference laboratory within 5 days of taking them and analyzing the serum specimen, and reporting results within 4 days after the laboratory received the specimen; c) identifying the epidemiological links of confirmed cases and evaluating the risk factors involved in every outbreak; and d) verifying the absence of measles exportations/importations between countries within the region, including determining the viral geno-types to identify endemic or imported viruses.
Overall, the countries of the Region of the Americas have made important progress in interrupting measles transmission, by dedicating their efforts to both vaccination and intensified disease surveillance. These efforts to significantly reduce the burden of measles were recently recognized by the Technical
Source: PAHO. Division of Vaccines and Immunization (HVP)
Box 1: Measles cases in the Americas, 2000
Argentina: In 1997, the São Paulo (Brazil) measles epidemic spread to Argentina, causing 10,663 confirmed cases between 1997-1999. From 1 January through 28 October 2000, 6 con-firmed cases were reported, a 98% decrease compared to 1999.
Brazil: Following the 1997 epidemic, when 52,284 cases were reported, a national follow-up campaign was conducted. In 1998, 2,781 confirmed measles cases were reported, but in 1999 the number fell to 797. From 1 January to 28 October, 35 (1%) cases have been confirmed among 6,661 suspected cases investigated.
Bolivia: In 1999, 1441 confirmed measles cases were reported, an increase from the 1004 cases reported in 1998. A follow-up vaccination campaign was carried out during November and De-cember 1999, with reported national coverage of 98%. Neverthe-less, outbreaks continued during 2000, and house-to-house mon-itoring indicated that many areas had not achieved 95% coverage during the 1999 campaign. From 1 July through 28 October, only 121 cases were confirmed. A tightly supervised and monitored house-to-house campaign is ongoing. The last confirmed case for 2000 occurred during the week ending October 7, 2000.
Dominican Republic: Measles transmission was reestablished in the Dominican Republic in 1998 and has continued to spread, despite several attempted follow-up vaccination campaigns. In 1999, 274 confirmed cases were reported. From 1 January to 28 October, 200 confirmed cases (17% of the region’s total) were reported.
Haiti: No confirmed cases were reported in 1999. In 2000, an outbreak began in Artibonite and through 28 October, 469 con-firmed cases (41% of the Region’s total) have been reported. In June 2000, house-to-house vaccination of all children aged be-tween 6 months and 15 years began, and is ongoing. Lack of sufficient supervisors, untimely identification of areas where vac-cination had not been thorough, the interruption of financial res-sources at the local level and political unrest have made the cam-paign particularly challenging.
Advisory Group on Vaccine Preventable Diseases (TAG) of the Pan American Health Organization (PAHO) during its XIVth Meeting at Foz do Iguaçu, Paraná, Brazil, on 2-5 Octo-ber 2000.
Rationale for Surveillance
Although cases of syphilis decreased dramatically after the introduction of penicillin treatment in 1946, syphilis reemerged in the end of the sixties and has remained at high incidence levels in developing countries. Developed countries are now also experiencing outbreaks and countries in economic transi-tion are experiencing a marked and widespread recrudescence. Syphilis prevalence data in pregnant women provide in-formation about both latent and symptomatic syphilis in this group, and minimize the problems associated with general reporting of sexually transmitted syndromes (STD), which are subject to variations in health care seeking behavior. Thus, it can be considered an approximation of syphilis prevalence in the general population.
This information should be used for policy formulation, planning and evaluation of STD control.
Case Definitions
Syphilis
Recommended case definitions
Clinical description: the signs and symptoms of syphilis are multiple. The primary stage usually, but not necessarily, involves ulceration of the external genital organs and local lymphadenopathy; secondary and tertiary syphilis show mainly dermatological and systemic manifestations. For sur-veillance purposes, only confirmed cases (see below) will be considered.
Confirmed case: a person with a confirmed positive serolo-gy for syphilis (Rapid Plasma Reagin (RPR) or VDRL
con-firmed by TPHA (Treponema pallidum haemagglutination
antibodies) or FTA (fluorescent treponemal antibody-absorp-tion).
Case classification:
Congenital syphilis: an infant with a positive serology, wheth-er or not the mothwheth-er had a positive swheth-erology during the preg-nancy.
Acquired syphilis: all others. The Ministries of Health of the Dominican Republic and
Haiti, with the assistance of the Pan American Health Organi-zation (PAHO) and the United States’ Centers for Disease Control and Prevention (CDC), are investigating an outbreak of poliomyelitis on the island of Hispaniola, which is shared by both countries.
Between 12 July and 18 November, 2000, 19 persons with acute flaccid paralysis (AFP) were identified in the Domini-can Republic, including six laboratory-confirmed cases with poliovirus type 1 isolates. Of the 19 case-patients, 16 (84%) were younger than 6 years of age (range: 9 months—21 years). All case-patients were either unvaccinated (n=14) or inade-quately vaccinated (n=5). In Haiti, a single laboratory-con-firmed poliovirus type 1 case was reported in an inadequate-ly vaccinated child aged 2 years. The parainadequate-lysis onset was August 30. Intensive case-finding activities have continued but no additional cases have been identified.
This outbreak is of serious concern because no case of polio attributed to wild poliovirus has been detected in the Western Hemisphere since 1991. The outbreak virus is un-usual because it is derived from oral poliovirus vaccine (OPV), has 97% genetic similarity to the parental OPV strain (vac-cine-derived isolates are normally over 99.5% similar to the parent strain) and appears to have recovered the neuroviru-lence and transmissibility characteristics of wild poliovirus type 1. In comparison, wild polioviruses normally have less than 82% genetic similarity to OPV. Further, the differences in nucleotide sequences among the outbreak isolates suggest that the virus has been circulating for approximately 2 years
Outbreak of Poliomyelitis in the Dominican Republic and Haiti
in an area where vaccination coverage is very low and the accumulated genetic changes had restored the essential prop-erties of wild poliovirus.
In response to the outbreak, the ministries of health of the Dominican Republic and Haiti, with the assistance of PAHO and CDC, are working to determine the extent of the outbreak, evaluate its causes, and put in place appropriate control measures. The Dominican Republic has started a na-tionwide mass vaccination campaign with OPV. In Haiti, three nationwide vaccination rounds with OPV are planned for Jan-uary, FebrJan-uary, and March 2001.
The current outbreak draws attention to the importance that polio-free areas maintain high coverage with polio vac-cine until global polio eradication has been achieved. OPV is safe, effective and recommended for the eradication of polio. All countries should maintain high quality AFP and poliovi-rus surveillance, and current activities to eradicate wild po-lioviruses should be accelerated.
All travelers to the Dominican Republic and Haiti should be fully vaccinated against polio according to national vacci-nation guidelines. Those that have traveled to these coun-tries and are not adequately immunized should be consid-ered by their health care providers as at risk of acquiring poliomyelitis. Possible cases should be investigated proper-ly, including collection of stool samples, and suspected cas-es should be reported immediately to state and local health departments.
! The Department of Epidemiology, Biostatistics, and
Oc-cupational Health of McGill University will hold its 16th
Annual Summer Programme in Epidemiology and Biostatis-tics from May 7 to June 29, 2001.
The courses are intended for health professionals (physi-cians, nurses, psychologists, social scientists) or profession-als in related fields (e.g. industrial hygienists, environmental specialists, urban planners, engineers) wishing to gain famil-iarity with the principles of epidemiology and biostatistics, and for graduate students from McGill, and from Quebec, Canadian or US universities, or from universities elsewhere seeking to accelerate course work in a summer term. Academic credits are available to graduate students, resi-dents and fellows from McGill and other universities. Physi-cians with a license from Canada and USA can register for Continuing Medical Education (CME) units, fully accredited by the Committee on Accreditation of Canadian Medical Schools (CACMS) and by the Accreditation Council for Con-tinuing Medical Education (ACCME) of the USA. In addi-tion, physicians coming from outside Canada or USA, as well as health and other professionals can obtain a professional interest certificate.
The May session (May 7 - June 1) includes courses in: Epide-miology: Principles and Methods (3 credits); Statistical In-ference I (2 credits); Epidemiology of Cancer (1 credit); Top-ics on International Health (1 credit); Psychosocial Factors Affecting Medical Conditions (1 credit); Practicum in Public Health: Observatoire métropolitain sur les inégalités sociales et la santé (OMISs) (Course offered in collaboration with the Direction de Santé publique de Montréal-Centre) (1 credit)
and a focus on Clinical Trials: Clinical Trials: From Regula-tion to Practice (2 credits) and Clinical Trials: Design and Analysis (1 credit)
The June session (June 4-29) includes courses in: Practical Aspects of Protocol Development (3 credits); Analysis of Multivariable Data (3 credits); Statistical Inference II (2 cred-its); Environmental Risk Assessments for Epidemiologists
(1 credit)and a focus on Pharmacoepidemiology through a
series of four consecutive one-week courses: Introduction to Pharmacoepidemiology (2 credits); Intermediate Pharma-coepidemiology (2 credits); Advanced Pharmacoepidemiol-ogy (2 credits) and Pharmacoeconomics (2 credits).
For more information, contact: Summer Coordinator, 2001 Sum-mer Program in Epidemiology and Biostatistics, Faculty of Medicine, McGill University, Purvis Hall, 1020 Pine Avenue West, Room 38-B, Montreal, Quebec, Canada, H3A 1A2, Tel: (514) 398-3973, Fax: (514) 398-4503, email: [email protected]
! The Johns Hopkins University School of Hygiene and
Public Health will hold its 2001 Graduate Summer Institute of
Epidemiology and Biostatistics from June 18 to July 6, 2001. A total of 29 courses will be offered, ranging in length from one week-end to three weeks:
Three-week courses: Principles of Epidemiology, Methods
in Epidemiology - B, Infectious Disease Epidemiology,
Ap-plications of the Case-Control Method, Design and
Con-duct of Clinical Trials, Design and Analytical Methods in
Cohort Studies, Epidemiologic Basis for Tuberculosis
Con-trol, Genetic Epidemiology (2 weeks), Statistical
Comput-Summer Courses in Epidemiology in 2001
Recommended types of surveillance:
• Laboratory-based surveillance through screening of preg-nant women
• Routine reporting from antenatal (AN) clinics and senti-nel sites of AN clinics
• Active case finding from prevalence surveys in
preg-nancy
Only confirmed cases should be reported to intermediate and central level by:
• Routine case-based or aggregate reporting
• Periodic surveillance reports
Recommended minimum data elements:
Aggregated data
Number of cases of positive serology for syphilis by age group, month, geographical area.
Number of cases of congenital syphilis by age group, years, geographical area.
Performance indicators
False-positive rate at sentinel sites according to type of test (TPHA / FT-AB).
Recommended data analyses, presentations, reports
• Cases / incidence by geographical area, age, parity.
• Comparisons with age group and geographical area in
previous years (line graph).
• Rate of congenital syphilis by geographical area by
year (line graph).
• Annual surveillance summaries to be produced
nationally and regionally and feed back to original data sources.
Principal uses of data for decision-making
• Document syphilis prevalence by screening pregnant
women as a surrogate for general population
• Monitor trends in disease incidence
• Advocate syphilis control, and interventions
• Identify high risk areas for further targeting intervention
• Identify areas and populations where HIV prevention
ing in Public Health, Statistical Reasoning in Public Health I, Statistical Reasoning in Public Health II, Data Analysis Workshop (2 weeks)
One-week courses: Regression Analysis, Survival Analysis,
Introduction to the SAS Statistical Package, Introduction to
the Risk Sciences and Public Policy, Epidemiology in
Evi-dence-Based Decision Making, Epidemiology of HIV/AIDS,
Epidemiologic Applications of GIS, Epidemiologic Methods for Planning and Evaluating Health Services, Epidemiology
and Public Policy,Molecular Biology for Epidemiology, New
Perspectives on Management of Epidemiologic Studies,
Outcomes and Effectiveness Research, Reproductive
Epi-demiology, Teaching EpiEpi-demiology, Tobacco Control: National
and International Approaches, Bioterrorism: Public Health
Aspects
Week-end course: Clinical Research: An Introduction to
De-sign and Analysis
For further information, contact: Ayesha Khan, Program Co-ordinator, Graduate Summer Institute of Epidemiology and Biostatistics, Department of Epidemiology, School of Hygiene and Public Health, The Johns Hopkins university, 615 N. Wolfe Street, Baltimore, MD 21205, USA. Tel: (410) 955-7158, Fax: (410) 955-0863, email: [email protected], website: www.jhsph.edu/Departments/Epi/summer.html.
!The University of Michigan School of Public Health
an-nounces its 36th Graduate Summer Session in Epidemiology to be held from July 8 to 27, 2001. One and three week cours-es will be offered, including topics such as: Fundamentals of Biostatistics and Epidemiology, Epidemiology in Public Health Practice, Cancer, Injuries, Clinical Trials, Infectious Diseases, Pharmacoepidemiology, Computer Applications, Epidemio-logic Measures, Logistic Model, Environmental and Occupa-tional Epidemiology, Behavioral Change, Law, Health Eco-nomics, Biomarkers and Epidemiology, Social Epidemiology, Longitudinal Studies, PC-Sudaan, Global Health, Cardiovas-cular Epidemiology, and Genetics.
CME Credit is available.
For application and information contact: Jody Gray, Graduate Summer Session in Epidemiology, The University of Michi-gan, School of Public Health, 109 Observatory St., Ann Ar-bor, MI 48109-2029, USA, Telephone: (734) 764-5454, Fax: (734) 764-3192, Email: [email protected], Website: www.sph.umich.edu/epid/GSS
! The Eleventh Summer Session in Intermediate Epidemiolo-gy, sponsored by the Special Program for Health Analysis of
the Pan American Health Organization, will take place from
July 16 to August 3, 2001 at the College of Public Health of the University of South Florida in Tampa, Florida. Courses
offered are: intermediate methods in epidemiology, statistics applied to epidemiology and the use of software packages, and the use of epidemiology in the programming and evalua-tion of health services.
Students are required to have approved training in epidemi-ology. Courses will be conducted in Spanish, but partici-pants must be able to read English. Applications must be received before May 7, 2001.
For more information and application, contact: Dr. Carlos Castillo-Salgado, Chief, Special Program for Health Analysis (SHA), Pan American Health Organization, 525 Twenty-third Street, NW, Washington, DC 20037. Tel: (202) 974-3327, Fax: (202) 974-3674. email: [email protected]
! The eighteenth International Course in Applied Epidemi-ology, conferring diploma status recognized by the National Autonomous University of Mexico, will take place in July 2001 in Mexico, D.F., under the coordination of the
Depart-ment of Epidemiology of the Ministry of Health of Mexico.
Courses, divided into two levels (basic and intermediate), are designed to provide training in two broad areas: theoretical and methodological aspects of epidemiological practice, and specific subjects of applied epidemiology. They include, among others: basic and intermediate epidemiology, basic and intermediate biostatistics, epidemiological surveillance, Epi-Info 6.04, management of Health Services, design of re-search protocols, infectious disease epidemiology, social and cultural factors in epidemiological research and more. Applications must be received by June 2001.
For further information, please contact: Dirección General de Epidemiología, Francisco P. Miranda No. 177, Col. Unidad Lomas de Plateros, Delegación Obregón, C.P. 01480, México, D.F., Mexico. Tel: 55 93 36 61, Fax: 56 51 62 86
! The Biostatistics Program of the Ohio State University will hold its Summer Program in Applied Statistical Methods from 17 to 29 June, 2001. Weekly courses include: Applied Logis-tic Regression, Analysis of Experimental Data, Analysis of Correlated Data, Bayesian Methods in Medical Research, Design of Clinical Trials, Analysis of Clinical Trials Data, Applied Survival Analysis, Epidemiologic Methods, Statisti-cal Considerations for Confirmatory CliniStatisti-cal Trials with Reg-ulatory Objectives, Monte Carlo/Bootstrapping, Analysis of Sample Survey Data, Advanced Topics in Sampling. Two one-day courses, Applied Regression Analysis and How to Report Statistics in Biomedical Sciences, will also be offered. For more information, please contact the Biostatistics Sum-mer Program, The Ohio State University, M200 Starling Lov-ing Hall, 320 W. 10th Avenue, Columbus, Ohio 43210-1240.
PAHO's Epidemiological Bulletin is published quarterly in English and Spanish.
Catalogued and indexed by the United States National Library of Medicine
Printed on acid-free paper. PAN AMERICAN HEALTH ORGANIZATION
Pan American Sanitary Bureau, Regional Office of the WORLD HEALTH ORGANIZATION
525 Twenty-Third Street, N.W. Washington, DC 20037
Internet: http://www.paho.org/english/sha/beindexe.htm Basic Indicators 2000: Selected Indicators by subregion: Population
Basic Indicators 2000: Selected Indicators by subregion: Resources, Access and Coverage
(a) Bermuda, Canada, United States of America; (b) Belize, Costa Rica, El Salvador, Guatemala, Honduras, Nicaragua, Panama; (c) Cuba, Dominican Republic, Haiti, Puerto Rico; (d) Bolivia, Colombia, Ecuador, Peru, Venezuela; (e) Argentina, Chile, Paraguay, Uruguay;(f) Anguilla, Antigua & Barbuda, Aruba, The Bahamas, Barbados, Cayman Islands, Dominica, Frech Guiana, Grenada, Guadeloupe, Guyana, Jamaica, Martinique, Montserrat, Netherlands Antilles, Saint Kitts & Nevis, Saint Lucia, Saint Vincent & the Grenadines, Suriname, Trinidad & Tobago, Turks & Caicos Islands, Virgin Islands (UK), Virgin Islands (US). i= not applicable
T otal P opulation Annual Urban Crude Annual Crude Annual T otal fertility Infant Life expectancy Literate P opulation P opulation birth rate births average death rate deaths average rate Mortality at birth pop. (thous ands ) growth rate (%) (%) (1.000 pop) (thous ands ) (1.000 pop) (thous ands ) per woman (1,000 lb) (years ) (%)
S u br egion 2000 1995-00 2000 1995-00 1995-00 1995-00 1995-00 1995-00 1995-00 1995-00 1998
T he Americas 823,255 1.3 76.0 19.4 15,416 7.2 5,791 2.4 24.8 72.4 92 North America (a) 308,569 0.8 77.2 13.6 4,113 8.6 2,597 1.9 7.0 76.9 99 Latin America & T he Caribbean 514,686 1.5 75.3 22.9 11,303 6.4 3,194 2.7 35.5 69.8 87 Latin America 506,814 1.5 75.6 22.9 11,149 6.4 3,145 2.7 35.7 69.7 87 Mexico 98,881 1.6 74.4 24.6 2,338 5.1 481 2.8 31.0 72.5 91 Central American Is thmus (b) 36,616 2.5 48.3 31.6 1,089 5.8 199 3.9 36.0 69.7 75 Latin Caribbean (c) 31,390 1.2 63.4 21.7 662 8.0 244 2.7 45.0 68.3 80 B razil 169,202 1.2 81.3 19.6 3,210 7.1 1,173 2.2 42.0 67.1 85 Andean Area (d) 109,711 1.8 75.0 25.1 2,628 5.9 619 3.0 35.0 69.7 90 S outhern Cone (e) 61,014 1.4 85.3 20.7 1,222 7.3 429 2.7 22.0 73.3 96 Non-Latin Caribbean (f) 7,872 1.0 58.9 20.1 154 6.4 49 2.3 22.0 72.6 91
National health H os pital
expenditures phys icians nurs ing dentis ts beds (percentage) drinking water s ewerage as % of GDP profes s ionals per 1,000 pop. DP T 3 OP V 3 B CG meas les
S u br egion 1998 1998 1996 1999 1999 1999 1996 1999 1999 1999 1999
T he Americas 91 80 9.9 21.3 40.5 5.3 2.9 90 88 94 91 North America (a) 100 100 14.4 27.4 96.4 6.0 4.0 95 91 i 92 L atin America & T he Caribbean 85 68 7.2 17.6 6.9 4.8 2.2 87 87 94 90 L atin America 85 68 7.2 17.7 6.7 4.9 2.2 87 87 94 90 Mexico 89 72 4.1 15.6 10.8 1.0 1.1 96 96 99 94 Central American Is thmus (b) 77 78 7.6 10.2 5.1 2.3 1.4 90 91 89 91 L atin Caribbean (c) 74 70 6.6 28.5 12.4 5.6 2.8 80 81 84 93 B razil 94 59 8.4 21.0 4.5 9.4 3.1 83 84 99 90 Andean Area (d) 77 65 7.1 11.7 5.4 3.7 1.5 85 82 85 85 S outhern Cone (e) 80 85 9.1 22.0 6.1 1.9 3.0 89 91 97 94 Non-Latin Caribbean (f) 90 87 5.0 7.1 23.7 1.2 3.9 86 85 88 86 P opulation with acces s to H uman res ources per 10,000 pop immunization coverage in under 1 year old