ISSN 0104-6632 Printed in Brazil
www.abeq.org.br/bjche
Vol. 27, No. 03, pp. 473 - 482, July - September, 2010
Brazilian Journal
of Chemical
Engineering
MODELING ELECTRODIALYSIS AND
A PHOTOCHEMICAL PROCESS FOR
THEIR INTEGRATION IN SALINE
WASTEWATER TREATMENT
F. J. Borges
1*, H. Roux-de Balmann
2and R. Guardani
31,3
LSCP/CESQ, Department of Chemical Engineering, Polytechnic School, University of São Paulo, Av. Prof. Luciano Gualberto, 380, Trav. 3, CEP: 05508-900, São Paulo - SP, Brazil. Rua Breves 443, CEP: 04645-001, Fax: + (55)(11) 5523-3553, São Paulo - SP, Brazil.
*
E-mail: [email protected]
2
Laboratoire de Génie Chimique, UMR CNRS 5503, Université Paul Sabatier, 31062, Toulouse Cedex 4, France.
(Submitted: December 11, 2009 ; Revised: July 15, 2010 ; Accepted: July16, 2010)
Abstract - Oxidation processes can be used to treat industrial wastewater containing non-biodegradable organic compounds. However, the presence of dissolved salts may inhibit or retard the treatment process. In this study, wastewater desalination by electrodialysis (ED) associated with an advanced oxidation process (photo-Fenton) was applied to an aqueous NaCl solution containing phenol. The influence of process variables on the demineralization factor was investigated for ED in pilot scale and a correlation was obtained between the phenol, salt and water fluxes with the driving force. The oxidation process was investigated in a laboratory batch reactor and a model based on artificial neural networks was developed by fitting the experimental data describing the reaction rate as a function of the input variables. With the experimental parameters of both processes, a dynamic model was developed for ED and a continuous model, using a plug flow reactor approach, for the oxidation process. Finally, the hybrid model simulation could validate different scenarios of the integrated system and can be used for process optimization.
Keywords: Process integration; Modeling; Electrodialysis; Advanced oxidation process; Wastewater.
INTRODUCTION
Recalcitrant organic pollutants, like phenol and phenolic compounds, common contaminants in industrial wastewater, have been recognized as an issue of growing interest in recent years, as observed from the increasing number of papers in the literature dedicated to the subject. Conventional wastewater treatments are hardly capable of removing such pollutants. Advanced oxidation processes like the photo-Fenton reaction are recommended in these cases, since oxidation is based on free radicals, which are capable of degrading a wide range of organic
compounds in water. However, the presence of ionic compounds, like sodium chloride, NaCl, normally associated with these pollutants in wastewater, may retard such processes (Maciel, 2004; Gogate e Pandit, 2004; Pignatello, 2006). In this context, the possibility of integrating electrodialysis (ED) and advanced oxidation processes (AOP) for the treatment of a saline aqueous solution containing phenol has been investigated.
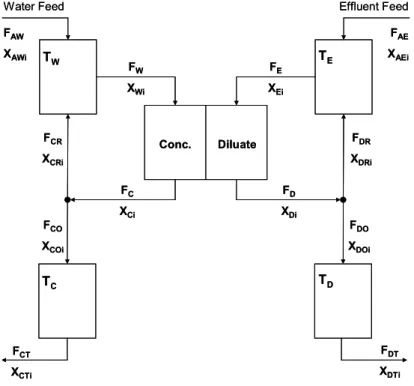
potential gradient. Typical ED equipment consists of a series of anion and cation-exchange membranes that allow the selective passage of anion and cation, respectively, arranged in an alternating pattern between an anode and a cathode. When ionic solutions are pumped through the cell, the ion concentration increases in alternate compartments (concentrate), while the other compartments become depleted (diluate) (Strathmann, 2004). In particular, an aqueous saline solution containing phenol can be treated by ED, resulting in a demineralized solution and a saline wastewater. In this manner, the salt can be removed prior to the wastewater treatment by oxidation processes, as shown in Figure 1.
AOP is considered a promising remediation alternative for wastewaters containing recalcitrant compounds like phenol. The processes involve the production of reactive hydroxyl radicals that can oxidize organic compounds. One of the most used AOP is the photo-Fenton process, which combines peroxide, usually hydrogen peroxide, iron ions and UV light irradiation (Esplugas, 2002).
This paper presents results of a study of a hybrid model based on parameters obtained experimentally
for the demineralization and oxidation processes. Experiments were performed with aqueous NaCl solutions with concentrations within the range of industrial phenolic wastewater. The approach, model and parameters obtained can be used in further similar works and optimization.
MODEL APPROACH Electrodialysis
The investigation of the desalination of water containing phenol and sodium chloride by ED was previously reported by Borges et al. (2008). Experiments were carried out in pilot equipment and linear correlations were used to relate the phenol, salt and water fluxes with the driving forces (concentration and electric potential gradients) in the ED cell. Experiments were carried out at constant current, in a range between 75 and 275 A m-2; the concentration of the salt and phenol in the diluate ranged from 0 to 55 kg m-3 and from 100 to 400 ppm C, respectively. Table 1 presents the flux equations and parameters obtained.
Treated Wastewater Water
Wastewater (Na+, Cl-, Phenol)
Demineralized Wastewater
(Phenol + residual salt) Saline
Wastewater
ED AOP
Treated Wastewater Water
Wastewater (Na+, Cl-, Phenol)
Demineralized Wastewater
(Phenol + residual salt) Saline
Wastewater
ED AOP
Figure 1: Process integration schematic representation
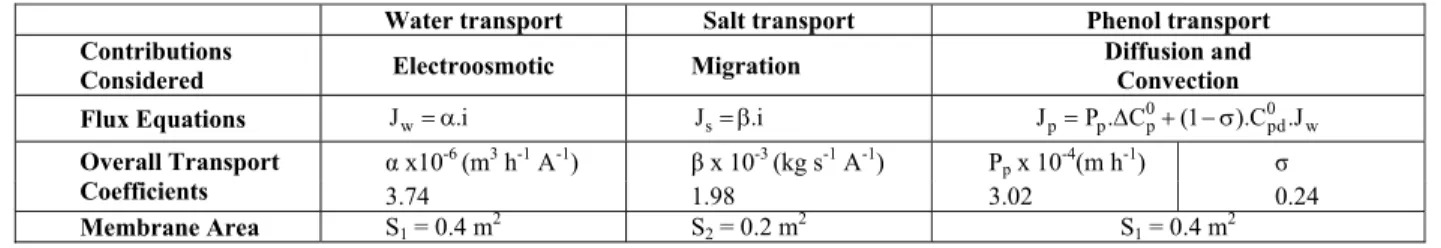
Table 1: Flux equations and overall transport coefficients obtained in the experiments with the ED system (Borges et al., 2008).
Water transport Salt transport Phenol transport Contributions
Considered Electroosmotic Migration
Diffusion and Convection Flux Equations Jw= α.i Js= β.i Jp= Δ + − σP . Cp p0 (1 ).C .J0pd w
α x10-6
(m3 h-1 A-1) β x 10-3 (kg s-1 A-1) Pp x 10-4(m h-1) σ
Overall Transport
Coefficients 3.74 1.98 3.02 0.24
Where JW is the water flux (m h
-1
); Jp and Js,
phenol and salt flux respectively (kg m-2 h-1); α, electro osmotic coefficient (m3 h-1 A-1); β, current coefficient (kg h-1 A-1); i , current density (A m-2); S, membrane transfer area; P , phenol permeability p
coefficient (m h-1); ΔC0p, initial phenol concentration difference between compartments; σ, reflection coefficient, which measures the relative restriction of the membrane to the solvent or solute flow, andC0pd, the initial phenol concentration in the feed (kg m-3).
Salt and water transport were related to the current density applied. For the neutral solute, phenol, a convective contribution due to water flux occurred besides the expected diffusion contribution. The fitting of the parameters of the transport equations resulted in good agreement with the experimental results over the range of conditions investigated.
The equations presented in Table 1, which describe the flux within the ED cell, can be combined with the material balance ordinary differential equations (see Appendix A) to describe the system presented in Figure 2. It was assumed that all solutions in the system are well mixed under isothermal condition and have constant density.
The volumetric flow rate, Q, tank volume, V, and component mass concentration, Ci, were used to evaluate the different scenarios using the notation presented in Figure 2. The phenol flux equation was simplified for the pilot experimental conditions; for this generic model, the former equation can be used as presented in Equation (1), since the phenol concentration difference between compartments,
p
C ,
Δ can be significant and should be calculated over time.
d
p p p p w
J = Δ + − σP . C (1 ).C .J (1)
For the second flux contribution, the original mean solute concentration on either side of the membrane was considered to be equal to the phenol concentration in the diluate,
d
p
C .
The typical value of 1 mm was used as the membrane distance in the stack for the volume calculation for each ED cell compartment (Strathmann, 2004). Therefore, the volume of 0.0002 m3 was adopted (for 10 compartments and membrane area of 0.02 m2).
The dynamic model can simulate the system flow, salt and phenol concentrations over time, and a steady state approach was obtained from this model.
Conc. Diluate TW
TC TD
TE
Water Feed Effluent Feed
FAW
XAWi
FAE
XAEi
FC
XCi
FE
XEi
FD
XDi FW
XWi
FCR
XCRi
FDR
XDRi
FCT
XCTi
FDT
XDTi FDO
XDOi FCO
XCOi
Conc. Diluate TW
TC TD
TE
Water Feed Effluent Feed
FAW
XAWi
FAE
XAEi
FC
XCi
FE
XEi
FD
XDi FW
XWi
FCR
XCRi
FDR
XDRi
FCT
XCTi
FDT
XDTi FDO
XDOi FCO
XCOi
Photochemical Process
In the ED experiments, the phenol concentration was varied in order to generate data for a correlation of
p
J vs ΔCp. In the experiments on Photo-Fenton oxidation, however, the initial phenol concentration was kept at an arbitrarily selected value of 100 ppm. Photo-Fenton oxidation processes were experimentally investigated using a laboratory batch reactor for the degradation of phenol in saline media. Experiments were carried in an annular photochemical reactor (1 L) connected to a well stirred jacketed reservoir (1 L). The lamp (250W Philips medium-pressure mercury vapor lamp) was protected by a water-cooled quartz immersion well. The system was fed with 100 ppm C of phenol in saline solution and ferrous sulfate heptahydrate (Fe2+). The solution was circulated through the reactor at a flow rate of about 1.5 L min-1 by means of a centrifugal pump. The reaction was initiated by irradiation with the onset of addition of hydrogen peroxide (H2O2) solution at a rate of 0.83 mL min-1. The pH was maintained at 3.0 and temperature at 30oC±2oC. Samples were withdrawn at appropriate time intervals. The organic concentration was determined by Total Organic Carbon (TOC) analysis.
An experimental design based on the Doehlert model (De Aguiar et al., 1998) with three variables was used to study the effect of NaCl, H2O2 and Fe2+ concentrations on phenol degradation (variable ranges from 0 to 50 kg m-3, 10 to 80 mmol.L-1 and 0.1 to 0.5 mmol.L-1, respectively). These ranges were chosen from preliminary studies in the domain of interest.
As expected, the results confirm the negative effect of the salt concentration on the phenol removal efficiency by oxidation. Moreover, this effect was found not to be linear with salt concentration and degradation rate. Due to the complexity of these reaction systems, a model has been developed to fit the experimental data based on artificial neural network, whose fundamental aspects are presented elsewhere (Gob et al., 1999). This model describes the evolution of the pollutant concentration, i.e.,
phenol, by means of a reaction rate, during irradiation time under various operating conditions.
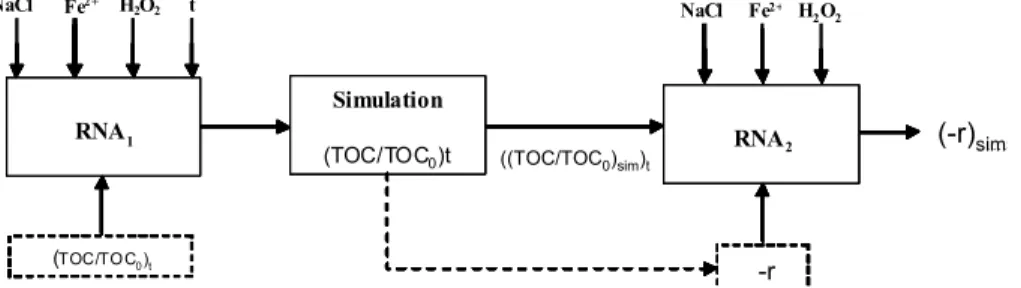
Figure 3 shows a diagramatic representation of the model used to obtain the reaction rate as a function of the salt, Fe2+, H2O2 concentration and TOC/TOC0, where TOC0 is the initial TOC value.
Two artificial neural networks were used: RNA1 and RNA2, feed-forward type containing three layers (input, hidden and output). The programs to generate the models and to perform the simulations were developed at LSCP (Process Control and Simulation Laboratory).
RNA1 models the values of TOC/TOC0 at a given time as a function of NaCl, Fe2+ and H2O2 concentrations. The output variable is (TOC/TOC0)t. RNA1 simulates TOC/TOC0 over time (0 to 120 min) at different conditions to obtain ((TOC/TOC0)t)sim. The reaction rate was calculated for each value of ((TOC/TOC0)t)sim, as:
i i 1
0 t 0 t
i i 1
(TOC / TOC ) (TOC / TOC ) r
t t
− −
−
= − (2)
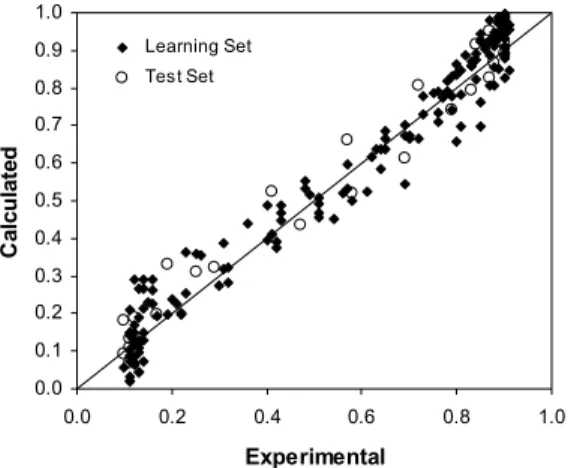
The RNA1 data set consisted of 200 data pairs. The input variables were normalized in the range of 0.1 to 0.9. Experimental data were randomly distributed into the learning set (LS) and the test set (TS) and the artificial neural network was trained by varying its configuration (number of neurons in the hidden layer (NH), number of presentations and training parameters). Model fitting was evaluated using different criteria: mean square error in TS and LS, calculated and experimental results deviation, and the model performance in relation to the test set. The simulation results confirmed the fitting quality of NH=4; number of iterations (NI) = 20,000. Figure 4 shows a comparison between calculated and experimental values of the RNA1 output variable, (TOC/TOC0)t; with determination coefficients of 0.966 and 0.965 for the LS and the TS respectively. This comparison shows good agreement with experimental data.
NaCl
(-r)sim
RNA1
Fe2+ H
2O2 t NaCl Fe2+ H
2O2
RNA2
(TOC/TO C0)t
((TOC/TOC0)sim)t
-r
Simulation
(TOC/TOC0)t NaCl
(-r)sim
RNA1
Fe2+ H
2O2 t NaCl Fe2+ H
2O2
RNA2
(TOC/TO C0)t
((TOC/TOC0)sim)t
-r
Simulation
(TOC/TOC0)t ((TOC/TOC0)sim)t
-r
(-r)sim
NaCl
(-r)sim
RNA1
Fe2+ H
2O2 t NaCl Fe2+ H
2O2
RNA2
(TOC/TO C0)t
((TOC/TOC0)sim)t
-r
Simulation
(TOC/TOC0)t NaCl
(-r)sim
RNA1
Fe2+ H
2O2 t NaCl Fe2+ H
2O2
RNA2
(TOC/TO C0)t
((TOC/TOC0)sim)t
-r
Simulation
(TOC/TOC0)t ((TOC/TOC0)sim)t
-r
(-r)sim
0.0 0.1 0.2 0.3 0.4 0.5 0.6 0.7 0.8 0.9 1.0
0.0 0.2 0.4 0.6 0.8 1.0
Experimental
C
a
lc
u
la
te
d
Learning Set Test Set reta Linéaire (reta)
Figure 4: Comparison between calculated and experimental values of TOC/TOC0 results for RNA1. Figure 5(a) and 5(b) shows a comparison between
experimental values for TOC/TOC0 as a function of time and RNA1 simulated results for two different experiments included in the TS.
Simulation results with different RNA1 indicate that, regarding H2O2 concentration, the model can predict the effect of this variable in accordance with experimental data. Model fitting was better for lower H2O2 concentrations, as presented in Figure 6. For higher H2O2 concentrations, the effect of reactant excess in the reaction system could be simulated, since it was observed, in accordance with experiments, that there was no substantial variation of TOC degradation between 40 and 80 mmol.L-1. The negative effect of NaCl concentration was also in agreement with experiments. The negative effect is larger for NaCl concentrations between 10 and 40 kg m-3. Simulation
tendencies were more subtle, but, considering experimental error, the model was able to reproduce this peculiar experimental behavior.
RNA2 calculates the reaction rate as a function of TOC/TOC0 value, NaCl, Fe2+ and H2O2 concentrations. Values of ((TOC/TOC0)sim)t obtained from RNA1 model simulations were used as one of the inputs. Different combinations of the following conditions were used: [H2O2] (mmol.L-1) = 10, 20, 40, 80; [NaCl] (kg m-3) = 0:5:50; [Fe(II)] (mmol.L-1) = 0.1, 0.2, 0.5; 120 minutes as the reaction time, for each 10 minutes. Based on the minimum value of the quadratic deviation and the comparison of experimental and calculated results (determination coefficients of 0.960), the value of NH equal to 10 was adopted for the simulations (NI = 20,000). Table 2 shows the corresponding weights of RNA2.
0.0 0.1 0.2 0.3 0.4 0.5 0.6 0.7 0.8 0.9 1.0
0 20 40 60 80 100 120
Time (min)
T
O
C
/T
O
C
o
0.0 0.1 0.2 0.3 0.4 0.5 0.6 0.7 0.8 0.9 1.0
0 20 40 60 80 100 120
Time (min)
T
O
C
/T
O
C
o
(a) (b)
0 10 20 30 40 50 60 70 80 90 100
0 10 20 30 40 50 60
[NaCl] kg m-3
T
O
C
R
e
m
o
v
a
l
(%
)
80 mmol L-1 40 mmol L-1 20 mmol L-1 10 mmol L-1
-1
-1
-1
-1
Figure 6: Percentage of TOC removal in 30 minutes of reaction time versus salt concentration for different values of H2O2 concentration; [Fe(II)]=0.2 mmol.L-1 (symbols correspond to experimental values; lines represent calculated values).
Table 2: Matrices of weights for the adjusted neural network RNA2 (NH = 10 and NI = 20 000). W1:
weights between input and hidden layers; W2: weights between hidden and output layers.
W1 W2
Neuron x1 (H2O2)
x2
(NaCl)
x3
(Fe(II))
x4
(TOC/TOC0)
Bias Neuron Weight
1 1.230 0.756 1.365 0.051 0.734 1 -7.139
2 -0.224 2.092 1.759 0.649 0.899 2 -9.603
3 6.267 0.765 -4.096 -0.282 0.759 3 3.490
4 1.168 0.426 2.842 -3.376 0.119 4 4.611
5 -0.872 0.429 5.718 -1.554 0.379 5 6.014
6 0.271 -0.452 5.744 0.871 0.057 6 -8.330
7 -2.936 -1.338 7.462 3.986 0.414 7 -3.342 8 -0.673 0.692 -0.018 4.463 0.855 8 19.580
9 0.086 1.094 -1.944 -4.643 0.211 9 -13.142
10 -3.398 0.071 -1.697 8.128 0.228 10 -1.486
Bias 0.168
A plug flow reactor was modeled using the reaction rate obtained by RNA2, r , in an ordinary differential equation:
(z)
dTOC r
dV = −Q (3)
where V is the reactor volume, z the distance down the tube from the inlet and q the flow.
The model can describe the TOC variation in a plug flow reactor as a function of its volume and operation conditions, i.e., NaCl, Fe2+ and H2O2 concentrations. The algorithm for the simulation was organized to design the reactor, estimating V, for different conditions of the process and TOC reaction rate.
RESULTS AND DISCUSSION
The process integration was carried out by setting the ED salt and phenol concentration output
( S
DO
C and P
DO
C (Figure 2)) as conditions in the
feed stream to the photochemical reactor. Several scenarios were studied with the proposed hybrid model and are summarized below.
Concerning the desalination, the model represents a generic ED system to study different configurations of the process. Firstly, the accuracy of the simulation prediction was validated comparing experimental results with a pilot configuration of the system, i.e., feed and outlet stream equal to zero (total recycle).
0 0.5 1 1.5 2 2.5 3
50 100 150 200 250 300
i [A m-2]
C c p [k g m -3]. 1 0 3 0 10 20 30 40 50 60 M e m b ra n e A re a ( m 2) 0 0.5 1 1.5 2 2.5 3
50 100 150 200 250 300 0 10 20 30 40 50 60
i [A m-2]
C c p [k g m -3]. 1 0 3 Me m b ra n e A re a (m 2) 0 0.5 1 1.5 2 2.5 3
50 100 150 200 250 300
i [A m-2]
C c p [k g m -3]. 1 0 3 0 10 20 30 40 50 60 M e m b ra n e A re a ( m 2) 0 0.5 1 1.5 2 2.5 3 0 0.5 1 1.5 2 2.5 3
50 100 150 200 250 300 50 100 150 200 250 300
0 10 20 30 40 50 60 0 10 20 30 40 50 60
i [A m-2]
C c p [k g m -3]. 1 0 3 Me m b ra n e A re a (m 2)
Figure 7: Phenol loss () and membrane area () vs. current density for 80% demineralization;
p
3 AE
C =0.18 kg m ,− S
3 AE
C =50 kg m ,− p
AW
C =0,
AWs
C =0
As expected, for lower current density, higher membrane area is required and higher phenol loss (
P
CO
C ) in the concentrate occurs in order to achieve
a given amount of demineralization. As mentioned, phenol flux through the membranes has two different contributions, convective and diffusive. In the case presented in Figure 7, the convective contribution is constant, but diffusion increases with membrane area and with experiment time.
The change in membrane area is more pronounced for lower current densities. The phenol loss is less sensitive to the current density than to the membrane area.
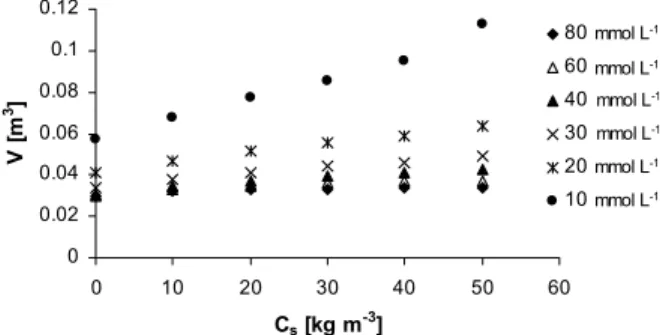
On the other hand, the optimal condition for the photochemical step is related to the salt concentration of the ED product. The total cost of this step corresponds to the sum of direct operation costs, mainly reagents and energy, and the investment cost. Of these, energy and investment costs are by far the most significant ones (Peretti, 2008). The investment cost is directly proportional to the reactor volume and its dependence in relation to the NaCl concentration under different conditions can be estimated by the model, as illustrated in Figure 8 for different values of H2O2 concentration, and for 70% removal of the initial TOC. For the conditions studied, the H2O2 concentration plays an important role, since a mitigation of the NaCl negative effect is observed for H2O2 concentration values above ca. 30 mmol.L-1.
0 0.02 0.04 0.06 0.08 0.1 0.12
0 10 20 30 40 50 60
Cs [kg m-3]
V [m 3] 80 mM 60 mM 40 mM 30 mM 20 mM 10 mM
mmol L-1
mmol L-1
mmol L-1
mmol L-1
mmol L-1
mmol L-1
Figure 8: Photochemical reactor volume vs. salt concentration in the feed for different values of H2O2 concentrations to attain 70% degradation; TOC0= 0.1 kg m-3; i = 275 A m-2.
Table 3: Results for different scenarios of the integrated process.
Responses
ED AOP % Dem. i (A m-2)
S (m2)
Phenol Loss P
CO
C (kg m-3) D Q
(m3 h-1) Vreactor (L)
75 218.5 0.017 125 131.1 0.014
175 93.7 0.013
225 72.8 0.012
60
275 59.6 0.011
0.81 361.3
75 279.9 0.020 125 167.9 0.017 175 119.9 0.015
225 93.3 0.014
80
275 76.3 0.013
0.84 321.0
75 331.2 0.022 125 198.7 0.019 175 141.9 0.017 225 110.4 0.016 98
275 90.3 0.015
Table 3 shows some results for the process integration in different scenarios. The ED process was evaluated considering different aspects: membrane area, phenol loss and the concentrate outlet flow (Q ).D Simulations were carried out in steady state using different demineralization percentages (% Dem.) for the ED process, 60, 80 and 98% (
S
CO
C = 20, 10
and 1 kg m-3, respectively), initial salt and phenol concentration of 50 kg m-3 and 0.1 kg m-3 and inlet flow of the ED process (QAW and QAE) of 1 m3 h-1. The ED demineralized effluent was evaluated considering the reactor volume needed to remove 70% of TOC (40 mmol.L-1 of H2O2 and 0.2 of Fe2+).
In general, it can be observed that the salt concentration of the ED outlet stream has an important effect on the reactor volume, i.e., a negative effect in the oxidation step. In the studied conditions, for a 22% increase of the reactor volume a change in the salt concentration from 1 to 20 kg m-3 was observed. Regarding the ED process, this increase in demineralization percentage affects the concentrate outlet flow, i.e., the oxidation step feed. The membrane area decreases with the current density increase: an increase in current density from 75 to 275 A m-2 causes the membrane area to decrease about 23%, while phenol concentration decreases 35%.
CONCLUSIONS
A hybrid model in agreement with experimental data was obtained for the ED and photochemical processes.
The ED solute and solution transport could be modeled by a phenomenological approach and a model based on artificial neural networks was used to model the oxidation process in saline media. The model could predict the negative effect of the salt concentration on the phenol removal efficiency by oxidation.
Simulations based on the model have been performed in order to estimate the behavior of the system under different conditions.
The model constitutes an important step in understanding the behavior of the integrated process and in further studies aimed at assessing the feasibility of integrated effluent treatment processes, in which the costs of the ED and photochemical steps must be coupled in order to achieve a given level of demineralization and degradation. The interest to demineralize the waste water before the oxidation is a consequence of balancing the additional costs due to the demineralization, the improvement of the separation efficiency that can be
reached and the reagents consumption required for the oxidation step.
ACKNOWLEDGEMENTS
The authors thank the Brazilian Federal Agency, CAPES, The National Counsel of Technological and Scientific Development, CNPq, and The State of São Paulo Research Foundation, FAPESP, for financial support.
NOMENCLATURE
AOP advanced oxidation process C concentration
ED electrodialysis F molar flow
i current density
p
J phenol flux
s
J salt flux
W
J water flux LS learning set
NH number of neurons in the hidden layer NI number of iterations
p
P phenol permeability coefficient
Q flow
r reaction rate R recycle fraction S membrane transfer area t time
TOC total organic carbon TS test set
V reactor volume
W1 weights between input and hidden layers W2 weights between hidden and output layers X molar component fraction
z distance down the tube from the inlet
Subscripts
c concentrate compartment d diluate compartment p phenol
s salt w water
Greek Symbols
α electro osmotic coefficient
C
Δ concentration difference between compartments
σ reflection coefficient
REFERENCES
Borges, F., Roux-de Balmann, H., Guardani, R., Investigation of the mass transfer processes during the desalination of waster containing phenol and sodium chloride by electrodialysys. Jounal of Membrane Science, 325, p. 130-138 (2008).
De Aguiar, P. F., Massart, D. L., Experimental design. The Encyclopedia of Computational Chemistry, John Wiley & Sons, Chichester (1998).
Gob, S., Oliveros E., Bossmann, S.H., Braun, A. M., Guardani, R., Nascimento, C. A. O., Modeling the kinetics of a photochemical water treatment process by means of artificial neural networks. Chemical Engineering and Processing, 38, p. 373-382 (1999).
Gogate, P. R., Pandit, A. B., A review of imperative technologies for wastewater treatment oxidation technologies at ambient conditions. Advanced in Environmental Research, 8, p. 501-551 (2004). Esplugas, S., Giménez, J., Contreras, S., Pascual, E.,
Rodríguez, M., Comparison of different advanced oxidation processes for phenol degradation. Water Research, 36, p. 1034-1042 (2002).
Maciel, R., Sant´Anna, Jr. G. L., Dezotti, M., Phenol removal from high salinity effluents using Fenton´s reagent and photo-Fenton reactions. Chemosphere, 57, p. 711-719 (2004).
Peretti, M. T., Projeto ótimo de sistemas de reatores para tratamento fotoquímico de efluentes industriais. M.Sc. Diss, University of São Paulo, São Paulo, p. 111 (2008).
Pignatello, J. J., Dark and photoassisted Fe3+-catalysed degradation of chlorophenoxy herbicides by hydrogen peroxide. Environmental Science Technology, 26, p. 944-951 (1992). Strathmann, H., Ion-exchange membrane separation
processes. Membrane Science and Technology Series, v. 9, Elsevier (2004).
APPENDIX A
MATERIAL BALANCE EQUATIONS FOR THE SYSTEM SHOWN IN FIGURE 2
Considering constant density liquid solutions in the streams, isothermal and well mixed system, the following mole balance equations were used to calculate the number of moles, N, and the salt, phenol and water mole fractions over time, for the system presented in Figure 2.
Equation (A1) represents the global mole balance in the system:
AW AE CT DT
dN
F F F F
dt = + − − (A1)
For tank T the mole balance is described as W Equation (A2), where NW is the total number of moles in the tank:
W
AW CR W
dN
F F F
dt = + − (A2)
Equation (A3) expresses the quantity variation for species i (salt, phenol and water) over time in tank T . W
Wi W
AW AWi CR CRi W Wi
dX N
F X F X F X
dt = + − (A3)
Equation (A3) combined with equation A2 results in:
Wi
AW AWi CR CRi W
AW Wi CR Wi
dX 1
(F X F X
dt N
F X F X )
= + −
− (A4)
By analogy, Equations (A5) and (A6) express the mole balances in tank T : E
E
AE DR E
dN
F F F
dt = + − (A5)
Ei
AE AEi DR DRi E
AE Ei DR Ei
dX 1
(F X F X
dt N
F X F X )
= + −
− (A6)
D E W s p
F =F −2J A (J − +J )A (A7)
where Ji is the molar flux of species i.
Phenol and salt concentrations can be expressed as shown in Equations (A8) and (A9):
Dp
E Ep p D Dp
ED
dX 1
(F X 2J A F X )
dt =N − − (A8)
Ds
E Es s D Ds
ED
dX 1
(F X J A F X )
dt = N − − (A9)
It is important to note that phenol is transported through both membranes, cation and anion-exchange membranes, while the dissociated salt is transported in each membrane type; therefore, each component flux is multiplied by the corresponding membrane area.
Likewise, the mole balances in the concentrate compartment can be expressed by Equations (A10) to (A12):
C W W s p
F =F +2J A +(J +J )A (A10)
Cs
W Ws s C Cs
ED
dF 1
(F X J A F X )
dt =N + − (A11)
Cp
W Wp p C Cp
ED
dX 1
(F X 2J A F X )
dt =N + − (A12)
The system recirculation streams are defined in Equations (A13) and (A14), where R and C R are D the recycle ratio of the concentrate and diluate compartments, respectively.
CR C C
F =R F (A13)
DR D D
F =R F (A14)
The inlet streams to tanks T and C T are: D
CO C CR
F =F −F (A15)
DO D DR
F =F −F (A16)
For both tanks, the following mole balance equations apply:
C
CO CT
dN
F F
dt = − (A17)
CTs
CO COs CO CTs C
dX 1
(F X F X )
dt = N − (A18)
CTp
CO COp CO CTp C
dX 1
(F X F X )
dt =N − (A19)
D
DO DT
dN
F F
dt = − (A20)
DTs
DO DOs DO DTs D
dX 1
(F X F X )
dt = N − (A21)
DTp
DO DOp DO DTp
D
dX 1
(F X F X )
dt =N − (A22)
![Figure 6: Percentage of TOC removal in 30 minutes of reaction time versus salt concentration for different values of H 2 O 2 concentration; [Fe(II)]=0.2 mmol.L -1 (symbols correspond to experimental values; lines represent calculated values)](https://thumb-eu.123doks.com/thumbv2/123dok_br/18895171.426141/6.918.281.636.123.354/percentage-concentration-different-concentration-correspond-experimental-represent-calculated.webp)