Morphology and Damping Behavior of Polyurethane/PMMA
Simultaneous Interpenetrating Networks
S.H. Wanga, S. Zawadzkib, L. Akcelrudb
a
Escola Politécnica da Universidade de São Paulo, Departamento de Engenharia Metalúrgica e de Materiais, 05508-900 São Paulo - SP, Brazil
b
Departamento de Química, Universidade Federal do Paraná, Centro Politécnico, 81531-990 Curitiba - PR, Brazil
Received: November 14, 2000; Revised: January 19, 2001
A series of polyurethane/PMMA simultaneous interpenetrating networks (SINs) with various hard segment contents (X) in the polyurethane phase (X= 15.5 to 36.5% in polyurethane) and wide range of polyurethane (PU) to polyacrylate (PA) ratio (PU/PA = 20:80 to 80:20) were prepared, and the damping and mechanical properties of these materials were studied. The damping of polyure-thane soft phase was increased and shifted to lower temperature with increased content of PA vitreous phase. The mechanical properties were improved with increasing PA contents. The results show that PA and the polyurethane hard segment interaction play a special role in chain interpene-tration density and its magnitude is revealed by the decreased dispersed domain size observed by scanning electron microscopy (SEM) and increased loss area as measured by dynamic mechanical thermal analysis (DMTA). When the weight ratio of PU/PA was 40:60, the resulting SIN materials possessed better damping properties, independent ofXconcentration.
Keywords:morphology, SINs, damping, PU/PA
1. Introduction
The damping behavior of polymeric materials has re-ceived increased attention from the scientific community due to its increased technological importance in the devel-opment of materials for application as coating, cushioning, structure frame, parts connector and others. Higher damp-ing is associated to mechanical stability, thermal and sound isolation, just to cite some consequences, and can provide more comfortable environment.
Damping is the most sensitive indicator of all kinds of molecular motions displayed by a polymer in solid state and can be correlated to many transitions, relaxation processes, structural heterogeneities, and to the morphology of multi-phase and crosslinked systems1.
Although most of published literature2-11interpret the
tanδintensity and its temperature spread in a dynamic-me-chanical analysis as the damping capacity, this interpreta-tion has received some criticism and the applicainterpreta-tion of the
integration of the area under the linear loss modulus in function of temperature curves has been suggested as a quantitative measurement of the damping capacity of the material by many authors7-11, supported by the fact that the
loss modulus E” is directly proportional to the heat dissi-pated per cycle of dynamic deformation.
Interpenetrating polymer network (IPN) systems are known to introduce forced polymeric interaction between immiscible polymers, that are then able to present high connectivity among the phases, and also allowing the for-mation of fine, controllable and stable dispersed phase. IPN’s compositions and synthesis can be designed in such a way that interaction forces and volume of interface be-tween phases are maximized in order to achieve the highest damping.
Many researchers have studied the damping behavior of polymeric IPN’s and it has been shown to be dependent on intensity of specific interaction4,10-11, crosslinking
den-sity2-9, morphology or phase domain size2,4,8,9-11and
com-e-mail: [email protected]
binations of them2,10. Specific interactions among
non-mis-cible dissimilar components tend to increase damping as it contributes to increase the cohesiveness and the connectiv-ity between phase separated components, while the intra-molecular crosslinking density increases the cohesiveness of each phase and its influence on the damping depends on the morphology of the resultant system. Hence, the pres-ence of crosslinking bonds can limit the chain segmental motion and fine dispersed domain phase can be set by its actuation, and at the same time, also coarse dispersed phase can be formed after copious crosslinking bonds resulting in drastic reduction of intermolecular interaction. In all mate-rials studied it has been proved to be essential to track its morphology, and in heterogeneous polymeric system it has been noted that finer dispersed phase meant higher damp-ing, as an expected result of the increase in damping by the interface of the immiscible system.
The use of hydroxyl-terminated polybutadiene (HTPB) as the flexible polyol component of polyurethane in IPN’s is not usual, although its physical and chemical properties toward fillers, acidic and basic environments, its flexibility at low temperatures and its dielectric resistance are note-worthy. Besides that, its hydrocarbon structure contributes to form an immiscible phase in most of urethane/acrylate IPN systems, usually much polar ones.
The phenomenon of phase separation in IPN’s is gov-erned by polymer components interactions and the kinetic of its formation process2-12. It is well known that a
simul-taneous interpenetrating network (SIN) formation provides the best intersegmental contact for a given composition by reaching simultaneously the gel point of the two mechan-istically independent polymerization reactions resulting in an interlocked polymeric system. The shift and/or broaden-ing of individual thermal transition can be taken as an indicative of the degree of miscibility and/or dispersity of the phases.
In this paper a series of segmented polyurethanes based in different proportions of hydroxyl terminated polybutadi-ene as the soft segment and tolylpolybutadi-ene diisocyanate (TDI) and di-isopropyl-N-aniline (DHPA) as the hard segment (X) were studied in composition with a polyacrylate based on poly(methyl methacrylate) with a constant crosslinking density provided by ethylene glycol dimethacrylate. The polyurethane was crosslinked in the soft segment through the functionality of 2.2 of HTPB. The morphology of IPN’s was analyzed as resultant of the interaction among PA and both phases of PU. We varied systematically the hard to soft segment ratio in the PU component, and for each specific PU composition a whole range of PU/PA IPN’s
was prepared, allowing us to explore the interactions of the acrylic phase with PU’s soft and hard phases.
2. Experimental
2.1. Materials
Hydroxyl terminated polybutadiene (HTPB) from Petroflex (Brazil), Mn = 2700, number average functional-ity fn = 2.2 was dried at 100 °C under 10 mm Hg of pressure for 2 h. Tolylene diisocyanate (TDI) from Bayer (Brazil), mixture of 2,4/2,6 isomers in a 80/20 ratio was distilled at 115 °C under10 mm Hg. N,N-di(2-hydroxyisopropyl)ani-line (DHPA) from Dow Chemical was dried at 100 °C under 10 mm Hg of pressure for 2 h. Methylmethacrylate (MMA) from Nitriflex (Brazil) was washed twice with 5% aqueous NaOH followed by twice with distilled water, dried with CaCl2, filtered and kept over magnesium sulfate
at low temperature and distilled before use at 100-101 °C. Ethyleneglycol dimethacrylate (EGDMA) from Aldrich was dried with CaH2for 24 h and distilled at 110 °C under
10 mm Hg. Benzoyl peroxide from Peróxidos do Brasil was recrystalized from methanol under dry nitrogen.
2.2. IPN preparation
PU Prepolymers: In a 500 ml kettle type reactor equipped with mechanical stirrer, the required amounts of HTPB and TDI were allowed to react for 2 h at 60 °C. PMMA Prepolymers: This was prepared at the same time as the PU prepolymer. MMA monomer, EGDMA (2%) and benzoyl peroxide (0.5% w/w) were mixed, heated to 63 °C and then maintained for 30 minutes. IPNs: The PMMA prepolymer was added to the PU prepolymer and after complete homogenization, the PU chain extender DHPA (containing a drop of the catalyst, dibutyl tin laurate) was added. The material was poured into a vertical glass mold (15 x 20 x 0.2 cm3) and cured at 55 °C, 80 °C and 100 °C,
during 48 h, 48 h and 24 h, respectively. IPN’s of PU and poly(methylmethacrylate-co-ethyleneglycol dimethacry-late) (PA) were prepared having PU/PA ratios of 100/0, 80/20, 60/40, 50/50, 40/60, 20/80 and 0/100.
2.3. Morphological characterization
2.4. Dynamic mechanical thermal analysis (DMTA)
A Rheometrics Scientific DMTA IV was used to per-form bending tests with single cantilever fixtures. Each sample was cut to a small rectangular bar within the follow-ing range of dimensions: length of 23 to 26 mm (±0.05), width of 4 to 8 mm (±0.05), and thickness of 1.5 to 3.0 mm (±0.05). A strain limit of 0.02% and a frequency of 10 Hz were applied in the temperature range from -90 ºC to 170 ºC
at a heating rate of 2 ºC/min. The area under the linear loss area versus temperature was determined by integrating the area limited by a straight baseline traced between the in-flexion points before and after the peak.
3. Results and Discussion
Polyurethane/PMMA SINs were prepared with various hard segments contents (X) and wide range of PU/PA ratios (20/80 to 80/20). Details of preparation have been publish-ed elsewhere13. The composition of some studied SIN’s
materials is shown in Table 1.
Table 1.Composition of SIN’s.
PU/PA X Flexible PU (F) Rigid PU (R) PA
(%) (%) (%) (%)
0/100 - - - 100
100/0 36.5 63.5 36.5
-20/80 36.5 12.7 7.3 80
40/60 36.5 25.4 14.6 60
50/50 36.5 31.75 18.25 50
60/40 36.5 38.1 21.9 40
80/20 36.5 50.8 29.2 20
20/80 15.5 16.9 3.1 80
40/60 15.5 33.8 6.2 60
50/50 15.5 42.25 7.75 50
60/40 15.5 50.7 9.3 40
80/20 15.5 67.6 12.4 20
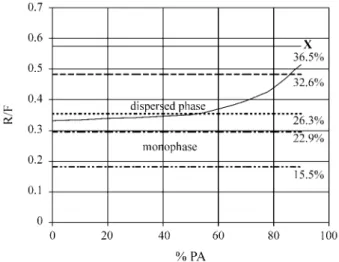
Figure 1.Three-component phase diagram of SIN’s as observed by SEM. Rigid PU: PU’s hard segment, Flexible PU: PU’s HTPB and PA: Crosslinked Poly(methyl methacrylate).
Morphological examination by SEM allowed the con-struction of a three-component phase diagram (Fig. 1) where a boundary line can be drawn between systems with a dispersed phase and monophase systems14.
The observation limit by SEM analysis of these samples was 50 nm. The non-monophasic systems have shown a wide range of domain sizes for the dispersed phase, and accordingly to that size, SIN’s were transparent, translucent or opaque by visual observation. In the Fig. 2, the SIN’s with different compositions in respect to the boundary line are represented, below the line are the monophasic systems and above the line the systems displayed a dispersed phase which domain size increases with the distance from the line to the top. The horizontal straight lines represent the series of SIN’s with the various PU containing different concen-tration of hard segment (X).
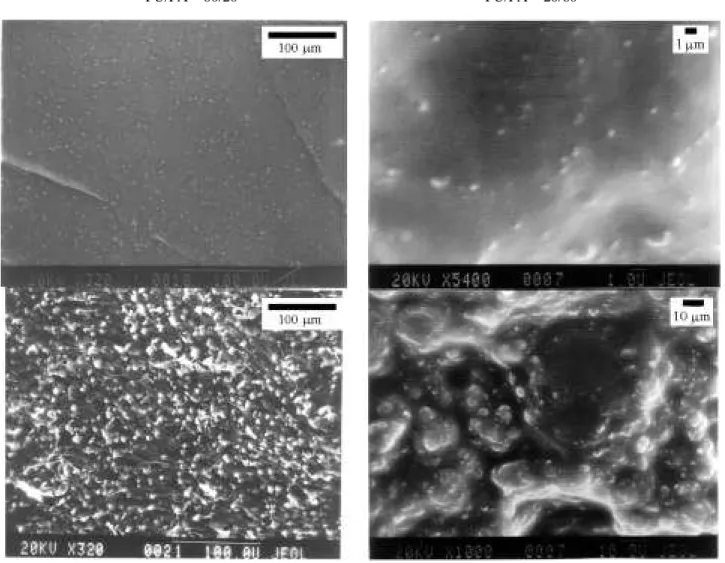
Some features of the SIN’s can be observed in the SEM analysis in Fig. 3, and the overall observed results are in accordance to Fig. 2. For example, in Fig. 3, sample1(with 80% PA andX= 32.6%)(0.2-0.5µm) and sample2(with 80% PA and X = 36.5%) (2-5µm) have a much finer structure compared to sample 3 (with 20% PA and X = 32.6%) (3µm) and sample 4 (with 20% PA and X= 36.5%) (10-15µm), respectively, as expected from graphic in Fig. 2.
In the polymeric systems containing higher concentra-tion of PU hard segment (26.3 % and higher) finer disper-sions were observed for SINs with PA content more than 50% of PA, vitreous matrix, indicating better compatibility than those observed for rubbery matrix SINs. The domain sizes of the observed dispersed phase were virtually the same up to 50 % of PA, however, when PA is the matrix
Figure 3.SEM of SIN’s. From top to bottom; right, PU/PA = 20/80: (1)X= 32.6% (5400X) and (2)X= 36.5% (1000X); left, PU/PA = 80/20: (3) X= 32.6% (320X) and (4)X= 36.5% (320X).
polymer, SIN’s showed a decreasing dispersed phase do-main size as PA amount is increased.
Although rubbery matrix SIN’s presented coarser dis-persed phase by SEM, the almost constant disdis-persed size domain can be seen as a sign of compatibility enhancement between PU and PA, as the increased amount of PA did not have an effect on the dispersed domain size and in the amount of dispersed phase. The inward shift of the PA thermal transition (tan δ) observed in these samples by DMTA is also an indication of that compatibilization proc-ess (Table 2).
The tensile properties of the SIN’s have been discussed elsewhere13. The general behavior of these materials
de-pends on PA content and on the hard segment content in the polyurethane (Fig. 4). Increasing PA content, a sharp increase of tensile strength and a consequent decrease in the elongation of rupture have been seen in the range from 40% to 50% of PA, that was indicative of matrix inversion. Similar transitions were observed by DMTA.
Two series of SINs samples were characterized by DMTA (Table 2). Although some SIN’s samples were homogeneous by SEM, all studied samples have proved to be immiscible or partially miscible by DMTA analysis and all of them have shown individual thermo-mechanical tran-sition for the rubbery and vitreous phases, respectively.
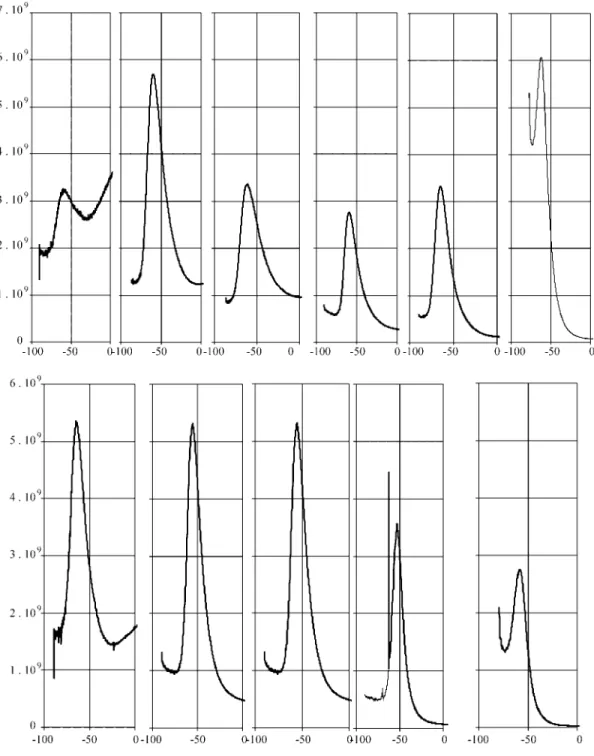
Damping is the most sensitive indicator of all kinds of molecular motions displayed by a polymer in solid state. The loss modulus E” is directly proportional to the heat dissipated per cycle and the area under the linear loss modulusvs.temperature curves is a quantitative
measure-ment of the damping behavior15and can be correlated to
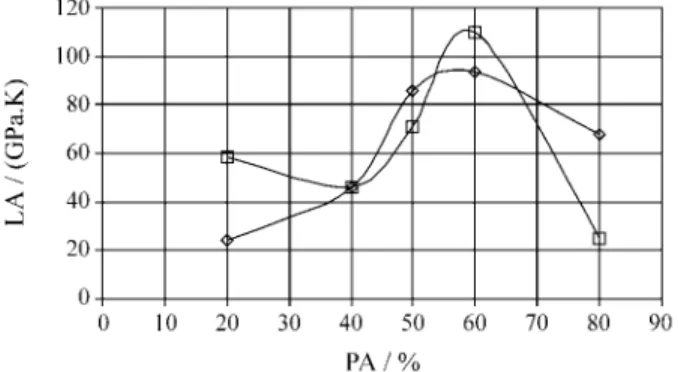
many transitions, relaxation processes, structural heteroge-neities, and the morphology of multiphase and crosslinked systems. The linear loss modulus areas of the rubbery phase were determined (Fig. 5) and a correlation to the SIN composition was plotted (Fig. 6). Both series presented a maximum around PA = 60%, and it is indicative of higher compatibility in the polymeric system.
The increment in the damping observed by the linear loss area of PU soft segment at higher concentration of PA in the SIN’s can be attributed to a higher cohesiveness reached by SIN’s when PU’s hard segments presented the most intimate mixing with the PA component. This can be explained by the preferential mixing of the hard segments with PA compared to the interaction pairs, PU flexible segments-PU rigid segments and PU flexible segments-PA component, due to the rise of specific secondary dipolar interactions and to the segmental molecular interlocking caused by the crosslinking of the PA component, during the early stages of SIN’s formation. Furthermore, it can be observed that the area under the loss modulus versus tem-perature curve is not a linear function of the soft segments concentration in the SIN’s (Fig. 7), but it is rather the result of the synergism among the three components within each SIN sample, and dependent on the connectivity and conti-nuity of phases, so lowest damping areas have been ob-served for the SIN’s with 12.7% of flexible PU-7.3% of rigid PU-80%PA and 20% PA-67.6% of flexible PU-12.4% of rigid PU, when the minor component presented lack of continuity.
4. Conclusion
Simultaneous interpenetrating polymer network sys-tems comprised by crosslinked poly(methyl methacrylate) and crosslinked polyurethane based on hydroxyl
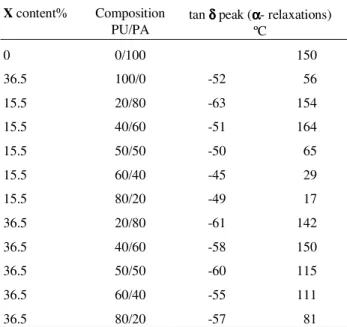
termi-Table 2.Thermal transitions of the samples observed by DMTA.
Xcontent% Composition
PU/PA
tanδδδδpeak (αααα- relaxations) ºC
0 0/100 150
36.5 100/0 -52 56
15.5 20/80 -63 154
15.5 40/60 -51 164
15.5 50/50 -50 65
15.5 60/40 -45 29
15.5 80/20 -49 17
36.5 20/80 -61 142
36.5 40/60 -58 150
36.5 50/50 -60 115
36.5 60/40 -55 111
36.5 80/20 -57 81
nated polybutadiene have been obtained with a wide range of composition. The morphology of each sample was ana-lyzed by SEM and DMTA, along with its mechanical and dynamic-mechanical properties, and the results were inter-preted as a consequence of the interactions present in this ternary system. The crosslinking of the PA vitreous phase and the preferential specific interaction between PA
com-ponent and the hard segments of PU comcom-ponent are respon-sible for the improvement of physical properties. SIN’s samples containing 60% of PA component, independent of Xcontent, presented a clear synergism in these systems and a maximum of damping was observed in conjunction with a finer dispersed phase. The damping maximization is attributed to a higher strength of interaction between
phases, and it is consequence of phase’s interfacial cohe-siveness and increased interface volume, or reduced dis-persed particle sizes.
Acknowledgment
Financial support by Brazilian Agency CNPq is fully acknowledged. S.H.W. thanks FAPESP (99/01783-0) for financial support.
References
1.Nielsen, L.E.; Landel, R.F. Mechanical Properties of Polymers and Composites, 2nd edition, Marcel Dek-ker, Inc, New York, p. 131-232, 1994.
2.Kim, K.R.; An, J.H.; Cho, K.W.; Park, C.E.J. Appl. Polym. Sci., v. 47, p. 305-322, 1993.
3.Peng, W.; Li, S.J. Appl. Polym. Sci., v. 58, p. 967-971,
1995.
4.Yu, X.; Gao, G.; Wang, J.; Li, F.; Tang, X.Polym. Int.,
v. 48, p. 805-810, 1999.
5.Patri, M.; Samui, A.; Deb, P.C.J.Appl. Polym. Sci., v.
48, p. 1709-1716, 1993.
6.Tung, C.J.; Hsu, T.C.J.J. Appl. Polym. Sci., v. 46, p.
1759-1773, 1992.
7.Fay, J.J.; Murphy, C.J.; Thomas, D.A.; Sperling, L.H.
Polym. Eng. Sci., v. 31, p. 1731-1741, 1991.
8.Chen, Q.; Ge, H.; Chen, D.; He, M; Yu, X.J. Appl. Polym. Sci., v. 54, p. 1191-1197, 1994.
9.Hourston, D; Schäfer, F-U;J. Appl. Polym. Sci., v. 62,
p. 2025-2037, 1996.
10.Hu, R.; Dimonie, V.L.; El-Aasser, M.S.; Pearson, R.A.; Hiltner, A.; Mylonakis, S.G.; Sperling, L.H.J. Polym. Sci. B: Polym Phys., v. 35, p. 1501-1514, 1997.
11.Chern, Y.C.; Tseng, S.M.; Hsieh, K.H.;J. Appl. Po-lym. Sci., v. 74, p. 335-328, 1999.
12.Xu, M.; MacKnight, W.J.; Chen, C.H.Y.; Thomas, E.L.Polymer, v. 28, p. 2183-2189, 1987.
13.Wang, S.H.; Zawadzki, S.; Akcelrud, L.;J. Polym. Sci. B: Polym Phys., v. 38, p. 2861-2872, 2000.
14.Wang, S.H.; Zawadzki, S.; Akcelrud, L. Mat. Sci. Forum, v. 282-283, p. 289-294, 1998.
15.Chang, M.C.O.; Thomas, D.A.; Sperling, L.H.J. Po-lym. Sci.: Part B; PoPo-lym. Phys., v. 26, p. 1627-1640,
1988.
FAPESP helped in meeting the publication costs of this article
Figure 7.Linear loss modulus area in function of PU flexible segments content. ( )X= 36.5% and (◊)X= 15.5 %.