ISSN 1517-7076 artigo e11859, 2017
Autor Responsável: Glaucea Warmeling Duarte Data de envio: 01/08/2016 Data de aceite: 05/04/2017
10.1590/S1517-707620170003.0193
Estudo do efeito dos parâmetros de síntese
na condutividade elétrica do compósito
fluoreto de polivinilideno / polianilina
Study of the effect of synthesis parameters in
the electrical conductivity of the composite
poly (vinylidene fluoride) / polyaniline
Glaucea Warmeling Duarte1,3, Angélica Melo Naspolini 2,Camila Gaspodini Tachinski3, Eloisa Contessi Consenso2, Josiane Maria Moneron de Mello4, Luciano Luiz Silva4 e Márcio Antônio Fiori4
1 Núcleo de Pesquisa em Tecnologia e Informação – NUTEC – UNIBAVE, 88870-000, Orleans, SC. e-mail: [email protected]
2
Programa de Pós Graduação em Ciência e Engenharia de Materiais – UNESC, 88806-000, Criciúma, SC. e-mail: [email protected]; [email protected]
3
Programa de Pós Graduação em Engenharia Química – UFSC, 88040-900, Florianópolis, SC. e-mail: [email protected]
4
Programa de Pós Graduação em Tecnologia e Gestão da Inovação – UNOCHAPECÓ, 89809-000, Chapecó, SC. e-mail: [email protected]; [email protected]; [email protected]
ABSTRACT
The electroactive polymershave been the subject of many studies in the last decade, mainly because its unique properties. They are used in composite structures, which allow its application in many fields, as for example, sensors and artificial muscles. The electrical properties of these composites are influenced by the doping state of the electroactive polymer, which is controlled during its synthesis process. Therefore, this work aimed to evaluate how the synthesis parameters influence the electrical conductivity of the composite PANI/PVDF.The synthesis parameters evaluated were the concentrations of monomer, initiator and dopant, and the synthesis time. PANI was obtained by chemical polymerization in a solution containing PVDF and the solvent DMF. To evaluate possible changes in the chemical structure of the composite, the samples were submitted to FT-IR and XRD analysis. It was possible to conclude that the parameters relative to the produc-tion of PANI directly influence in the electrical conductivity of the composite. So, the sample produced with major quantities of monomer, initiator and dopant were statistically significant to increase the electrical prop-erty of the composite.
Keywords: Conducting polymers; polyaniline; poly (vinilidene fluoride); electrical conductivity; polymer composites.
1. INTRODUCTION
For many years, several types of electroactive polymers (EAPs), which are a class of materials that exhibit coupled electro-mechanical behavior at large strains, have been studied [1][2]. The predominant class of organic electroactive materials employed in these devices consist of p-conjugated polymers. These poly-mers present p-electron delocalisation, arising from conjugated double bonds in the polymer backbone. They are usually termed conducting polymers, since they can show very high electrical conductivity in doped states (p-doping or n-doping), although being insulators when undoped (neutral state)[3].
EAPs present innumerous advantages over other class of materials, as for example: lightweight, pliable, quiet and shatterproof and boasting electromechanical properties that can be tailored to meet the needs of specific applications. In addition, electroactive polymers offer many of the typical advantages of polymers, such as ease of manufacture and formability [1]. They have also gained particular attention due to properties such as biocompatibility and biodegradability[9].
Among the EAPs, polyaniline (PANI) is by far the most investigated one, due to its particular elec-trical and optical properties. It is easily synthesized chemically and electrochemically, easily doped by pro-tonic acids, chemically stable at room temperature conditions, high conductivity, and low cost [4][10][11]. The aniline polymers also have controllable electrical conductivity, environmental stability and interesting redox properties associated with the nitrogen chains.
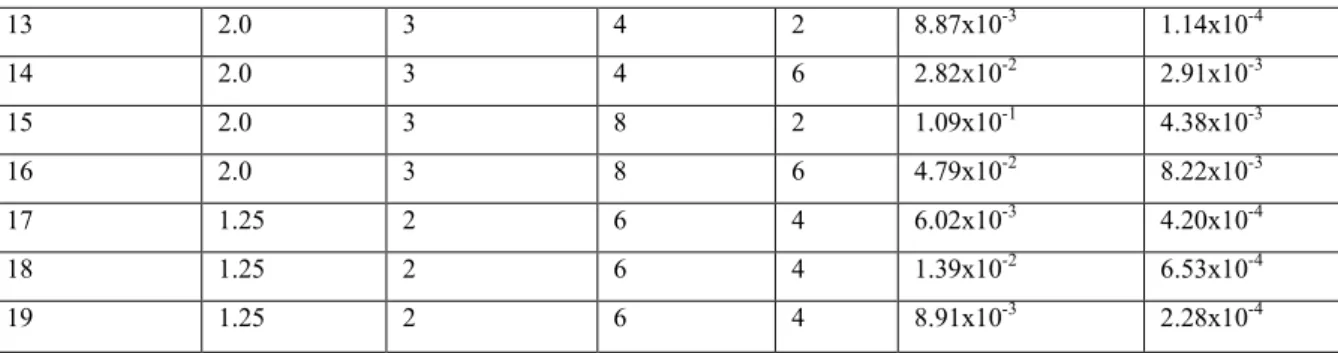
The aniline polymers have the general formula [(-B-NH-B-NH-)y(-B-N=Q=N-)1-y]x, in which B and Q denote the C6H4 rings in the benzenoid and quinonoid forms, respectively. Thus, the aniline poly-mers are basically poly(p-phenyleneamine)s, in which the intrinsic oxidation states can vary from that of the fully reduced leucoemeraldine (y = 1), through that of the 50% intrinsically oxidized pernigraniline (y = 0). The polymer can achieve a highly conductive state either through protonation (doping) of the imine ni-trogens (=N-) or through the oxidation of the amine nini-trogens (-NH-) in its fully reduce leucoemeraldine state[17].
One disadvantage of chemically obtained PANI is its low solubility in most of the organic solvents and low fusibility[13], thus making it difficult to prepare cast films and so on. On account of this, blends and composites with other kind of polymers have received great attention since there is a possibility to combine the excellent mechanical properties and high processability of the usual polymers with the electric conductivity of conducting polymers, consequently increasing the technological potential of these materials [4].
There are several conventional polymers used in the preparation of conductive blends and compo-sites. Among these polymers, poly(vinylidene fluoride) (PVDF) has attracted much interest because it is easily processable and highly flexible, with excellent mechanical[13], piezoelectric and pyroelectric proper-ties [14,15], electrochemical stability, affinity to electrolyte solutions and exhibits ionic conductivity in the range of 10−4 to 10−3 Scm−1 at room temperature [16].
The electroactive properties of this material heavily depend on the phase content, microstructure and crystallinity degree of the material, which in turn depend on the processing conditions [17]. PVDF ex-ists in four different phases. The commonly occurring α-phase is monoclinic and has non-polar structure. Out of four phases, -phase (orthorhombic) has polar structure and exhibits piezoelectric effect [14]. In particular, the microstructure of α-PVDF plays an important role in the α- to -phase transformation by stretching. This stretching process is the typical way for obtaining the most common electroactive poly-morph and deeply influences the properties of the -phase [17]. Often in the form of films, PVDF is me-chanically drawn to orient its molecules and polarized to yield strong piezoelectric behavior. Thus, the ap-plication of an electric field across the thickness of the film (in the direction of polarization) will cause a decrease in thickness due to the reorientation of its molecules and net polarization. Conversely, application of a physical force will yield an electrical response at the surface of the polymer [1].
Blends or composites of PVDF and PANI have been investigated in recent literature because of the combination of the excellent mechanical properties and resistance to chemicals of PVDF with the high elec-trical conductivity of PAni [18].
In the literature one can find a variety of methods to achieve the polymerization of PANI in con-junction with PVDF. Among these methods, the one with the best combination of processability, thermal stability and homogeneity is where aniline is polymerized in a solution of in situ PVDF [4,13].
By this time, this work aims to study the effect of synthesis parameters in the electrical conductivity of a PANI/PVDF composite. The synthesis parameters studied were the concentration of monomer (aniline), the concentration of oxidizing agent (ammonium persulfate), the concentration of doping agent (TSA) and the time of synthesis. These parameters were chosen because they may influence in the amount of doped aniline present in the composite, what will influence in the electrical characteristics of the same.
2. MATERIALS AND METHODS
The monomer aniline, p-toluene sulfonic acid (TSA), ammonium persulfate and dimethylformamide-N,N (DMF) were purchased from Vetec Quimica Fina-Brasil and were used without previous purification. The PVDF was purchased in form of pellets by Arkema Química. The solvents were purchased from different providers.
experi-mental factorial planning, type 24 with three central points. The variables studied in the planning were: (1) the concentration of aniline, with minimum value of 0.5 ml, maximum value of 2.0 ml and central value of 1.25 ml; (2) the concentration of ammonium persulfate, with minimum value of 1.0 g/20 ml, maximum value of 3.0 g/20 ml and central value of 2.0 g/20 ml; (3) the concentration of p-toluene sulfonic acid (TSA) with minimum value of 4.0 g/20 ml, maximum value of 8.0 g/20 ml and central value of 6.0 g/20 ml; and (4) the time of synthesis, with minimum value of 2 hours, maximum value of 6 hours and central value of 4 hours.
To synthesize the composite it was used the following procedure: A solution of PVDF and DMF, with a concentration of 10.0 weight %, was maintained at 70.0 ºC in constant stirring until homogenization and then was cooled until about 25.0 ºC (this solution was keep constant in all the experiments). It was added, to the cooled solution, the amount of aniline (monomer) of the respective experiment, ranging from 0.5, 1.25 and 2.0 ml. In a separated container it was prepared the second solution, which contains 20.0 ml of DMF, the amount of TSA (doping agent) and ammonium persulfate (oxidizing agent), which can range from 4.0, 6.0 and 8.0 g for TSA and 1.0, 2.0 and 3.0 g for ammonium persulfate. The second solution was slowly added to the first solution, under constant stirring. After the end of the addition of the second solution, it was added 44.5 ml of chloroform in all the experiments. The synthesis procedure was maintained for 2.0, 4.0 and 6.0 hours. At the end of the synthesis, the solution was filtered and washed with distilled water until the filtrate becomes colorless. This filtrate is dried in oven at 70.0 ºC for 24.0 hours.
The samples obtained in all the experiments were submitted to Fourier transform infrared spectroscopy (FT-IR) and X-Ray Diffraction (XRD) to analyze any changes in the molecular structure of the composite. The FT-IR was obtained in an IRPrestige-21 (SHIMADZU) with wavenumber ranging between 400 – 4000 cm-1. The diffractograms were obtained in a XRD-6000 (SHIMADZU), copper target, with angle (2θ) rang-ing between 0 – 60º.
The electrical conductivity of all the samples was measured by the four probe method, in other words, using four electrodes. In this method the samples are pressed in tablets. These tablets are put in contact with four equally spaced electrical contacts, which are maintained under constant pressure over the samples. In the outer ends are connected to a source of DC voltage (0.3V) which in turn is connected in series with a multi-meter which measures the current between these ends. The internal ends are connected to a voltmulti-meter that monitors the voltage between them. So, based on calculations that involve electrical current and the measured voltage it is possible to obtain the resistivity of the samples [19]. From each experiment it was obtained 5 tablets, which were all submitted to this test.
3. RESULTS
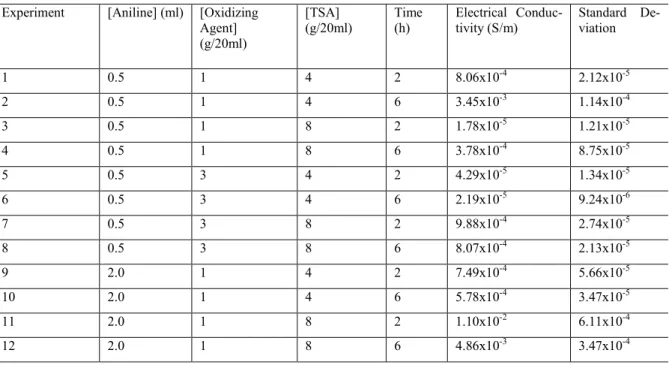
Table 1 shows the experimental matrix of responses for electrical conductivity for all the samples testes.
Table 1: Experimental matrix of response.
Experiment [Aniline] (ml) [Oxidizing Agent] (g/20ml)
[TSA] (g/20ml)
Time (h)
Electrical Conduc-tivity (S/m)
Standard De-viation
1 0.5 1 4 2 8.06x10⁻⁴ 2.12x10⁻⁵
2 0.5 1 4 6 3.45x10⁻³ 1.14x10⁻⁴
3 0.5 1 8 2 1.78x10⁻⁵ 1.21x10⁻⁵
4 0.5 1 8 6 3.78x10⁻⁴ 8.75x10⁻⁵
5 0.5 3 4 2 4.29x10⁻⁵ 1.34x10⁻⁵
6 0.5 3 4 6 2.19x10⁻⁵ 9.24x10⁻⁶
7 0.5 3 8 2 9.88x10⁻⁴ 2.74x10⁻⁵
8 0.5 3 8 6 8.07x10⁻⁴ 2.13x10⁻⁵
9 2.0 1 4 2 7.49x10⁻⁴ 5.66x10⁻⁵
10 2.0 1 4 6 5.78x10⁻⁴ 3.47x10⁻⁵
11 2.0 1 8 2 1.10x10⁻² 6.11x10⁻⁴
13 2.0 3 4 2 8.87x10⁻³ 1.14x10⁻⁴
14 2.0 3 4 6 2.82x10⁻² 2.91x10⁻³
15 2.0 3 8 2 1.09x10⁻¹ 4.38x10⁻³
16 2.0 3 8 6 4.79x10⁻² 8.22x10⁻³
17 1.25 2 6 4 6.02x10⁻³ 4.20x10⁻⁴
18 1.25 2 6 4 1.39x10⁻² 6.53x10⁻⁴
19 1.25 2 6 4 8.91x10⁻³ 2.28x10⁻⁴
This matrix shows that the values of electrical conductivity range from 1.78x10⁻⁵ S/m, for the experi-ment with minor concentration of aniline and oxidizing agent and major concentration of TSA and time of synthesis (experiment 03), to 1.09x10⁻¹ S/m, for the experiment with major concentration of aniline, oxidiz-ing agent, TSA and time of synthesis (experiment 15).
These results are better represented in Fig. 1, in which it is also possible to verify that the values of electrical conductivity for the experiments with minor concentration of aniline (experiment 01 to 08) remain almost constant and with a low value. Although, for the experiments with major concentration of aniline (ex-periment 09 to 16) there is an increase in the electrical conductivity and the values obtained are nomore con-stant. For these samples, the higher values of electrical conductivity are obtained for the samples synthesized with higher concentration of oxidizing agent.
Figure 1: Electrical conductivity for the samples of the statistical experimental factorial planning.
The results obtained in Table 1 and Fig. 1 showed that the electrical conductivity of the samples change depending on the synthesis procedure used, although it is still necessary to verify if these changes are statistically significant.
Table 2 shows the Analysis of Variance (ANOVA) for the SS Residual model, in which it was ob-tained a value for R2 of 0.96. The statistical results showed significance for the concentration of aniline, con-centration of oxidizing agent and concon-centration of TSA. The results also showed significance for the interac-tion between (1) the concentrainterac-tion of aniline and oxidizing agent and for (2) the concentrainterac-tion of aniline and TSA. The statistical tables presented in this paper show only the significant variables.
Table 3 shows the matrix of estimated effects, in which the concentration of aniline, concentration of oxidizing agent and concentration of TSA had all positive effects, what indicates that, increasing the
age of any of the three components promotes an increase in the electrical conductivity. Table 3 also shows that the interaction between (1) concentration of aniline and oxidizing agent and (2) the concentration of ani-line and TSA presented positive effects, indicating synergism between these variables.
The statistical significance for the concentration of aniline in the increase of the electrical conductivity of the samples can be explained by the higher amount of aniline in the solution, which provides a higher amount of monomers and, consequently, a higher quantity of polyaniline synthesized and dispersed in the PVDF matrix. The significance for the concentration of oxidizing agent (ammonium persulfate) occurs due to the rate of oxidation of the chains of polyaniline, which needs to be partially oxidized to present conductive characteristic [4]. In its turn, the concentration of TSA, which is used as the doping agent, is also significant because the increase in its quantity also increases the doping rate of the polyaniline, which increases the elec-trical conductivity.
Table 2: Analysis of variance (ANOVA)
SS Df MS F P
(1) [Aniline] 0.002617 1 0.002617 23.867731 0.008129
(2) [Oxidizing Agent] 0.001892 1 0.001892 17.252846 0.014218
(3) [TSA] 0.001093 1 0.001093 9.965219 0.034290
1 by 2 0.002015 1 0.002015 18.378028 0.012777
1 by 3 0.001164 1 0.001164 10.617638 0.031126
Table 3: Estimated effects
Effect Std.Err. t(4) p -95% +95% Coeff.
Mean/Interc. 0.1297 0.00240 5.40009 0.00569 0.00630 0.01964 0.01297 (1) [Aniline] 0.02558 0.00524 4.88546 0.00813 0.01104 0.04012 0.01279 (2) [Oxidizing Agent] 0.02175 0.00524 4.15365 0.01422 0.00721 0.03629 0.01087 (3) [TSA] 0.01653 0.00524 3.15677 0.03429 0.00199 0.03107 0.00826 1 by 2 0.02245 0.00524 4.28696 0.01278 0.00791 0.03698 0.01122 1 by 3 0.01706 0.00524 3.25847 0.03113 0.00252 0.03160 0.00853
The analysis of variance and the estimated effects also show that there is a positive interaction be-tween the concentration of aniline and the concentration of oxidizing agent. To be conductive, the insulated emeraldine form of polyaniline, that is a partially oxidized form of polyaniline (Y ≈ 0.5), shown in Fig. 2, needs to be synthesized and after doped into an emeraldine salt. So, the synergism between the concentration of aniline and the concentration of oxidizing agent happens due to the need of a partially oxidation of the chain of polyaniline, that will lead to the formation of insulated emeraldine form.
Figure 2: Molecular structure of polyaniline.
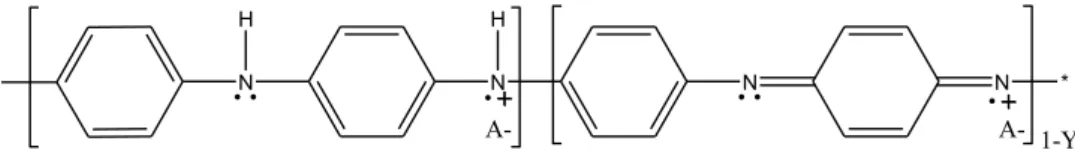
Similarly, there is a positive interaction between the concentration of aniline and the concentration of TSA (the doping agent). This interaction occurs because with the increase in the amount of monomers of aniline, there are more active sites for the interaction with the doping agent, so it is possible to incorporate a higher quantity of TSA. The doping agent interacts with the molecular structure of polyaniline as it is shown in Fig. 3.
Figure 3: Interaction of doping agent (A-) with the molecular structure of polyaniline.
N H
N H
* N N *
1-Y
N H
N H
* N N *
1-Y
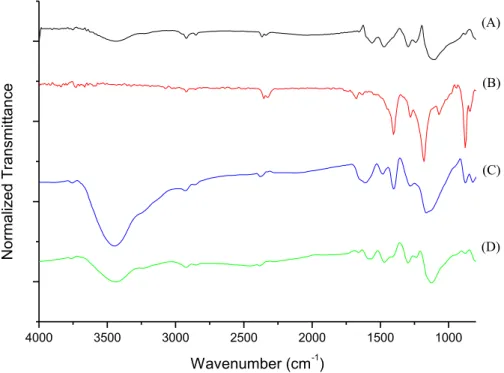
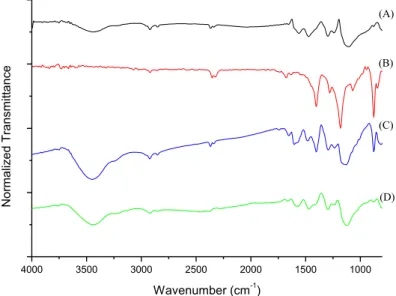
A-To verify the structural changes that caused the increase in the electrical conductivity of the samples tests, they were submitted to FT-IR and DRX analysis. Fig. 4 shows a FT-IR comparison for the samples obtained with the same concentration of aniline (experiments 08 and 15) with the analysis of pure PANI and pure PVDF.
In the spectrum of pure PANI, Fig. 4(a), there are characteristics signs for the N-H stretching at about 3430 cm-1 and for aromatic C-H stretching at 2920 cm-1. The peak at 1494 cm-1 corresponds to the frequency of the benzenoid ring stretching and the peak at 1483 to 1585 cm-1 corresponds to the stretching quinoid ring [4]. Fig. 4(b) shows the spectra for pure PVDF, in which it is possible to verify characteristics signs with wavenumber below 2000 cm-1. The peak in the wavenumber 840 cm-1 refers to the stretch of -phase of PVDF and the peak at 1170 cm-1 refers to the stretching of the C-F bond present in the polymer chain of PVDF [4]. In the spectrums of the samples 08 and 15 it is possible to verify the existence of characteristic peaks referred to PANI and PVDF, as it is shown by Fig. 4(c) and Fig. 4(d), respectively.
Figure 4: FT-IR spectra (a)PANI, (b)PVDF, (c)Exp. 08 and (d)Exp. 15
Comparing the FT-IR spectra obtained for both experiments, it is evident that in the experiment with higher concentration of aniline monomers (experiment 15) the peak associated to the groups N-H stretching of the PANI molecules is more pronounced than the same peak obtained in the experiment with lower centration of the PANI (Experiment 8). The increase of this peak proves that the synthesis with higher con-centration of aniline provides higher amounts of polyaniline molecules in the compound PANI/PVDF.
The FTIR spectrum also shows the increase of the peak associated with the -phase of PVDF in 840 cm-1 for the compound synthetised with higher concetration of the aniline monomer (Experiment 15). This result shows that higher amounts of PANI molecules in the compound PANI/PVDF favors the formation of
-phases of PVDF.
From FTIR results is possible to conclude that the increase of the amount of polyaniline molecules and of -phases of PVDF in the compound PANI/PVDF favors the increase of the electrical conductivity. By Table 1, one can observe that the result of electrical conductivity is higher for the experiment 15, which has the higher concentration of aniline.
The comparison of DRX analysis for the samples 08 and 15 with pure PANI and pure PVDF are shown in Fig. 5. The characteristic diffraction peaks for PVDF in -phase occur in 2θ equal 19.9 and 18.3º. For PANI the characteristics peaks are present in 2θ equal 28.8, 25.2, 18.8 e 15.2° [13]. Figure 05 shows that there is an increase in the intensity of diffraction peaks characteristics of PANI for the experiment 15, which is present in higher amount when compared with experiment 08, demonstrating higher crystallinity and,
con-4000 3500 3000 2500 2000 1500 1000
N
o
rma
lize
d
T
ra
n
smi
tt
a
n
ce
Wavenumber (cm-1)
(A)
(B)
(C)
sequently, higher electrical conductivity.
Figure 5: Diffractograms of Exp.08, Exp.15, PANI and PVDF
To evaluate the effect of the oxidizing agent in the electrical conductivity of the composites a compar-ison between experiment 12 and 15 were conducted, in which the only significant variable that ranges is the concentration of oxidizing agent. When the concentration of oxidizing agent is higher, a higher quantity of polyaniline chains are formed in the solution, and thus, the electrical conductivity tends to increase. Similar results were found by Ruckenstein [20-22], but in this case, in composites of PANI with PMMA, PS and PC.
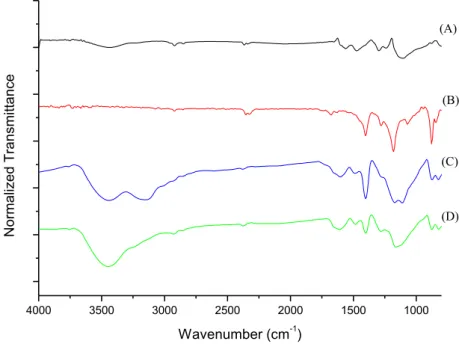
The FT-IR of Fig. 6 shows the complete FT-IR of experiment 12 and 15 in comparison with pure PANI and pure PVDF. The peak in the wavenumber 817 cm-1 corresponds to the C-H bond of PANI, and the peak in 880 cm-1 is related to the -phase of PVDF [14]. In the experiment 12, which has higher amount of oxidizing agent in comparison to experiment 15, the peak related to PANI is more evident.
Figure 6: FT-IR spectra (a) PANI, (b) PVDF, (c) Exp. 12 and (d) Exp. 15
4000 3500 3000 2500 2000 1500 1000
N
o
rma
lize
d
T
ra
n
smi
tt
a
n
ce
Wavenumber (cm-1)
(A)
(B)
(C)
(D)
14 16 18 20 22 24 26 28 30
0,0 0,2 0,4 0,6 0,8 1,0
N
o
rma
lize
d
I
n
te
n
si
ty
2
This demonstrated that for the experiment 12 there is low production of PANI, due to the lower con-centration of oxidizing agent used, and, consequently, the electrical conductivity of sample 12 is lower than of sample 15. In about 1406 cm-1 is the peak related to PVDF, which appears more evident for the experi-ment 12 than for the experiexperi-ment 15. This proves that in the experiexperi-ment 15 the ratio PANI/PVDF is higher (lower quantity of PVDF formed).
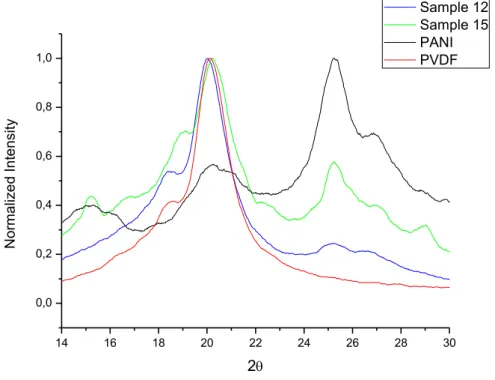
Fig. 7 shows the DRX of the samples produced in the experiments 12 e 15 in comparison with pure PANI and pure PVDF. As the sample of experiment 12 has a lower amount of oxidizing agent, that are fewer molecules of initiator to start the polymerization of PANI so, that are a lower quantity of PANI formed in the solution.
Figure 7: Diffractograms of Exp.12, Exp.15, PANI and PVDF
The role of the acid in the polymerization is doping the polymer to that it becomes conductor. Low acid concentration do not provide the sufficient doping to that the polymer become conductor and high acid concentration results in the degradation of the polymer chains, and consequently loss of conductivity. The statistical experimental factorial planning showed that the increase in the concentration of acid increases the electrical conductivity, but only between the concentrations studied in this planning.
The effect of TSA in the electrical conductivity of the composites was studied taking into account the experiments 06 and 08, in which the only significant variable that ranges is the concentration of TSA, which is used as doping agent. In low concentration of doping agent, the PANI formed is not totally doped, which influence in the electrical conductivity of the composite.
The spectrum showed in Fig. 8 shows the comparison of experiment 06 and 08 with pure PANI and pure PVDF. The first square of Fig. 8 shows the complete spectrum of all the samples. The second square shows the characteristic peaks of doped-PANI, in the wavenumber 1160 cm-1 relative to the N=Q bond, and the characteristic peaks of PVDF, in the wavenumber 1170 cm-1 related to the C-F bond. In the FT-IR of ex-periment 08 the peaks related to PANI are more evident than in the sample 06, probably due to the higher concentration of doping agent. The peak in 1406 cm-1 is characteristic of PVDF and is more detached in sample 06 than in sample 08 to the same amount of PANI. This probably occurs due to the lower amount of doped-PANI present in sample 06, which decreases the electrical conductivity.
14 16 18 20 22 24 26 28 30
0,0 0,2 0,4 0,6 0,8 1,0
N
o
rma
lize
d
I
n
te
n
si
ty
2
Figure 8: FT-IR spectra (a) PANI, (b) PVDF, (c) Exp. 06 e (d) Exp. 08
By the study of crystallinity of both samples (06 and 08), showed in Fig. 9, for a lower concentration of acid (04 g) more crystalline phases are present. Although, the sample with the higher concentration of acid presented the higher conductivity. This can be explained by the effective doping process, in which the higher concentration used was efficient in doping PANI. And, as the quantity of PANI formed is equal in both ex-periments, one can conclude that, increasing the doping rate of PANI decreases the crystallinity degree. It is also possible to conclude that the crystallinity degree and the doping process compete in the electrical con-ductivity of samples.
Figure 9: Diffractograms of Exp.08, Exp.06, PANI e PVDF
4000 3500 3000 2500 2000 1500 1000
N
o
rma
lize
d
T
ra
n
smi
tt
a
n
ce
Wavenumber (cm-1)
(A)
(B)
(C)
(D)
14 16 18 20 22 24 26 28 30
0,0 0,2 0,4 0,6 0,8 1,0
N
o
rma
lize
d
I
n
te
n
si
ty
2
The statistical experimental factorial planning showed that there is a positive interaction between (1) the concentration of aniline and the concentration of oxidizing agent, and (2) the concentration of aniline and the concentration of TSA. The first interaction occur due to that an increase in the concentration of aniline and oxidizing agent provides more chains of polyaniline with morphological form of emeraldine, that is the partially oxidized of the conductive form of polyaniline.
The second interaction occurs due to the percentage of doping agent, that provides an efficient doping of polyaniline, and so, an increase in the electrical conductivity.
4. CONCLUSÕES
This work studied the influence of synthesis parameters in the electrical conductivity of the composite PANI/PVDF. By the statistical experimental factorial planning used it was possible to conclude that, the con-ductivity of the composite depends on the concentration of aniline, concentration of oxidizing agent (ammo-nium persulfate) and the concentration of doping agent (TSA). There is also two synergistic interactions: (1) concentration of aniline and concentration of oxidizing agent and (2) the concentration of aniline and the concentration of doping agent.
So, as expected, the experiment that provided the best results of electrical conductivity was the exper-iment 15, in which was used the higher amount of aniline, oxidizing and doping agents.
5. BIBLIOGRAFIA
[1] BIDDISS, E.,CHAU, T., “Electroactive polymeric sensors in hand prostheses: Bending response of an ionic polymer metal composite”, Medical Engineering & Physics, v. 28, pp. 568-578, 2006.
[2] ZÄH,D., MIEHE,C., “Multiplicative electro-elasticity of electroactive polymers accounting for microme-chanically-based network models”, Computer Methods in Applied Mechanics and Engineering, v. 286, pp. 394-421, 2015.
[3] CARPI, F., DE ROSSI, D., “Colours from electroactive polymers: Electrochromic, electroluminescent and laser devices based on organic materials”, Optics and Laser Technology, v. 38, pp. 292-305, 2006. [4] MALMONGE, L.F., LOPES, G.A., LANGIANO, S.C., et al., “A new route to obtain PVDF/PANI con-ducting blends”, European Polymer Journal, v. 42, pp. 3108–3113, 2006.
[5] BAI, H., CHEN,Q., LI, C., et al., “Electrosynthesis of polypyrrole/sulfonated polyaniline composite films and their applications for ammonia gas sensing”, Polymer, v. 48, pp. 4015–4020, 2007.
[6] HU, J., “Shape memory polymers with novel functions: electro-active, magnetically-active, light-adaptive and phase change materials”, In: Woodhead Publishing Series in Textiles, Advances in Shape Memory Poly-mers, pp. 231-258, 2013.
[7] FOURATI, N., BLEL, N., LATTACH, Y., et al., “Chemical and Biological Sensors from Conducting and
Semiconducting Polymer”, In: Reference Module in Materials Science and Materials Engineering, 2016. [8] GIZDAVIC-NIKOLAIDIS, M., et al., “Evaluation of antioxidant activity of aniline and polyaniline”,
Current Applied Physics, v. 4, pp. 343-346, 2004.
[9] GAIHRE, B., ALICI, G., SPINKS, G.M., et al., “Synthesis and Performance Evaluation of Thin film
PPy-PVDF multilayer Electroactive Polymer Actuators”, Sensors and Actuators A: Physical, v. 165; pp. 321-328, 2011.
[10] HU, H., HECHAVARRı́A, L., CAMPOS, J., “Optical and electrical responses of polymeric electr o-chromic devices: effect of polyacid incorporation in polyaniline film”, Solid State Ionics, v. 161, pp. 165-172, 2003.
[11] PEREIRA,V.R., ISLOOR, A.M., BHAT, U.K., et al., “Preparation and antifouling properties of PVDF ultrafiltration membranes with polyaniline (PANI) nanofibers and hydrolysed PSMA (H-PSMA) as addi-tives”, Desalination, v. 351, pp. 220-227, 2014.
[12] WANG, P., TAN, K.L., KANG, E.T., et al., “Preparation and characterization of semi-conductive poly(vinylidene fluoride)/polyaniline blends and membranes”, Applied Surface Science, v. 193, pp. 36-45, 2002.
[14] RATHOD, V.T., MAHAPATRA, D.R., JAIN, A., et al., “Characterization of a large-area PVDF thin film for electro-mechanical and ultrasonic sensing applications”, Sensors and Actuators A: Physical, v. 163, pp. 164-171, 2010.
[15] SALIMI, A., YOUSEFI, A.A., “Analysis Method: FTIR studies of -phase crystal formation in stretched PVDF films”, Polymer Testing, v. 22, pp. 699-704, 2003.
[16] GOPALAN, A.I., et al., “Development of electrospun PVdF–PAN membrane-based polymer electro-lytes for lithium batteries”, Journal of Membrane Science, v. 325, pp. 683-690, 2008.
[17] SILVA, M.P., et al., “α- and -PVDF: Crystallization kinetics, microstructural variations and thermal behavior”, Material Chemistry and Physics, v. 122, pp. 87-92, 2010.
[18] MARTINS, J.N., KERSCH, M., ALTSTÄDT,V., et al., “ Poly(vinylidene fluoride)/polyaniline/carbon nanotubes nanocomposites: Influence of preparation method and oscillatory shear on morphology and elec-trical conductivity”, Polymer Testing, v. 32, pp. 1511-1521, 2013.
[19] GIROTTO, E.M., SANTOS, I.A., “Medidas de resistividade eĺtrica dc em sólidos: como efetú-las corretamente”, Química Nova, v. β5, pp. 6γ9-647, 2002.
[20] LI, N., XIAO, C., AN, S., HU, X., “Preparation and properties of PVDF/PVA hollow fiber membranes”,
Desalination, v. 250, pp. 530-537, 2010.
[21] SHI, L., WANG, R., CAO, Y., et al., “Fabrication of poly(vinylidene fluoride-co-hexafluropropylene) (PVDF-HFP) asymmetric microporous hollow fiber membranes”, Journal of Membrane Science, v. 305, pp. 215-225, 2007.