INTRODUCTION
Clay plays a predominant role in human life and their value is recognized in many economic branches, agriculture, civil engineering and environmental studies [1-4]. This is largely because of their wide-ranging properties, high resistance to atmospheric conditions, geochemical purity, and easy access to their deposits near the earth’s surface and low price [5]. In developed countries, industrial uses of clays have many applications such as coating and iller pigment for paper, iller for paint, rubber and plastics, formulation additives in food, insecticides, cosmetics, pharmaceutics, fertilizers and soil correctors, and also as a major component in ceramics
[6]. Clays are natural materials abundantly found and largely used by the prehistoric civilization to make household utilities. Presently, they are still used in the manufacturing of ceramic products such as bricks, porcelain, sanitary ware, loor and rooing tiles and, also used in various industrial applications.
As a basis of traditional and modern ceramic fabrication, raw material selection plays a vital role in the inal product design. The inal product is strongly inluenced by chemical and mineralogical compositions and particle size distributions [7]. Therefore, the knowledge of above mentioned properties of the natural clay materials is of great interest since it provides useful information in the selection
Characteristics of some clay materials from Tamilnadu,
India, and their possible ceramic uses
(Características de algumas argilas de Tamilnadu,
India, e seus possíveis usos cerâmicos)
C. Manoharan1, P. Sutharsan1*, S. Dhanapandian1, R. Venkatachalapathy2 1Department of Physics, Annamalai University, Annamalainagar- 608 002, India 2Faculty of Marine sciences, Annamalai University, Parangipettai- 608 502, India
Abstract
X-ray luorescence, themogravimetric-differential thermal analysis, Fourier Transform Infrared spectroscopy, X-ray diffraction, particle size analysis and Atterberg limits were used to study physico-chemical, mineralogical and thermal properties of two types of clays from four different locations of Tamilnadu, India. The chemical and mineralogical compositions of these clays differ considerably. The mineralogy indicated that the alluvial clays (G1 and G2) comprise highly quartz, illite, kaolinite, plagioclase and small amount of chlorite. The red clays (R1 and R2) were also rich in quartz, well-ordered kaolinite and abundant Fe-bearing minerals such as goethite and hematite. With respect to chemical composition, the G1 and G2 clays contained high amount of SiO2, low amount of Al2O3 and low loss on ignition, however, the R1 and R2 clays contain moderate amount of SiO2, Al2O3, and
high amount of Fe2O3 and high loss on ignition. The results indicate that clays from alluvial deposit have adequate characteristics
for common brick fabrication. However, clays collected from red clay deposit possessing adequate properties for rooing tile manufacturing and can be used for the manufacturing of common brick with some modiication.
Keywords:alluvial clay, red clay, clay, plasticity, brick, tiles.
Resumo
As técnicas de luorescência de raios X, análise termogravimétrica-térmica diferencial, espectroscopia no infravermelho com transformada de Fourier, difração de raios X, análise de tamanho de partículas e limites de Atterberg foram utilizadas para o estudo de propriedades físico-químicas, mineralógicas e térmicas de dois tipos de argilas de quatro diferentes localizações em Tamilnadu, India. As composições químicas e mineralógicas dessas argilas diferem consideravelmente. A mineralogia indica que argilas aluviais (G1 and G2) são compostas principalmente de quartzo, ilita, caulinita, plagioclases e pequenas quantidades de cloretos. As argilas vermelhas (R1 and R2) são também ricas em quartzo, caulinita bem ordenada, e minerais abundantes em ferro tais como goetita e hematita. Com relação à composição química, as argilas G1 e G2 contém alto teor de SiO2, baixo teor de Al2O3 e
baixa perda ao fogo; as argilas R1 e R2, entretanto, contém teor moderado de SiO2, Al2O3, e alto teor de Fe2O3 e alta perda ao fogo.
Os resultados indicam que argilas de depósitos aluviais tem características adequadas para a fabricação de tijolos. Entretanto, as argilas coletadas de depósitos de argilas vermelhas com propriedades adequadas para fabricação de telhas podem ser utilizadas na fabricação de tijolos após algumas modiicações.
of more appropriate raw clay materials associated with industrial applications. Generally, clays contain different non-clay minerals as impurities besides major and minor clay minerals [8].The particle size of natural clay materials inluences their behavior during the technological drying and iring processes, and affects many properties of the building clay products, such as the plasticity, microstructure and the mechanical properties of ired materials [9].
Clay based bricks are mostly used in India for building. At present, India has the production capacity to manufacture over 1000 crore bricks through 45000 local kilns in the unorganized sector [10]. It is understood that 65% of bricks are mostly used for dwellings and balance of them in commercial, industrial and institutional buildings. The main categories of clays in India are: Alluvial, Black, Red and Laterite. Among these, alluvial is the most extensive clay in India. Clay materials collected from different places of India have been studied extensively. Two Indian kaolins from different geological origin (Kerala and Gujarat State) were the subject of studies of industrial importance [11]. The mineralogy of kaolinite clays from Assam, India, by adopting the known methods like size separation, magnetic separation and leaching with organic acids, in order to highlights their possible applications, have been studied [12]. Viswabaskaran et al. [13] deliberated the formation of mullite in the red clays with admixture of alumina. The alluvial clays from Indo genetic plains and their behavior when subjected to rapid iring have been studied [14].
South-India experiences a semi-arid tropical climate [15], so several types of clayey deposits like sedimentary, alluvial, and red and residual are seen here. These widespread supericial formations are among the most used raw materials, especially for road works and as construction materials [15]. Alluvial clays have a strong bearing on the resultant thermal modiications during the iring stage of building bricks and tiles [14]. In this region, there is a vast utilization of clays by the local population for both ired and unired bricks, tiles and pottery. However, such exploitation is ineficient because no preliminary evaluation and testing have been carried out, despite the fact that is useful for all raw materials. From an industrial point of view, it is very important to evaluate the possibility of the use of alluvial and red clays in the production of bricks and tiles.
In Tamilnadu, there are extensive clay deposits mainly alluvial and red clays. Clays from this region are widely used as raw materials for red bricks and rooing tiles by the local ceramic industry, which assembles more than 140 plants. Despite the vast use of these clays, poor understanding of the chemical composition, particle size and mineralogy on properties of these clays have reduced the quality of the inal products. Therefore, a proper study and understanding of these clay materials is essential to improve the quality and reduce the defects of the products thereby decreasing natural materials wastage and increasing the proit margins of the industry [16]. For this reason, particular attention should be given to the exploitation of raw materials in India for industrial application. Thus, the knowledge of these clays
has both academic value and immediate commercial interest. This work is undertaken in order to assess the potential use of manufacturing construction ceramic products. For this purpose, the four clay materials are characterized with respect to their chemical, mineralogical and physical (particle size and plasticity) properties to evaluate their potential use of clays to manufacture structural products.
MATERIALS AND METHODS
Four different clay materials used in this study were collected from Tamilnadu. These raw materials belong to two sedimentary formations: two clays from the alluvial deposits namely Trichy (G1) and Kumbakonam (G2) areas and the other two from the red clay deposits namely Vadalore (R1) and Patherakottai (R2). The geological particularities of the materials, such as reserves, continuity and accessibility facilitate the potential use of the materials for a wide range of industrial applications. Fig. 1 shows the geological map of the studied surrounding areas. It covers the geological information of the major clay deposits of Tamilnadu. The samples were initially dried at 80 °C for 24 h and ground using agate mortar for further analysis.
The samples were examined to measure their granulometric fractions such as contents of sand, silt and clay. Using an ASTM sieve, about 100 g of clay was taken from each sample for separation of sand, silt and clay fractions
Figure 1: Geographical map showing the location of the study areas.
by wet sieving. Atterberg limits test conducted are the liquid limit (LL) and plastic limit (PL). The plasticity index was calculated based on the arithmetic difference of the LL and PL of the clay materials. The LL and PL tests were carried out with Casagrande apparatus using the method described in [17].
X-ray luorescence spectrometry (Bruker S4 Pioneer sequential wavelength-dispersive X-ray spectrometer) was used to determine the chemical composition of clays. Thermogravimetric analysis and differential thermal analysis (TG-DTA) were carried out with a Netzsch STA 449F3 instrument equipped with thermal advantage software. The FTIR spectra were obtained using the Perkin Elmer RX1 FTIR spectrometer. The infrared spectra for all clays were recorded in the region 4000-400 cm-1. The X-ray diffraction powder pattern was recorded at room temperature using Seifert (JSO-Debyelex 2002). The experimental pattern was compared with patterns obtained from the JCPDS database. RESULTS AND DISCUSSIONS
Granulometric analysis
Particle size and particle shape have inluence to the molding properties of clay materials. There are various factors affecting the plasticity properties of the clay materials among these particle size is the important one. The plasticity of the clay samples is almost understandable from the particle size distribution. Table 1 presents the particle size distribution of the clays. The corresponding clay (< 2µm), silt (2-60 µm) and sand (> 60 µm) fractions were indicated according to the ASTM. The clay fraction is associated with very ine clay minerals that are the main responsible for the plasticity of clayey materials. From the granulometry, the studied clay samples from the alluvial deposit may be
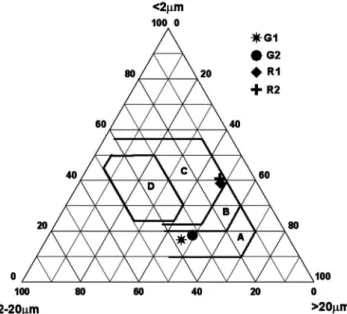
classiied as silty fractions [19] (Fig. 2). The samples from red clay deposit contained almost equal sand and clay size fractions so it can be classiied as sandy clay nature [19] (Fig. 2). The analyzed samples show moderate variation in particle size, having clay fractions from 16.3% to 40.8%, silt fractions from 13.3% to 71.4%, and sand fraction from 10.3% to 46.2%. Comparing all the samples G2 clay contains the highest silt content with lowest sand content. The sand values of G1, G2, R1 and R2 were 10.3, 16.6, 45.9 and 46.2% respectively.
Plasticity
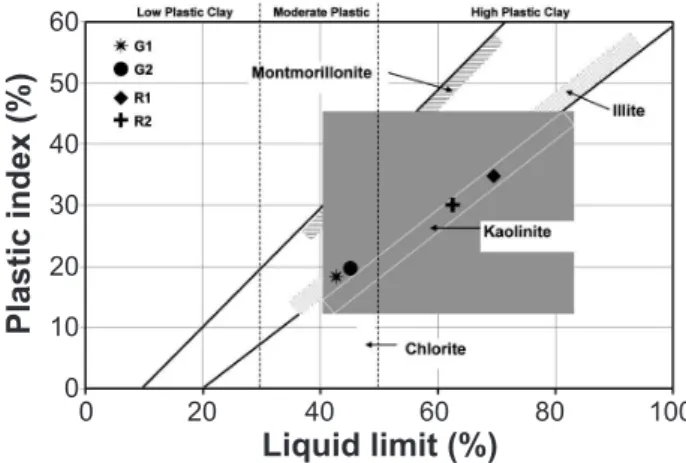
The chemical composition and particle size distribution of the clay materials play an important role for ceramic fabrication, which inluences their plasticity. Especially clay fraction has a major role in plasticity. From the Table 1, it is obvious that the plasticity of R1 and R2 is more due to the presence of high amount of clay fractions. The alluvial samples G1 and G2 had the clay of 16.3% and 18.3 respectively hence these two samples had low plasticity than red clays. The distribution of particle is the principal cause for the plasticity of the clay materials [19]. An attempt was made to correlate the plasticity of clay materials with the state of particle size. The high plasticity of the clay materials is due to the presence of high clay fraction and low plasticity is due to less amount of clay fraction and more amount of silt and sand. The consistency limits of the samples, which included the liquid limit and plasticity index, were plotted on the Holtz and Kovas diagram [20] in Fig. 3 The position of the studied samples in the Holtz and Kovas diagram show that G1 and G2 samples fall in the category of illitic clay region with moderate plasticity. However, the samples R1 and R2 fall in kaolinitic region with high plasticity. The difference in the plasticity of the samples is almost understandable from the particle size distribution data. Hence the particle size analysis provided useful information about the plasticity and ceramic suitability of the clay materials.
Figure 2: Textural classiication [19] of clay samples.
[Figura 2: Classiicação textural [19] das argilas.]
Figure 3: Position of clay samples on the Holtz and Kovacs diagram.
[Figura 3: Posição das amostras de argila no diagrama de Holtz e Kovacs.]
60
30 50
20 40
10
0 0
Pl
as
tic
in
de
x
(%
)
Liquid limit (%)
Chemical analysis
The chemical compositions of four clays were examined through XRF analysis and the results presented in Table 1. The chemical composition of all the clay samples indicated that the presence of SiO2, Al2O3 and Fe2O3 as major constituents, along with traces of Na2O, K2O, MgO, CaO and TiO2 in the form of impurities. Sample G1 and G2 contained high amount of SiO2 (Table 1) and signiicant amounts of Al2O3. Meanwhile, G2 contained 3.62% of K2O.
The red clay samples R1and R2 had similar chemical compositions, consisting mainly of SiO2, Al2O3 and Fe2O3. Sample R2 contained little more SiO2 TiO2, MgO, Na2O, CaO and K2O, compared to the R1. The luxes are K2O, Fe2O3, CaO, MgO and TiO2 helps to melt silicates and binds the particle of clay together during iring [21].
The chemical compositions of red clays show higher content of Fe2O3 than that in alluvial clays. The Fe2O3 content was similar in samples of G1 and G2, notably larger in samples of R1 and R2, and remarkably high in those of R1 (Table 1). The presence of CaO content relatively low in all samples (less than 5%) is an indicative of non-calcareous clays [22]. This favored the formation of anorthitic plagioclase during iring [23] and also prevented shrinkage of raw brick. The loss on ignition is relatively low for alluvial clay samples (3.39 and 4.74% for G1 and G2 respectively) and high in red clays
(10.64and 9.45 % for R1 and R2 respectively). The losses on ignition of the samples are associated with the presence of clay minerals, hydroxides and organic matter [24] and this is conirmed by thermal analysis.
Thermal analysis
Thermal analysis combined with other techniques such as chemical analysis and XRD is suitable for the examination of clays and their derivatives, as with other materials. TG and DTA curves of the four natural clay samples are given in the Fig. 4 for the temperature range of 0-1100 ºC. Three endothermic and one exothermic peak are seen in the DTA curve of G1 and G2 samples.The endothermic peaks at temperature 105 and 560 ºC indicated the removal of absorbed water and removal of lattice water from illite, respectively. This result agrees with illite phase identiied in XRD and FTIR (Fig. 4). The irst endothermic peak mass loss corresponding to the G1 and G2 clay samples was 1.24% and 1.53%, respectively. The second endothermic mass loss was 2.35% and 3.55%, respectively for G1 and G2. As the temperature is increased to 600 ºC, α-β quartz transitions occurred without mass loss, which is in accordance with the earlier reports for the quartz transitions. It is observed that the new mineralization reaction proceeds through an appearing of exothermic peak at 980 ºC in the DTA pattern
Figure 4: DTA/TG curves of the clay samples.
[Figura 4: Curvas ATG-ATD das amostras de argila.]
100 100
100 100
97 98
99 99
W
ei
gh
t (%
)
W
ei
gh
t (%
)
W
ei
gh
t (%
)
W
ei
gh
t (%
)
94 94
96
98 98
91 92
90
96 95
97 96
Temperature (ºC) Temperature (ºC)
Temperature (ºC) Temperature (ºC)
400 400
400 400
200 200
200 200
600 600
600 600
800 800
800 800
1000 1000
due to an alumina-rich spinel or mullite. The DTA curve of R1 and R2 show the four consecutive endothermic peak at 98, 310, 484, and 586 ºC for clays are due to removal of hydroscopic water, decomposition of goethite, destruction of kaolinite, and conversion of α-quartz to β-quartz respectively, followed by an exothermic peak at about 991 ºC associated with the formation of spinel or mullite. The mass losses of irst, second and third endothermic peaks were 2.8%, 1.68%, and 4.5% for R1 and 3.43%, 1.17%, and 5.36 for R2. The total mass losses of G1, G2, R1 and R2 were, respectively 3.59%, 5.08%, 8.98% and 9.96%. A comparison of the DTA curves of the alluvial clays and the red clay materials reveal an endothermic effect with a peak at 300 ºC did not appear in the alluvial clays. This endothermic peak is a proof of the goethite. All the four clays show an endothermic peak corresponding to α-quartz to β-quartz transformation at 600 ºC is clearly visible. Therefore the amount and conditions of transformation of quartz in clays impact on the thermal transformation.
FTIR analysis
The great advantage of FTIR spectroscopy is high sensibility that permits the determination of many components, even in very small amount. Infrared technique has been frequently used for the identiication of natural clay minerals [25-28] as well as the synthetic clay minerals [29, 30]. With the help of the FTIR, apart from crystalline, also non-crystalline inorganic and organic fabrics can be identiied [31]. The minerals such as kaolinite, illite, quartz, plagioclase and organic carbon
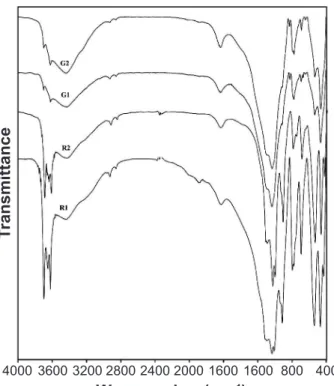
were identiied by comparing the observed wave numbers with available literature [25-28]. Fig. 5 shows the FTIR spectra of the natural clay samples from four locations. All the clay samples show a broad absorption band around at 3440 cm-1 along with the weak band at around 1640 cm-1 are due to absorbed water. The appearance of medium intensity doublet bands at 794 and 779 cm-1 along with bands at 694 and 470 cm-1 in all spectra is considered an indication of quartz. The samples G1 and G2 show low intensity bands at 3688 and 3618 cm-1 corresponding to OH stretching vibrations of disordered kaolinite. Kaolinite also gives two other characteristic bands at 1099 and 914 cm-1. The intensive band at 1030 cm-1 along with a shoulder at 828 cm-1 indicates the presence of illite [25, 32]. The bands at 669 cm-1 and 647 cm-1 conirmed the presence of plagioclase (albite or anorthite). The spectra of R1 and R2 samples collected from red clay deposit showed the four peaks at 3698, 3654, 3645 and 3625 cm-1 along with peaks appearing at 1008 and 914 and 535 cm-1 suggesting the presence of well ordered kaolinite [25, 33]. The band at 540 cm-1 is due to hematite [34] as may be seen in Fig. 2, was indistinguishable, as it overlaps into one broad absorption band centered at 535 cm-1 assignable to due to Al-O-Si present in kaolinite. The vibrations near the frequency range 3000 -2860 cm-1 were the same for all the clay samples (Fig. 5). The pair of peaks appeared at 2925 and 2855 cm-1 in all samples due to the C-H stretching vibrations of some organic contribution [35]. Carboxyl groups were the most important functional groups in natural organic matter. The organic substances have a high speciic surface and good molding capacity, improving the plasticity of the clays [36].
XRD Analysis
The mineralogical proile of the clay sample can be successfully examined using X-ray diffraction and can be used to validate the FTIR results. XRD was also used in order to identify the crystalline components present in the alluvial and red clays. The XRD patterns of the clay samples alluvial bed (Fig. 6) G1 and G2 had similar mineral compositions, consisting mainly of illite, kaolinite and minor chlorite. Also, both samples showed that quartz and plagioclase were ubiquitous throughout the XRD proile, with slight variations in relative intensity between them. The samples from red clay deposits also show the similar XRD patterns (Fig. 6). Samples R1 and R2 consisted mainly of quartz, kaolinite, hematite, and goethite. In general, the presence of hematite, goethite and great abundance of kaolinite, including their patterns of occurrence, indicate that the kaolinite is clearly related to tropical weathering. Hematite is the source of dark red spots and together with goethite constitutes to local iron crust, which demonstrates that, the red clay deposits are deinitely related to lateritic evolution. The chemical, mineralogical and thermal behavior results of alluvial clays are well agreement with the reported results of alluvial deposits of Indo-Gangetic plains [14].
4000
Wavenumber (cm-1)
Tr
an
sm
itta
nc
e
3600 3200 2800 2400 2000 1600 1600 800 400
Figure 5: FTIR spectra of alluvial and red clays.
Industrial suitability
Based on the criteria [4] who stated that the clays contain 5% or more of Fe2O3 are red-iring clays, for those contain Fe2O3 between 1 and 5% are B tan-burning clays and those contain less than 1% of Fe2O3 are white iring clays. Because of the high iron content of these clays (Table 1), they cannot be used for the production of ine ceramics, but however, they could be considered as raw materials for structural ceramic products [37].
Figure 6: X-ray diffraction patterns of alluvial and red clays.
[Figura 6: Difratogramas de raios X de argilas aluviais e vermelhas.]
5
2q (degree)
In
te
ns
ity
25 45
15 35 55 65
10 20 30 40 50 60 70
Figure 7: Grain size classiication of clay raw materials in Winkler’s diagram.
[Figura 7: Classiicação de tamanho de grão das argilas matérias-primas no diagrama de Winckler.]
According to particle size (< 2 µm, 2-20 and > 20 µm), a diagram has been developed [38] and made four portions to evaluate the suitability of clay materials for various ceramics applications. If the clay appears in the A, B, C and D portions are know as suitable for common bricks, vertically perforated bricks, rooing tiles /lightweight bricks and thin walled hallow bricks respectively. From the winkler diagram (Fig. 7), in the present case the sample from alluvial clay deposits (G1 and G2) are appeared in the irst portions thus both G1 and G2 suitable for common bricks manufacturing. The rest of two samples from red clay deposits (R1and R2) are appeared in C portion, thus both red clays are suitable for rooing tiles and light weight bricks.
CONCLUSIONS
Mineralogical, chemical, thermal and granulumetric investigations of clay materials from Tamilnadu, India were undertaken to evaluate their suitability for structural clay products. The mineralogical studies showed the presence of quartz, plagioclase, illite, kaolinite, and chlorite for the G1 and G2 samples and quartz, kaolinite, hematite and goethite for R1 and R2 samples. The red clay deposits contained well crystallized kaolinite, whereas the alluvial clay deposits were poorly crystallized kaolinite. The characterizations of these clay materials allowed some preliminary predictions for industrial applications. It was concluded from the comparison of the chemical compositions of the studied samples, due to the relatively low amount of Al2O3 and high amount of luxes in the clays G1 and G2, they could be used for ceramics and brick production. The R1 and R2 clays have a ceramic iring behavior with higher amount of Al2O3 and Fe2O3, andlow amount of K2O, CaO and Na2O. The particle size and chemical compositions of the alluvial (G1 and G2) clay samples indicated that they can be used in common brick fabrication as well as the red clay (R1 and R2) samples could be used in rooing tiles production. The chemical compositions and particle size distributions of the red clays not convenient for the base course of brick fabrication, therefore addition of lux materials with some modiication in particle size could be enable their wider use. ACKNOWLEDGEMENTS
The authors are grateful to Dr. A. N. Kannappan, Professor and Head, Department of Physics, Annamalai University, for giving permission to access the FTIR and TG-DTA facilities. The authors are very grateful to Dr. G. R. Ravindra Kumar, Scientist ‘F’, Center for Earth Science Studies, Kerala, for his assistance in the XRF data analysis. REFERENCES
[1] V. G. Lee, T. H. Yeh, Mat. Sci. Eng. A 485 (2008) 5-13. [2] S. Mohmoudi, E. Srasra, F. Zargouni, Appl. Clay Sci. 42 (2008) 125-129.
(2004) 229-234.
[4] H. H. Murray, “Applied clay mineralogy”, Developments in Clay Science 2, Elsevier B.V. (2007).
[5] J. Konta, Appl. Clay Sci. 10 (1995) 275-335.
[6] P. Pialy, N. koumbou, F. Villieras, A. Razaitianamaharavo, O. Barres, M. Pelletier , Y. Pontikes, C. Rathossi, P. Nikolopoulos, G. N. Angelopoulos, D. D. Jayaseelan, W. E. Lee, Ceram. Int. 35, 1 (2009) 401-407. [7] S. Kitouni, A. Harabi, Cerâmica 57 (2011) 453-460. [8] S. J. G. Sousa, J. N. F. Holanda, Cerâmica 57 (2011) 50-55.
[9] B. Bauluza, M. J. C. Mayayoa, Fernandez-Nietoa, G. Cultroneb, J. M. Gonzalez Lopez, Appl. Clay Sci. 24 (2003) 121-126.
[10] R. K. Rajput, “EngineeringMaterials”, S. Chand & Co. Ltd, New Delhi, India (2004) pp. 36-70.
[11] S. Chandrasekhar, S. Ramaswamy, Appl. Clay Sci. 21 (2002) 133-142.
[12] N. J. Saikia, D. J. Bharali, P. Sengupta, D. Bordoloi, R. L. Goswamee, P. C. Saikia, P. C. Borthakur, Appl. Clay Sci. 24, 1-2 ( 2003) 93-103.
[13] V. Viswabaskaran, F. D. Gnanam, M. Balasubramanian, Ceram. Int. 29 (2003) 561-571.
[14] J. M. Bhatnagar, R. K. Goel, Constr. Build. Mater. 16 (2002) 113-122.
[15] A. Sharma, V. Rajamani, Chem. Geo. 166 (2000) 203-223.
[16] P. Hettiarachchi, J. T. S. Motha, H. M. T. G. A. Pitawala, Cerâmica 56 (2010) 285-290
[17] A. Casagrande, Trans. Am. Soc. Civil. Eng. 113 (1948) 901-930.
[18] S. J. G. Sousa, J. N. F. Holanda, Cerâmica 58 (2012) 29-35.
[19] F. P. Shepard, J. Sediment. Petrol. 24 (1954) 151-158. [20] R. D. ltz, W. D. Kovacs, “An introduction to Geotechnical Engineering”, Prentice- Hall, Inc., New Jersey, USA (1981). [21] G. P. Souza, S. J. G. Sousa, L. A. H. Terrones, J. N. F. Holanda, Cerâmica 51 (2005) 381-386.
[22] F. A. C. Milheiro, M. N. Freire, A. G. P. Silva J. N. F.
Holanda, Ceram. Int.. 31 (2005) 757-763.
[23] Y. Maniatis, M. S. Tite, J. Archaeo. Sci. 8 (1981) 59-76. [24] R. Kreimeyer, Appl. Clay Sci. 2 (1987) 175-183. [25] J. D. Russell, In: Wilson, M. J. (Ed.), “Infrared Methods - A Handbook of Determinative Methods in Clay Mineralogy”, Blackie & Son Ltd., New York, USA (1987) p. 133.
[26] H. Kodama, “Infrared Spectra of Minerals”, Reference Guide to Identiication and Characterization of Minerals for the Study of Soil (1985) p. 198.
[27] V. C. Farmer, Spectrochim. Acta. 56 (2000) 927-930. [28] F. Franco, J. A. Cecila, L. A. Pérez-Maqueda, J. L. Pérez-Rodriguez. C. S. F. Gomez, Appl. Clay Sci. 35 (2007) 119-127.
[29] M. Felhi, A. Tlili, M. E. Gaied, M. Montacer, Appl. Clay Sci. 39 (2008) 208-217.
[30] C. Bisio, G. Gatti, E. Boccaleri, L. Marchese, G. B. Superti, H. O. Pastore, M. Thommes, Micropo. Mesopo. Mater. 107 (2008) 90-101.
[31] C. H. Zhou, Appl. Clay Sci. 48 (2010) 1-4.
[32] A. E. Lavat, M. C. Grasselli, J. E. Tasca, Ceram. Int. 33 (2007) 1111-1117.
[33] B. De Benedetto, L. F. Sabbatini, P. G. Zambonin, J. Cult. Herit. 3 (2002) 176-186.
[34] C. N. Djangang, A. Elimbi, U. C. Melo, C. Nkoumbou, G. Lecomte, J. Yvon, J. P. Bonnet, D. Njopwouo, Ind. Ceram. 27 (2007) 79-83.
[35] D. Barilaro, G. Barone, V. Crupi, M. G. Donato, D. Majolino, G. Messina, R. Ponterio, J. Molec. Struct. 744 (2005) 827-831.[36] A. I. H. Malkawi, A. S. Alawneh, O. T. Abu-Safaqah, A
ppl. Clay Sci. 14 (1999) 257-278.
[37] H. H. Murray, Appl. Clay Miner., “Developments in Clay Science”, Elsevier (2007).
[38]H. G. F. Winkler, “Bedeutung der Korngr€ossenverteilung und des Mineralbestandes von Tonen feur die Herstellung grobkeramischer Erzeugnisse”, Berichte der Deutschen Keramischen Gesellschaft 31, 10 (1954) 337-343.