IJMGE
Int. J. Min. & Geo-Eng.
Vol.49, No.1, June 2015, pp.33-45.
Thermal Analysis: A Complementary Method to Study the Shurijeh
Clay Minerals
Golnaz Jozanikohan
*, Fereydoun Sahabi, Gholam Hossain Norouzi and Hossein Memarian
School of Mining Engineering, College of Engineering, University of Tehran, Tehran, Iran.
Received 29 Oct 2014; Received in revised form 18 Apr 2015; Accepted 21 Apr 2015 *Corresponding author E-mail: gjkohan@ut.ac.ir, Tel: +98 21 82084291, Fax: +98 21 88008838
Abstract
Clay minerals are considered the most important components of clastic reservoir rock evaluation studies. The Shurijeh gas reservoir Formation, represented by shaly sandstones of the Late Jurassic-Early Cretaceous age, is the main reservoir rock in the Eastern Kopet-Dagh sedimentary Basin, NE Iran. In this study, X-ray diffraction (XRD), X-ray fluorescence (XRF), scanning electron microscopic (SEM) studies, and thermal analysis including differential thermal analysis (DTA), and thermogravimetric analysis (TGA) techniques were utilized in the characterization of the Shurijeh clay minerals in ten representative samples. The XRF studies showed that silica and aluminum oxides are present quantities. The XRD test was then used to determine the mineralogical composition of bulk components, as well as the clay fraction. The XRD patterns indicated the presence of dominant amount of quartz and plagioclase, with moderate to minor amounts of alkali feldspar, anhydrite, carbonates (calcite and dolomite), hematite and clay minerals. The most common clays in the Shurijeh Formation were illite, chlorite, and kaolinite. However, in very few samples, glauconite, smectite, and mixed layer clay minerals of both illite-smectite and chlorite-smectite types were also recognized. The XRD results were quantified, using the elemental information from the XRF test, showing that each Shurijeh exhibited low to moderate amounts of clay minerals, typically up to 21%. The amount of illite, the most dominant clay mineral, reached maximum of 13.5%, while the other clay types were significantly smaller. Based on the use of SEM and thermal data, the results of the identification of clay minerals, corresponded with the powder X-ray diffraction analysis, which can be taken into account as an evidence of the effectiveness of the thermal analysis technique in clay typing, as a complementary method besides the XRD.
1. Introduction
It is believed that the quality of clastic reservoir rocks is typically controlled by the type, amount, and distribution pattern of clay minerals [1-4]. Hence, having had a comprehensive knowledge of clay minerals in the reservoir, many significant reserves can be added to the existing hydrocarbon fields in order to help in the rapid identification of bypassed pay zones more efficiently.
For many years, the whole-rock X-ray diffraction (XRD) technique has been the most widely used laboratory technique for clay mineral identification in sandstone reservoirs [5]. However, some shortcomings in sample preparation and treatment, peak selection and weighting factors make it necessary to use other complementary analytical techniques to examine the accuracy of XRD results [6]. Thermal analysis consists of a series of methods which are suitable for studying all compounds that gain or lose energy/weigh upon heating [7]. It has been proven that the thermal analysis is a sensitive, specific and relatively rapid technique for the detection of small amounts of minerals [6]. It is also of great value as a complementary method besides X-ray diffraction, which can provide a better knowledge of clay minerals and their associated minerals, simultaneously, able to detect the presence of organic matter as well [8-11].
Among all the different thermal analysis methods, differential thermal analysis (DTA) and thermogravimetric analysis (TGA), have gained the most attention [7]. The DTA analysis is carried out based on the temperature difference between the sample and a witness (control) sample, while TGA uses the weight gain/loss upon heating as an identification factor [7]. In DTA analysis, the difference-thermocouples are used to monitor the temperature difference between the sample under test and a reference sample against time or temperature, while the temperature, in a specified atmosphere, is programmed [7]. It is worthy to mention that heat flow to both samples remains the same, rather than the temperature in this method [7]. In the TGA method, having decomposed the various components of the sample as the heat increases, the weight percentage of each resulting mass change is measured [7]. The sample configurations such as the particle sizes, mass
and heating rate can greatly affect the DTA and TGA curves [7]. Therefore, to ensure optimum peak resolution, samples should be fine-grained into powders and the time at any temperature must be long enough to complete the reactions [7].The principle of DTA was first used by Frankenheim (1837, 1854) for geological purposes [7]. Since then, geological materials have had considerable influence on the development of the DTA method [7]. The application of both methods has a long history in the identification of clay minerals, e.g., the DTA study of the chlorite minerals in 1927, revealed the broad application of this method in aiding the characterization of complex mineral series [6-17].
Significant endothermic effect at about 500–
600°C is a characteristic for kaolinite; however, very small amounts of water are liberated below 300C [23-24]. Moreover, dehydroxylation of disordered kaolinite happens between 530 and 570C, while for the ordered types, it varies between 570 and 630C [23]. This is followed by the destruction of the lattice structure at about 750C (formation of metakaolinite by an endothermic reaction), and finally completed with formation of gamma-alumina (release of water) at 960CC in an exothermic reaction [19, 23-24].
Although, some previous studies on the thermal behavior of clay minerals have been carried out, but comparatively little attention has been given to the study of clay minerals in the clastic reservoir rocks with complex lithologies. The aim of this study, therefore, was to identify the clay minerals found in the heterogeneous Shurijeh reservoir of the Late Jurassic-Early Cretaceous, from the particular perspective of thermal analysis methods (DTA/TGA), along with the traditional analysis methods including the X-ray diffraction (XRD), X-ray fluorescence (XRF), and scanning electron microscopic studies (SEM).
2. Geological Setting
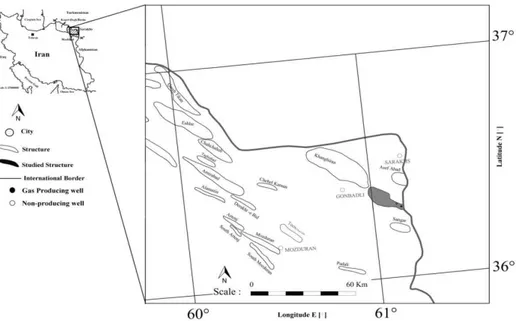
The core data used for this study were collected from a gas producing and other non-producing deep wells, approximately located in the 8.5 km distance of each other, in the
Eastern Kopet-Dagh sedimentary Basin fields, NE Iran (Fig. 1). The Iranian tectono-sedimentary understudy unit was formed during an extensional regime after the closure of Palaeo-Tethys in the Middle Triassic [25] and the opening of Neo-Tethys during the Lower to Mid Jurassic [26]. Over 8000 m sediments were continuously deposited from Jurassic through Miocene in this region [27].
The gas field chosen for this research is located on an elongated and symmetrical anticline, in the eastern part of the Kopet-Dagh sedimentary Basin, between two other known productive structures [28]. The reservoir rock in this field consists of the Late
Jurassic-Lower Cretaceous, Shurijeh
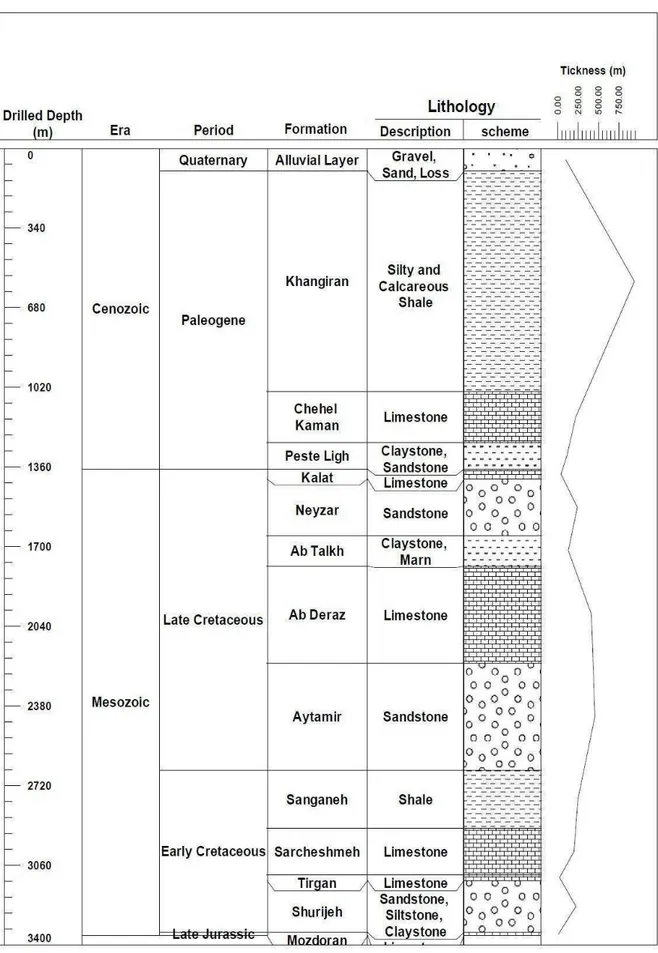
sandstones, deposited under arid and warm conditions, in a variety of continental, coastal, and marine environments [29]. The Shurijeh reservoir Formation includes intercalations of fine to medium grained sandstones, siltstones and shale with subordinate carbonates and evaporates [27, 29]. It overlies the limestone of Muzduran Formation (Late Jurassic) and is capped by the Tirgan Formation (Early-Mid Cretaceous) [27, 29]. Figure 2 shows the stratigraphic column of the studied area. The Shurijeh Formation thickness varies in different wells of the studied field from 174.5 to 259.1 m. It is situated between depths of 3125 and 3347 m in the gas producing well and at depths between 3121 and 3377.5 m in the non-producing well [29].
3. Materials and Methods
3.1. Materials
Ten core samples were taken from two wells in an Eastern Kopet-Dagh gas field. Four of the samples labeled with G, were taken from depths of 3204.6 to 3289.6 m in a gas producing well and the remaining six samples labeled with N, were taken from depths of 3181.21 to 3206.83 m in other non-producing wells. The samples were then crushed in order to pass through a 0.2 mm sieve and mixed to obtain a homogeneous mixture.
3.2. Methods
The clay minerals characterization in the Shurijeh Formation was carried out using a number of instrumental methods such as X-ray
diffraction (XRD), X-ray fluorescence (XRF), scanning electron microscopy (SEM), and thermal analysis including differential thermal analysis (DTA), and thermogravimetric analysis (TGA).
3.2.1. X-ray fluorescence (XRF)
The core samples were first subjected to the XRF test on an automated Philips MagiX PRO wavelength-dispersive X-ray fluorescence spectrometer facility, meanwhile the loss on ignition (LOI) at 950C was determined by the standard method [30] as well. Both tests were carried out at the laboratories of the Iranian Mineral Processing Research Center (IMPRC). The chemical composition and relevant LOI of the core samples are shown in Table 1.
Table 1. The results of XRF test for the Shurijeh samples
Code MgO (%) Al2O3 (%) SiO2 (%) SO3(%) K2O (%) CaO (%) Fe2O3 (%) Na2O (%) LOI (%)
G-1 1.20 11.28 74.21 0.65 2.50 3.76 0.72 3.26 2.42
G-2 0.64 11.32 75.56 1.06 2.90 3.23 1.31 2.83 1.15
G-3 3.25 11.20 56.69 3.12 3.70 7.46 7.62 0.76 6.20
G-4 3.61 4.32 78.46 0.00 0.79 5.35 1.02 0.50 5.95
N-1 1.59 10.56 70.34 2.29 2.55 5.86 1.03 2.10 3.68
N-2 1.99 8.65 66.34 6.12 2.07 8.56 1.00 1.09 4.18
N-3 1.39 7.55 42.78 22.76 1.95 18.46 0.99 1.24 2.88
N-4 1.01 14.38 62.70 2.29 5.03 5.90 3.41 1.07 4.21
N-5 1.69 8.53 48.47 17.41 2.24 15.46 1.47 0.91 3.82
N-6 1.59 13.44 57.56 8.29 3.03 8.03 2.64 2.46 2.96
3.2.2. X-ray diffraction (XRD)
The X-ray diffraction patterns were obtained on a Bruker AXS D8-Advance powder X-ray diffractometer, with Ni-filtered Cu Kα radiation having a 2 scanning speed of 0.02/s at 40 kV and 30 mA at the X-Ray laboratory of school of Mining Engineering, University of Tehran. Thus step scanning from 4 to 70 and 4 to 35 (2) degrees were used for the
bulk and clay mineralogy purposes,
respectively. The main mineral constituents of the samples were identified (Fig. 3a) by comparing ‘d’ values of diffraction patterns obtained from analyzing randomly oriented samples [31]. A series of simultaneous equations were then formulated, using the whole-rock major elemental analyses from the XRF data (Table 1), to quantify the XRD results. Tables 2 and 3 show the quantitative results of bulk mineral contents of samples, as well as each clay mineral contents,
respectively. Table 4 shows the minimum, maximum and the average values for each clay mineral in both wells.
To enhance the weak peaks of clay minerals, all the identified non-clay minerals were removed with both standard physical and chemical treatments [5], and in each removal stage, clay minerals were dispersed into individual colloidal particles in the suspension, using a 0.1% solution of Na(PO4)6
Table 2.The mineral content of the Shurijeh core samples, quantified using XRF data.
Code Quartz
(%)
Plagioclase (%)
K-feldspar (%)
Anhydrite (%)
Carbonate (%)
Hematite (%)
Clays (%)
G-1 65.5 17.1 4.6 1.1 4.0 0.0 7.7
G-2 64.0 19.6 7.3 1.8 2.0 0.0 5.3
G-3 46.8 8.7 1.5 5.3 15.2 1.5 21.0
G-4 72.2 5.5 0.3 0.0 15.6 0.4 6.0
N-1 56.9 18.4 5.3 3.9 7.3 0.0 8.2
N-2 56.7 12.6 3.6 10.4 8.8 0.3 7.6
N-3 32.4 12.5 3.4 38.7 5.0 0.0 8.0
N-4 49.7 12.4 4.8 3.9 6.1 2.1 21.0
N-5 40.0 10.7 2.3 29.6 6.3 0.9 10.2
N-6 38.0 23.9 3.3 14.1 3.5 1.2 16.0
Fig.3. a) The typical bulk powder XRD diffraction pattern,b) The typical clay fraction XRD diffraction pattern of the Shurijeh samples (Sample code: N-4); Chl=Chlorite, Ill=Illite, Kao=Kaolinite, Qtz=Quartz, Pl=Plagioclase,
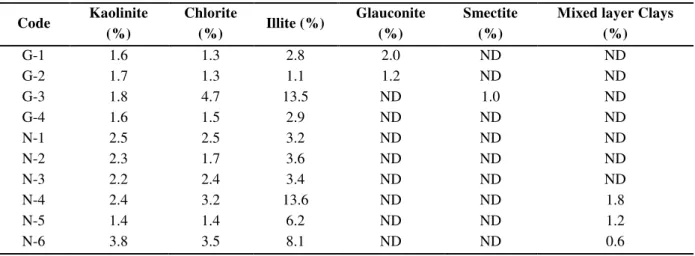
Table 3. The clay minerals contents of the Shurijeh core samples, quantified using XRF data
Code Kaolinite
(%)
Chlorite
(%) Illite (%)
Glauconite (%)
Smectite (%)
Mixed layer Clays (%)
G-1 1.6 1.3 2.8 2.0 ND ND
G-2 1.7 1.3 1.1 1.2 ND ND
G-3 1.8 4.7 13.5 ND 1.0 ND
G-4 1.6 1.5 2.9 ND ND ND
N-1 2.5 2.5 3.2 ND ND ND
N-2 2.3 1.7 3.6 ND ND ND
N-3 2.2 2.4 3.4 ND ND ND
N-4 2.4 3.2 13.6 ND ND 1.8
N-5 1.4 1.4 6.2 ND ND 1.2
N-6 3.8 3.5 8.1 ND ND 0.6
ND=None detected
Table 4. The minimum, maximum and the average values for each clay mineral in the gas producing well
Gas producing well Non-producing well
Minimum
(%) Maximum (%) Average (%)
Minimum (%)
Maximum (%)
Average (%)
Kaolinite 1.6 1.8 1.7 1.4 3.8 2.4
Chlorite 1.3 4.7 2.2 1.4 3.5 2.5
Glauconite 1.1 13.5 5.1 3.2 13.6 6.4
Smectite ND 1.0 0.3 ND ND ND
Mixed layer
Clays ND ND ND 0.6 1.8 1.2
ND=None detected
3.2.3. Scanning electron microscopy (SEM) The clay fraction prepared from two samples (G-4 and N-1) were selected and examined using a LEO 1450VP scanning electron microscope (SEM) equipped with the energy dispersive micro analysis system, at the SEM
laboratory of the Iranian Mineral Processing Research Center (IMPRC). It is worthy to mention that the samples were first carbon coated to make the surface conductive. The SEM photomicrographs are shown in Figure 4.
3.2.4. Thermal Analysis: Differential
Thermal Analysis (DTA), and
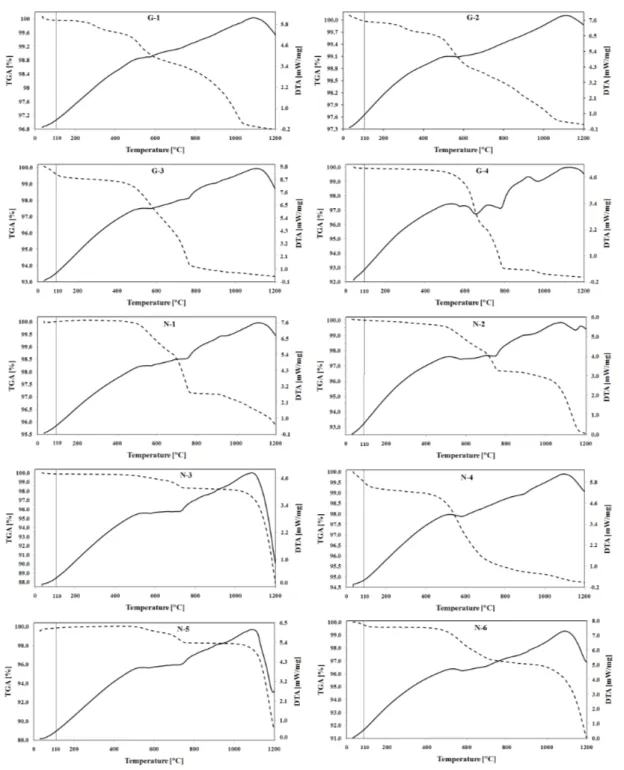
ThermogravimetricAnalysis (TGA) Simultaneous thermal analysis including differential thermal analysis (DTA) and thermogravimetric analysis, were obtained with the thermal instrument STA 409 PC LuxxÒ manufactured by NETZSCH-Germany by applying a heating rate of 30 K.min-1, and
final temperature of 1200°C (Fig. 5). The thermal analysis was carried out at the relevant laboratory in the Iranian Mineral Processing Research Center (IMPRC). An amount of approximately 51.5 ±1.5 mg from each
powder sample was analyzed. The
thermograms of DDTA-DTA and DTGA-TGA are shown in Figures 6 and 7, respectively.
4. Results and Discussion
As shown in Table 1, it is obvious that the chemical analysis of the Shurijeh samples contained silica and alumina in major quantities and the other elements in minor to trace quantities. The loss on ignition (LOI) values indicated that the core samples had
very small amounts of organic or
carbonaceous matter.
Fundamentally, characterization of XRD patterns indicated the presence of quartz and plagioclase as the major components, along with moderate to small amounts of clay minerals, anhydrite, carbonates (calcite and dolomite), K-feldspars and hematite. The clay minerals in both wells were dominated by illite, chlorite and kaolinite. While illite is the most dominant clay mineral in each well, in very few samples, the mentioned clay types were accompanied with the subsidiary glauconite, smectite and mixed layer clay minerals such as illite-smectite and chlorite-smectite. Smectite and glaucontie were only found in one and two samples of the gas producing well, respectively. In contrast, the mixed layer clays were only found in a few samples from the non-producing well. According to the quantitative XRD analysis, the average contents of total clay minerals varied from a minimum of 5.3 weight percent to a maximum of 21.0 weight percent in the Shurijeh Formation. The amount of illite, the most dominant clay mineral, typically reached 13.6% in both wells, while the other types of clays did not exceed 4.7 weight percent. According to the quantitative XRD results (Table 4), the non-producing well was more shaly with a clay quantity of 1.18 orders of magnitude larger than that in the gas producing well.
The SEM analysis of clay fractions in both wells showed that the clay minerals in the selected samples consisted of illite, magnesium rich chlorite and kaolinite. The vast majority of the pores were filled with kaolinite; however, some pores were lined with chlorite in both wells. The distribution pattern of clay minerals in the gas producing well was structural and dispersed (pore-filling and pore lining) and in the non-producing well was structural, dispersed (pore-filling, pore lining and pore bridging) and laminar.
The DTA and TGA curves shown in
Figures 5, 6 and 7 shared some common features, e.g., characteristic peaks responsible for the water loss, hydroxides and organic matter decomposition, transformation of quartz and carbonates loss; all were observed more or less in the tested samples. However, in each sample, the intensity of peaks was different. Thus slight dehydration peaks were observed at some TGA curves by raising the temperature up to about 110C, followed by two stages of weight loss, both with continual mass loss, especially in the case of G-3, N-4 and N-6. The maximum weight losses of up to 110C were observed in N-4 (0.65%), G-3 (0.51%), and N-6 (0.36%), this may be attributed to the fact that they have the highest clay content (mostly illite), consequently the highest absorbed water on the surface of clay minerals, and the highest pore water. The lowest weight loss in this region occurred in the samples with a lower concentration of clay minerals, e.g., G-2 (0.03%), and G-4 (0.07%).
All samples taken from the gas producing well, showed signs of organic substance oxidations from 200 to 500C with characteristic broad exothermic peaks. Having lost the largest mass by heating up to 500C, G-1 had the highest organic matter among the samples from the gas producing well. The
earliest exothermic maximums at
carbonate peaks started at about 600C and all finished before 800C. It is believed that carbonate rich samples with low amount of clay minerals are expected to gain much complex mineralogy during the thermal analysis [24]. If dolomite is present in the samples, it reacts with quartz at higher temperatures (about 900C) building diopside, CaMgSi2O6 [24]. The slight endothermic
reaction of smectite between 510 and 650C was overlapped by burning of carbonates in G-3. Chlorites are normally stable at 700C, magnesium rich chlorites show a thermal peak at about 720C, while iron rich ones show thermal peak at about 610°C [33-34].
Generally, thermal analysis showed the presence of quartz (573 and 870C), carbonates (600 and760C), organic matter, only in samples from the gas producing well (200 to 500°C), kaolinite (569 and 988C), illite (89, 566, and 966C), magnesium rich chlorite (410 and 720°C), and smectite (110 650, and 900°C). Although, the identification process based on the thermal data, had a problem of some similarities or overlapping in thermal effects of different clay minerals and was not able to resolve the mixtures of different clay minerals alone, but when it was accompanied with X-ray diffraction technique, it served as a valuable complementary method for distinguishing the clay minerals.
5. Conclusions
In this study, the clay mineralogy of ten selected core samples collected from the Shurijeh gas reservoir rock, NE Iran, was studied using the X-ray diffraction, X-X-ray fluorescence, scanning
electron microscopy (SEM) and the
simultaneous thermal analysis. The combination of all methods showed consistency in the characterization of the Shurijeh Formation clay minerals. The samples were rich in silicon, with SiO2 mainly hosted with quartz, plagioclase,
K-feldspar and clay minerals. Moreover, the associated minerals were carbonates (calcite and dolomite), anhydrite and hematite. To confirm the presence of identified minerals, SEM studies and thermal analysis were carried out. The SEM micrographs and the thermograms of tested core samples indicated similar mineral composition. On the basis of DTA/TGA curves, the clay minerals were illite, magnesium rich chlorite and kaolinite. Of the total identified clay minerals,
illite was the most dominant type, which was evident in the period of 450–750C, most in the case of G-3, and N-4.
In general, the results show that differential
thermal analysis (DTA) and
thermogravimetric analysis (TGA) could yield complementary information on clay minerals, which lead to a better understanding of clay minerals in the hydrocarbon reservoirs.
Acknowledgements
The authors wish to acknowledge the University of Tehran and National Iranian Oil Company (NIOC), Exploration Directorate for providing data as well as technical and financial support during this research work.
References
[1] Dewan, J.T. (1983). Essentials of modern open-hole log interpretation. Penn Well Books. [2] Hilchie, D.W. (1982). Advanced well log
interpretation. Douglas W. Hilchie.
[3] Worden, R.H., & Morad, S. (2003). Clay minerals in sandstones: controls on formation, distribution and evolution (pp. 1-41). Blackwell Publishing Ltd.
[4] Asquith, G.B., Krygowski, D., & Gibson, C.R. (2004). Basic well log analysis (Vol. 16). Tulsa, OK: American association of petroleum geologists.
[5] Moore, D.M., & Reynolds, R.C. (1989). X-ray Diffraction and the Identification and Analysis of Clay Minerals (Vol. 378). Oxford: Oxford university press.
[6] Thornley, D.M., & Primmer, T.J. (1995). Thermogravimetry/ evolved water analysis (TG/EWA) combined with XRD for improved quantitative whole-rock analysis of clay minerals in sandstones. Clay Minerals, 30(1), 27-38. [7] Gabbott, P. (Ed.). (2008). Principles and
applications of thermal analysis. John Wiley & Sons.
[8] Arsenović, M., Pezo, L., Mančić, L., & Radojević, Z. (2014). Thermal and
mineralogical characterization of loess heavy clays for potential use in brick industry. Thermochimica Acta, 580, 38-45.
[10] Langier-Kuzniarowa, A. (1991). Remarks on the applicability of thermal analysis for the investigations of clays and related materials. In
Thermal analysis in the geosciences (pp.
314-326). Springer Berlin Heidelberg.
[11] Yariv, S. (1991). Differential thermal analysis (DTA) of organo-clay complexes. In Thermal analysis in the geosciences (pp. 328-351). Springer Berlin Heidelberg.
[12] Grim, R.E., & Rowland, R.A. (1942). Differential thermal analysis of clay minerals and other hydrous materials. Part 1 and part 2. American mineralogist, 27, 746-761801. [13] Johnson, L.J., Chu, C. H., & Hussey, G.A.
(1985). Quantitative clay mineral analysis using simultaneous linear equations. Clays Clay Miner, 33(2), 107-117.
[14] Wilson, M.J. (1987). A Handbook of determinative methods in clay mineralogy. Blackie. Chapman and Hall.
[15] Bloodworth A.J., Hurst A. & Morgan D.J. (1990).Detection and estimation of low levels of kaolinite by evolved water vapour analysis. Mem. Sci, Geol.Strasbourg 89, 143-148. [16] Guggenheim, S., & Van Groos, A.K. (2001).
Baseline studies of the clay minerals society source clays: thermal analysis. Clays and Clay Minerals, 49(5), 433-443.
[17] Vaculíková, L., Plevová, E., Vallová, S., & Koutník, I. (2011). Characterization and differentiation of kaolinites from selected Czech deposits using infrared spectroscopy and
differential thermal analysis. Acta
Geodynamica et Geomasteralia, 8(1).
[18] Earnest, C.M. (1991). Thermal analysis of selected illite and smectite clay minerals. Part II. Smectite clay minerals. In Thermal analysis in the geosciences (pp. 288-312). Springer Berlin Heidelberg.
[19] Mielenz, R.C., Schieltz, N.C., & King, M.E. (1953). Thermogravimetric analysis of clay and clay-like minerals. Clays and Clay Minerals, 2, 285-314.
[20] Clews, F.H. (1969). Heavy clay technology (pp. 172-202). London and New York: Academic Press.
[21] Ross, G.J., & Kodama, H. (1974). Experimental transformation of a chlorite into a vermiculite. Clays Clay Miner, 22, 205-211. [22] Orcel, J. (1927). Thermal analysis of chlorites.
Bull. soc. franç. minéral, 50, 278-322.
[23] Yeskis, D., van Groos, A.F., & Guggenheim, S. (1985). The dehydroxylation of kaolinite. American Mineralogist, 70, 159-164.
[24] Trindade, M.J., Dias, M.I., Coroado, J., &
Rocha, F. (2009). Mineralogical
transformations of calcareous rich clays with firing: a comparative study between calcite and dolomite rich clays from Algarve, Portugal. Applied Clay Science, 42(3), 345-355.
[25] Alavi, M., Vaziri, H., Seyed-Emami, K., & Lasemi, Y. (1997). The Triassic and associated rocks of the Nakhlak and Aghdarband areas in central and northeastern Iran as remnants of the southern Turanian active continental margin. Geological Society of America Bulletin, 109(12), 1563-1575.
[26] Buryakovsky, L., Aminzadeh, F., & Chilingarian, G.V. (2001). Petroleum geology of the south Caspian Basin. Gulf Professional Publishing.
[27] Harb, A.A. (1979). The stratigraphy, tectonics and petroleum geology of the Kopet Dagh region, northern Iran (Doctoral dissertation, Imperial College London (University of London)).
[28] NIOC (National Iranian Oil Company,
Exploration Directorate).(1986). Gonbadli
geological well completion report, National Iranian Oil Company records, Tehran, Iran.
[29] Moussavi‐Harami, R., & Brenner, R.L. (1993).
Diagenesis of non‐marine petroleum reservoirs:
The Neocomian (Lower Cretaceous) Shurijeh
Formation, Kopet‐Dagh Basin, NE Iran. Journal
of Petroleum Geology, 16(1), 55-72.
[30] Indian Standard Methods of Chemical Analysis of Fireclay and Refractory Materials. (1960) IS: 1527.
[31] Selected Powder Diffraction Data for Minerals. (1974). Data book,Joint Committee
on powder diffraction standards, USA, 1st ed.
[32] Wang, Q., Odlyha, M., & Cohen, N.S. (2000). Thermal analyses of selected soil samples from the tombs at the Tianma-Qucun site, Shanxi, China. Thermochimica acta, 365(1), 189-195. [33] Papadopoulou, D.N., Lalia-Kantouri, M.,
Kantiranis, N., & Stratis, J.A. (2006). Thermal and mineralogical contribution to the ancient ceramics and natural clays characterization. Journal of thermal analysis and calorimetry, 84(1), 39-45.