*e-mail: [email protected]
Classification of Polymers Insulators Hydrophobicity basead on Digital Image Processing
Daniel Thomazinia*, Maria Virginia Gelfusoa, Ruy Alberto Corrêa Altafimb
aMechanical Engineering Institute, Itajubá Federal University – UNIFEI,
Av. BPS, 1303, CEP 35700-903, Itajubá, MG, Brazil
bDepartment of Electrical Engineering, University of São Paulo – USP,
CEP 13566-590, São Carlos, SP, Brazil
Received: May 23, 2011; Revised: February 7, 2012
Although the hydrophobicity is usually an arduous parameter to be determined in the field, it has been pointed out as a good option to monitor aging of polymeric outdoor insulators. Concerning this purpose, digital image processing of photos taken from wet insulators has been the main technique nowadays. However, important challenges on this technique still remain to be overcome, such as; images from non-controlled illumination conditions can interfere on analyses and no existence of standard surfaces with different levels of hydrophobicity. In this paper, the photo image samples were digitally filtered to reduce the illumination influence, and hydrophobic surface samples were prepared from wetting silicon surfaces with solution of water-alcohol. Furthermore norevious studies triying to quantify and relate these properties in a mathematical function were found, that could be used in the field by the electrical companies. Based on such considerations, high quality images of countless hydrophobic surfaces were obtained and three different image processing methodologies, the fractal dimension and two Haralick textures descriptors, entropy and homogeneity, associated with several digital filters, were compared. The entropy parameter Haralick’s descriptors filtered with the White Top-Hat filter presented the best result to classify the hydrophobicity.
Keywords: image processing, insulators, image texture analysis
1. Introduction
Continuous improvements on polymeric materials have contributed to replace the traditional glass and ceramic high voltage outdoor insulators for polymeric insulators in different situations on electrical power transmission and distribution systems1. In fact, due to the lightweight, lower susceptibility to breakage and excellent hydrophobic surface of polymeric insulators, they have been used with success, on high pollution environments and on transmission system with compact towers.
The hybrophobicity is a physical-chemical property used in various areas of knowledge as chemistry, medicine and pharmacology. It is an important indicator applied to the transport and permeability of membranes, interactions with biological receptors and enzymes, toxicity and biological potential2,3. The hydrophobic effect is not an attractive force between nonpolar molecules nor a repulsive force between such molecules and water. Rather, it is an entropic effect originating from the disruption of highly dynamic hydrogen bonds between molecules of liquid water by the nonpolar solute4.
The hydrophobic behavior of a material is directly related to the surface energy that acts as a driving force between the phases. The surface energy is defined as the free energy increased in a system on creating a unit area of new surface at constant temperature, pressure and composition. The force required to extend a liquid surface per unit
length is the surface tension and is numerically equal to the surface energy. In a system with a number of phases, the equilibrium distribution is determined by the condition that interface energy is a minimum. This requirement fixes the contact angle for a liquid-solid-vapor system with suitable limitations5.
The hydrophobicity surface of polymeric insulators is widely desired because it prevents the formation of a water path for electric current, preventing flashover and discharges on the insulation, causing electric breakdown6. However, some outdoor conditions such as, ultraviolet radiations, snow or salt can accelerate their aging process as well as reduce the hydrophobicity of polymers7-9. Fact that requires improvements in maintenance processes of electrical systems that use these insulators. In this context, the monitoring of the hydrophobicity of insulator surfaces directly in the field has become an important issue in power electric utilities.
been proposed by many researches, such as, circular factor , goniometric measurement using Hough transformation13, segmentation14, scaled entropy and histogram analyses15,16, surface energy17, and online hydrophobicity measurement methodology18,19, which use the spray method and inspection of the surface insulators in the field by photos and processing image methodologies.
The use of digital image processing has become a technique to identify patterns and shapes in a fast and accurate way20, bing suitable to this study. In this paper, three digital image processing methodologies, fractal dimension and two Haralick’s textures descriptors, entropy and homogeneity, which have not yet been applied to the investigation of hydrophobicity are combined with digital filters to reduce the influence of illumination conditions. A comparison between these three methods allowed us to obtain a better technique to determine the hydrophobicity of polymeric surfaces. The processing methods were chosen due to their abilities to identify similar textures21,22 and the photos were taken from samples obtained from the experimental procedure to prepare hydrophobic surfaces, described in21.
2. Experimental Procedure
Experimental procedure consists of preparing physical polymeric samples with different hydrophobic levels; taking photos of them on different illumination conditions; classifying them according to the STRI Guide, so they can correspond to the HC level, and also measure the contact angle of droplets on the surface as recommended in STRI Guide.
2.1.
Samples preparation
Ten specimens of silicon rubber with 10 × 10 cm2 and 5 mm thickness were sprayed with a solution of water and isopropyl alcohol (WIA) at different concentrations (from 0 to 100%)19,21. These solutions were identified as percentage of alcohol (%WIA). The parameters of the process to obtain the silicon rubber in industry are very well defined, and it is kwon that this material recovers the hydrophobicity behavior after some shelf time16. In this way, images from each WIA solution were taken from each specimen to prevent surface modification and to guarantee the reliability of the measurements. This solution was adopted due to the excellent results from previous works19,21, which showed high chemical stability of the materials employed and reproducibility of the results due to the low dispersion.
As discussed in previous work21, the alcohol reduces the surface tension of the water without any modification on the
W120 digital camera . This procedure provided ten VGA images grayscale, which were classified according to the STRI guide. Four of these images are presented in Figure 2. Images from the droplets were also taken in order to measure the contact angle with ImageJ software23. The computational procedure was performed in MatLab® v7.12 and Image Processing Toolbox v7.2 for Mac. The hardware used was an iMac with Intel i3 3.2 GHz and 12 Gb of RAM.
In order to avoid the influence of natural conditions of illumination, histogram equalization (EQU)24, which promotes the balance in the grayscale distribution and/or the White Top-Hat filter (WTH)24, which gives an enhancement of the image edges were used. Combinations of both these processes were also implemented. These light adjustments were used according to previous studies25, which show lower deviation and higher correlation in the results observed for these analyses.
3. Theoretical Considerantions of Image
Processing Methods
There are many methods to interpret and identify patterns and texture in digital image22,24. Most of them are employed regarding easiness of implementation, short time processing and reliability. For hydrophobicity classification most of the classical methods can be applied to distinguish its textures. However, for field application, as this work proposes , short processing time and on-line evaluation are desired characteristics. Considering this, the fractal dimension method, and the entropy and the homogeneity Haralick’s descriptors, were selected for a performance comparison.
3.1.
Fractal dimension
Literature provides some ways to calculate de Fractal Dimension of an object or image, and most of them are based on Hausdorff Dimension26. For a compact and uniform object in an image, it results in an integer value equal to the topological dimension, but to a fractal, it gives a fractionary number. In this way, an irregular shape gives a higher Fractal Dimension value, which is helpful to compare two fractals shapes. The Box-Counting is one of the best kwon and employed methods to estimate the Fractal Dimension, due to its simplicity and easiness of implementation. It consists of overlapping square grids and counting the number of squares necessary to cover the shape27.
The fractal dimension calculations have been performed by the box-count method in the grayscale images28, with the box-size ranging from 3 to 11. The fractal dimension based on the box-count method can be defined by:
log( )
log 2
n n
N
Dn= (1)
where the fractal dimension (df) is the linear fitting of Dn for many n values present in an image divided n times and Nn is the number of boxes crossing the image.
The Nn calculation can be obtained based on grayscale values from pixels grid (i,j) as follows:
( , )
n n
N ∑n i j (2)
The nn values are obtained from the Equation 3, where:
max( , ) min( , )
( , ) int 1
n
Gray i j Gray i j
n i j
S
−
= +
(3)
where Graymax(i,j) and Graymin(i,j) are the maximum and minimum grayscale image values in the grid (i,j) and S’ is the size of the box.
In this way, Nn is taken for different values of n, that is, from different sizes of grids. This counting method leads to a better approximation of the boxes that intercept the surface of the grayscale levels in the image. The df is obtained from the average value of Dn, or the angular coefficient of the linear fit from n vs Dn dilog plot.
3.2.
Entropy
According to the classical definition of Entropy29,30 it is defined as the probability of occurrence of an event in a set. Equation 4 presents how this value is obtained.
( ) log[ (
S p p
∈Ω
= −∑ × )]
λ λ λ (4)
In digital image processing, λ is the set represented by the Gray Level Co-Occurrence Matrix (GLCM), as proposed by Haralick22, and p(λ) is the probability of occurrence of this event in the set.
The entropy value is one of the texture descriptors, which can characterize an image, it can be used as a form of discrimination of texture images31.
Regarding image processing, Haralick described the entropy as the smoothness of the texture of the image, which can be calculated as
( , ) log[ ( , )]
i j
S= −∑ ∑p i j × p i j (5)
where p(i,j) is the GLCM obtained by two vectors defined as (1,0) and (0,1), after normalization described by Gonzalez24. Thus, the Entropy value was obtained from the average Entropy values from those GLCM.
3.3.
Homogeneity
The Homogeneity22 shows the distribution of the elements of a GLCM with its diagonal. Its value is between zero and one, and its one when the diagonal of the GLCM has the same values. The homogeneity is calculated as follows:
( , ) 1
i j
p i j H=
+ ∑ ∑
|i–j| (6)
As the same procedure for Entropy, the Homogeneity was performed from the average values calculated from two GLCM with vectors (1,0) and (0,1).
4. Results and Discussions
4.1.
Images classification and illumination
adjustments
contact angle was not considered in these analyses. Standard surfaces were naturally illuminated and the pictures for each percentage of WIA solution were taken. Images received digital illumination adjustments as presented in Figure 3, where the original image followed by the illumination adjustments from EQU, WTH, EQU+WTH and EQU+WTH+EQU can be seen.
Variations on the opening size mask of the WTH filter were performed in the range from [3 × 3] to [121 × 121] pixels, to define the best mask size (B). And it was found that the convergence was reached when B was equal to [41 × 41], as it is presented in Figure 3c), which also shows that the variation in the illumination was significantly reduced.
4.2.
Fractal dimension
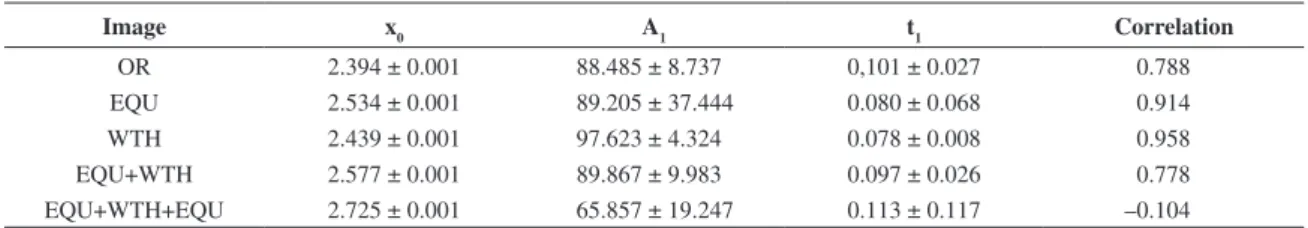
The fractal dimension of these images was calculated based on Equation 1 and the results are plotted in Figure 4. The plot reveals some dispersion in the results, in general
highest correlation coefficient shown in Table 1, or:
2.439 % 97.623 exp
0.078
df
WIA= × −
(7)
Equation 7 relates the image texture from the pattern images based on percentage of %WIA images and its fractal dimension value. In other words, this method provides a direct quantification of the hydrophobicity due to its texture characteristics. Its main advantage is the objective classification promoted by this method, avoiding the subjective analysis of the operator. However, one disadvantage of this method was the long time consumed during calculations, about 1 minute.
4.3.
Entropy
Figure 5 shows the behavior between the Entropy values and the %WIA images. High linearity and low
dispersion between the values for all types of processed images can be seen, when compared to the values presented by fractal dimension analysis. These results indicate that the use of this method is more reliable to this kind of texture analysis.
The curves were linearly fitted, according to Table 2. And in this case, the WTH curve, expressed for (Equation 8), presented the highest angular and correlation coefficient.
%WIA=(141.9 3.2) ( 34.2 1.1)± + − ± ×S (8)
In this case, the processing time was shorter than that spent on the Fractal Dimension calculation, about 2 seconds
4.4.
Homogeneity
The results from the homogeneity method as a function of the WIA images are presented in Figure 6. Again a linear
behavior of the curves can be observed, suggesting a good agreement with the results presented in Table 3.
The highest correlation coefficient for these images was obtained for the WTH images, as observed through fractal dimension and entropy analyses. In this case, the relationship obtained was the following:
%WIA= −( 83.9±4.4) (246.2+ ±7.8)×H (9)
In comparison to the fractal dimension method, the Haralick texture descriptors presented not only short calculation time (about 2 seconds), but it also resulted in much lower dispersion values and it was mathematically simple to adjust. Comparing the studied methods, the Haralick texture descriptors indicates that the homogeneity or entropy is the best option to make an objective analysis of the classification of hydrophobicity in polymer insulators, since a better correlation was obtained with this method. Figure 4. df values of various %WIA images. Figure 5. Entropy values of various %WIA images.
Table 1. First order exponential parameters to %WIA images and fractal dimension values.
Image x0 A1 t1 Correlation
OR 2.394 ± 0.001 88.485 ± 8.737 0,101 ± 0.027 0.788 EQU 2.534 ± 0.001 89.205 ± 37.444 0.080 ± 0.068 0.914 WTH 2.439 ± 0.001 97.623 ± 4.324 0.078 ± 0.008 0.958 EQU+WTH 2.577 ± 0.001 89.867 ± 9.983 0.097 ± 0.026 0.778 EQU+WTH+EQU 2.725 ± 0.001 65.857 ± 19.247 0.113 ± 0.117 –0.104
Table 2. Angular, linear and correlation coefficient values to %WIA images and entropy values.
Image Angular Linear Correlation
OR –99.548 ± 6.353 850.515 ± 51.124 –0.982
EQU –104.838 ± 6.482 880.776 ± 51.403 –0.983
WTH –34.151 ± 1.119 141.908 ± 3.182 –0.995
EQU+WTH –66.832 ± 3.100 466.619 ± 19.378 –0.990
5. Conclusions
To evaluate the hydrophobicity of polymeric outdoor insulator surfaces, which are direct associated with the aging of materials, three digital image processes, the fractal dimension and two Haralick’s descriptors, the homogeneity and entropy, were compared using different filters to adjust illumination conditions. For this comparison, samples
of silicon rubber sprayed with alcohol aqueous solutions were prepared. By controlling the alcohol proportion in the solution, it was possible to simulate the transition of a hydrophobic polymer surface to a hydrophilic surface. This methodology has shown to be very convenient to produce standard and reproducible samples with different levels of hydrophobicity and, from them to obtain digital images and contact angles of droplets on their surfaces.
To avoid light influence on the images, digital filters such as: equalization and White Top-Hat filter were used separately or in combination. As a result of the comparison between the methods it was found that the best digital process to classify hydrophobicity was the Haralick’s descriptor homogeneity associated with the White Top-Hat filter, which presented the highest accuracy. Further work will be carried out comparing this method with more classical ones using this sample preparation method, in order to determine the best solution. As observed in previous studies, the use of fractal dimension shows a relation between its values and the image textures, but the Haralick’s descriptors allowed a best correlation in a shorter time of processing, being more attractive to be applied in mobile devices to be used in the field by electricity companies.
Acknowledgements
The authors would like to thank Dr. R. A. Pisani Altafim for discussions and the Engineering School of São Carlos (EESC) at São Paulo University (USP) for support during the development of this study.
Figure 6. Homogeneity values of various %WIA images.
References
1. Gorur RS, Cherney EA and Burnham JT. Outdoor Insulation. Phoenix: Ravi S. Gorur Inc.; 1999.
2. Lyman WJ, Rosenblatt DH and Reehl WJ. Handbook of Chemical Property Estimation Methods. Washington: American Chemical Society; 1990.
3. Hansch C, Quinlan JE and Lawrence GL. The Linear Free-Energy Relationships Between Partition Coefficients and the Aqueous Solubility of Organic Liquids. Journal of Organic Chemistry. 1963; 33:347-350. http://dx.doi.org/10.1021/ jo01265a071
4. Haselmeier R, Holz M, Marbach W and Weingärtner H. Water Dymanics near a Dissolved Noble Gas. Journal of Physical Chemistry. 1995; 99(8):2243-2246. http://dx.doi.org/10.1021/ j100008a001
5. Kingery WD. Ceramic Fabrication Process. Massachussetts: Jonh Wiley & Sons; 1958.
6. Wankowicz JG, Gubanski SM and Lampe WD. Loss and recovery of hydrophobicity on RTV coating surfaces . IEEE Transactions on Dielectrics and Electrical Insulation. 1994; 1(4):604-614. http://dx.doi.org/10.1109/94.311703
7. Venkatesulu B, Thomas MJ and Raichur AM. Accelerated Multistress Aging of Outdoor Polymeric. In: Proceedings of the Annual Report Conference on Electrical Insulation Dielectric Phenomena; 2008; Quebec. IEEE; 2008. p. 67-70. http://dx.doi. org/10.1109/CEIDP.2008.4772805
8. Allan D, Blundell M, Boyd K and Hinde D. New techniques for monitoring the insulation quality of in-service high voltage apparatus.
IEEE Transactions on Electrical Insulation. 1992; 27(3):578-585. http://dx.doi.org/10.1109/14.142722
Electrical Insulation. 1999; 6(5):632-650. http://dx.doi. org/10.1109/94.798120
10. Sweden Transmission Research Institute – STRI. Guide 1/92. STRI; 1992.
11. International Electrotechnical Commission - IEC. IEC TS 62073: Guidance on the measurement of wettability of insulator surfaces. IEC; 2003.
12. Tokoro T, Nagao M and Kosaki M. Image analyses of hydrophobicity of silicon rubber insulator. In: Proceedings of the Annual Report Conference on Electrical Insulations ans Dielectric Phenomena - CEIDP; 1999; Piscataway. IEEE; 1999. vol. 2, p. 763-766.
13. Altafim RAC, Santana AM, Murakami CR, Basso HC and Chierice Neto SC. Hydrophobicity of polyurethane resins. In: Proceedings of the 2004 IEEE International Conference on Solids Dielectrics; 2004; Toulouse. IEEE; 2004. vol. 1, p. 452-455. http://dx.doi.org/10.1109/ICSD.2004.1350388 14. Berg M. Estimation of hydrophobicity of insulating surfaces by
studying sessile water drops. [Dissertation]. Uppsala: Faculty of Science and Technology; 2001.
15. Berg M, Thottappilli R and Scuka V. Hydrophobicity estimation of HV polymeric Insulating Materials – Development of a digital image processing method. IEEE Transactions on Dielectric and Electrical Insulation. 2001; 8(6):1098-2007. 16. Berg M, Thottappillil R and Scuka V. A digital image
processing method for estimating the level of hydrophobicity of high voltage polymer. In: Proceedings of theAnnual Report Conference on Electrical Insulations and Dielectric Phenomena; 1999; Piscataway. IEEE; 1999.
17. Zhao L, Li C, Xiong J, Zhang S, Yao J and Chen X. Online Hydrophobicity Measurement for Silicone Rubber Insulators on Transmission Lines. IEEE Transactions on Power Delivery. 2009; 24(2):806-813. http://dx.doi.org/10.1109/ TPWRD.2008.2005654
18. Li Z; Liang X, Zhou Y, Tang J, Cui J and Liu Y. Influence of temperature on the hydrophobicity of silicone rubber surfaces. In: Proceedings of theAnnual Report Conference on Electrical Insulation and Dielectric Phenomena, 2004; Montreal. IEEE; 2004. p. 679-682.
19. Altafim RAC, Gelfuso MV and Thomazini D. Método da determinação de hidrofobicidade em superfícies e método de avaliação do envelhecimento de superfícies e sistemas compreendido tais métodos. BR patent 0811520-6. 2009. 20. Pitas I. Digital Image Processing Algorithms and Applications.
New York: John Wiley & Sons; 2000.
21. Thomazini D, Gelfuso MV and Altafim RAC. Hydrophobicity classification of polymeric materials based on fractal dimension. Materials Research. 2008; 11(4):415-419. 22. Haralick RM, Shanmugam K and Dinstein I. Textural features
for image classification. IEEE Transactions on Systems, Man and Cybernetics. 1973; 3(6):610-621. http://dx.doi. org/10.1109/TSMC.1973.4309314
23. Wayne Rasband. 2011. ImageJ - Image Processing and Analysis in Java. Available from: <http://rsbweb.nih.gov/ij/index.html>. 24. Gonzalez RC and Woods RE. Digital image processing. 2th ed. Massachussets: Addison-Wesley Publishing Company; 1992. 25. Thomazini D. Classificação da hidrofobicidade em isoladores
elétricos poliméricos de alta tensão. [Tese]. São Carlos: Universidade de São Paulo; 2009.
26. Falconer KJ. Fractal Geometry: mathematical and applications. New York: John Wiley and Sons; 1990.
27. Conci A and Proença CB. A box-countig approach for color segmentation. In: Proceedings of the International Conference on Image Processing - ICIP’97; 1997; Santa Barbara. IEEE Computer Society; 1997.
28. Costa LF and Cesar Junior RM. Shape Analysis and Classification: Theory and Practice (Image Processing Series). New York: CRC Press, 2001.
29. Shannon CE. A mathematical theory of communication. The Bell System Technical Journal. 1948; 27:379-423.
30. Stowe K. Introduction to statistical mechanics and thermodynamics. New York: Wiley & Sons; 1984.