LOCATION MODEL OF SPECIALIZED TERMINALS FOR SOYBEAN EXPORTS IN BRAZIL
Alessandra Fraga Dubke
1and N´elio Domingues Pizzolato
2*Received August 2009 / Accepted June 2010
ABSTRACT.The purpose of this work is the development of a location model for specialized terminals used as transshipment points in the supply chain of soybeans. The theoretical basis of the study relies on the association of a transshipment model with a multi-commodity, multi-facility capacitated location model. The shipping ports might be seen as specialized terminals that add value to the exported products by transforming raw soy grains into soy oil and soy meal. The proposed model also considers service activities in each terminal and the capacity of the maritime ports. Using representative data from the year 2004, the model is illustrated by a small case study, which considers six points of production in inland Brazil, all served by railways, one maritime port on the north and five on the east coast, and three destination ports in Europe and Asia. The study includes a rough sensitivity analysis regarding volumes, capacities, prices, and transportation costs.
Keywords: facility location models, specialized terminals, logistic platforms and transshipment.
1 INTRODUCTION
The present world food crisis is granting Brazil a unique opportunity, seen by some rather as a responsibility toward humankind, to raise the international supply of grains. In fact, consi-dering its extensive geographic size huge areas might potentially be converted into productive plantations. Vast unproductive areas exist all over the country, mostly resulting from extensive cattle raising, an early and outdated economic activity historically responsible for the expan-sion of the country beyond its prediscovery defined limits, stated by the Tordesillas treaty in the 15th century, two years after the Colombus trip to America, which divided between Portugal and Spain the new world yet to be discovered. This ancient business has evolved mostly in inland regions of the country, especially those covered by the Cerrado Biome. Such areas had no Euro-pean occupation but were rather inhabited by local Indians of the same strata as those living on the east coast of the continent. This Biome is shown by the enhanced section of the country in
*Corresponding author
Figure 1a. It is basically similar to the African and North American savannah, covers about one fourth of the country and used to be rated as inappropriate for intensive cultivation.
However, systematic research projects carried out by the Brazilian Agricultural Research Corporation (EMBRAPA), a national state owned research company, have found economical ways to turn the Cerrado into extremely highly productive area. As a consequence, fertile and inexpensive land has been put into production and currently Brazil is the fourth largest grain producer in the world. According to the National Company of Food Supply (CONAB, 2008), the United States Department of Agriculture (USDA, 2008) and EMBRAPA (2002), it is esti-mated that for the period of 2007/2008 the biggest grain producers in million tonnes per year (Mtpy) shall be USA (482), China (440), India (237), and Brazil (143). What is specific to Bra-zil is that, in contrast with the three other countries, remarkable productivity rates and the still very large unexploited land extensions, estimated at 90 million hectares – almost as large as the present 92 million hectares in use for production in the USA – allow for a realistic prediction that Brazilian grain production might reach 300 million tons by the year 2018. It is also im-portant to remark that, since its meat production derived from cattle herds is based on grazing fields, at least half of the grains might be available for exports. Figure 1b indicates the incidence of soybean production, and confirms the predominance of the Cerrado territory in the Brazilian soybean production.
It seems clear to everyone that the existence of limits to growth should be recognized, and com-mon sense suggests that food production ought to increase through further technological im-provements and recuperation of improperly managed areas rather than occupation of new areas which would better remain untouched to preserve the environment, wild life, indigenous reser-ves, and the fragile ecological balance. This is indeed a sensitive problem, source of political conflicts between several segments of the society. Fortunately, in our view, the predominant trend is to enforce protection over the multiple existing biomes.
On the other hand, the main production areas are significantly far from the ocean coast, and means of transportation are quite primitive, lacking railways and relying mostly on old trucks and poorly paved routes. It is currently affirmed that the downstream logistics costs for grain producers offset the economical advantages they have in producing at lower costs. In addition, it ought to be said that other elements of the logistics structure are also deficient. During the harvesting period, for instance, transportation tariffs are higher and market prices depressed. If the soybeans are warehoused or transformed to two more valuable byproducts such as soy oil and soy meal the producer might take advantage of lesser tariffs and higher prices. The focus of the present study lies exactly on improving the competitiveness of the product, and we expect to contribute to rethink the logistics of the entire supply chain.
transshipment terminal to handle the flow of these products and to support its transformation in the two mentioned byproducts. In addition, using real statistical data this study has developed a case study in which the supply chain of soybeans is examined.
According to ReVelle & Eiselt (2005), location analysis refers to the modeling, formulation, and solution of a class of problems that can be best described as positioning facilities in a given space. We can supplement this by noting that when the proposed facility is embedded in a supply chain it becomes a logistics center which provides services and adds value to the product. Its corresponding economic evaluation involves strategic decisions, choice of transportation modes, choice of suppliers, production scheduling, distribution decisions, and so on. Such facilities are currently known as logistics platforms or specialized terminals, depending on the level of services or transformations eventually applied to the products.
Traditional references on facility location problems are: Weber (1909); Brandeau & Chiu (1989); Sidharan (1995); ReVelle & Laporte (1996); Canel & Khumawala(1996); Crainic & Laporte (1997); Owen & Daskin (1998); Drezner & Hamacher(2002); and Harkness & ReVelle (2003). Among other related references, optimization problems concerning multi-commodity facility lo-cation have been modeled by Hu (1963); Ahuja (1993); Pirkul & Jayaraman (1998), and lolo-cation associated to transshipment problems have been studied by Campbell (1993); Konings (1996); Sharmaet al.(2003), and Matisziw (2005).
Briefly, logistics platforms are integrated facilities that offer a variety of value added services in terms of information, transportation or specific services to the physical product, which are of interest to a large number of producers, transporters, users, workers and clients. Logistics platforms are normally located at intersections of main streams of flows, comprised by roads, railways, and maritime ports. This is done in order to encourage the best use of the exis-ting transportation infrastructure, especially railways and waterways, which are less flexible but more economical. Therefore, logistics platforms are designed to combine the cargo stream of shippers along international logistics corridors.
Specialized terminals, in turn, are logistics units usually based around urban centers, industrial parks, ports, and airports, that are able to provide services such as postponement and a number of other value adding functions to the products. These terminals can be understood as less complex than logistics platforms and they tend more often to target a single class of products to which their services are applied.
2 LOGISTICS STRATEGY AND THE SOYBEANS MARKET
According to Izquierdo (1994), a logistics platform can be defined as: “... a set of installations and equipments – infrastructure and transportation – in which different activities are performed directly related to national and international transportation, that may be used conjointly by in-dustries and distributors, and offers a series of complementary services to different clients – transportation firms, industries, warehousing and brokers. In the platform, transshipment, bulk consolidation and modal transfers of goods are carried out and goods might be warehoused or subjected to transformation and finishing”. In addition, the author describes intervening crite-ria for the design of such centers, which include area, location, market potential, environmental impact, and functional organization. Among these conditions, the physical location for either na-tional or internana-tional distribution seems to be the main deciding factor. For third party logistics providers, centrality regarding distances to the main markets appears to be the dominating factor.
In the study made by Tanigushiet al. (1999), a location model with optimal size for Osaka in Japan is proposed. Special emphasis is placed on the concept of public logistics terminals as complex facilities with multiple functions including transshipment yards, warehousing, whole-sale markets, information centers and display of products. The author also mentions that this idea is derived from similar terminals installed in Holland and Germany but the matter requires a broader investigation, especially concerning size, function, location, and the public sector ma-nagement of such centers. Therefore, the application might be implemented in public or private harbor areas, as well as in urban areas, especially in the vicinity of consumption centers.
Around the world, depending on each country, different but equivalent denominations for the existing public and private logistics platforms are in use, such as:Centrales Integradas de Mer-cancias(CIM), in Spain;Plateformes Logistiques PubliquesandDistriport, in France, Belgium and Holland;Distripark, in Singapore and Belgium; Freight Village, in England;Interporti, in Italy;Guterverkehrszentren(GVZ), in Germany;Integrated Logistics Centers – Intermode Ter-minalsorLogistics Platformsin Brazil;Maquiladoras, in M´exico;Load Centers, in USA; Inte-grated Centres for the Transshipment, Storage, Collection and Distribution of Goods(TSCD), in Holland, in addition to traditional distribution centers – DC,break-bulk terminals, transshipment terminalsandLogistics Activity Areas(Hayut, 1981; and Konings, 1996).
Table 1– Soy production and consumption.
World inicial 2001/02 2002/03 2003/04 2004/05 2005/06 2006/07 2007/08
stock (Mtpy) 34.2 28.3 36.1 43.6 37.8 47.5 53.3
Production (Mtpy) 184.8 196.8 186.6 215.8 220.5 236.6 218.8
EUA 79.6 75.0 66.8 85.5 84.3 86.8 70.4
Brazil 41.5 51.4 49.9 52.0 52.3 58.4 58.9
Argentina 28.0 35.2 33.0 39.0 40.5 44.0 45.5
China 15.3 16.5 15.4 17.4 16.4 16.2 16.2
Consumption (Mtpy) 184.5 191.4 189.3 204.8 215.3 225.2 233.5
EUA 46.3 44.0 41.6 44.9 47.3 49.2 50.1
China 20.3 26.5 25.4 29.0 34.5 37.0 37.5
European Union 19.2 17.9 15.7 16.8 17.8 18.0 19.5
Brazil 24.7 27.2 29.3 29.6 30.4 33.5 35.1
Argentina 20.9 23.5 25.0 25.3 32.0 35.0 35.0
Final stock (Mtpy) 34.5 33.7 33.4 54.6 43 58.9 38.6
Stock/consumption 19% 18% 18% 27% 20% 26% 17%
Source: CONAB (2008), CVRD (2005), and USDA (2008).
Soybean production in Brazil might reach 140 million tons by the year 2020 if both the present expansion rate and the productivity increase rate are maintained. Nowadays, local consumption in Brazil reaches 35 million tons, which allows a significant surplus of almost half the total production for exports. Argentina and the USA might obtain production rates of, respectively, 100 and 110 million tons by the same time. Certainly, these volumes depend on international prices, which define incentives to farmers.
Prices are determined by the international markets. Statistical data collected by Siqueira (2004) indicate that in the last few years the average prices per ton have been US$ 190 in 2000, US$ 174 in 2001 and US$ 190 in 2002. In the following years, market prices have been in-creasing consistently, reaching US$ 290 for grains, US$ 220 for soy meal, and US$ 600 for oil in 2004. Souzaet al. (2010) have estimated for the period 2009-2018 the Brazilian production, consumption, exports and export prices for raw soy beans, soy oil and soil meal. The study asserts a great growth perspective for the country in the world markets.
The logistics infrastructure for soybean exports is composed of ports, warehouses and specialized terminals. Using maritime ports, about 95% of the exports are directed to Europe and Asia, while rail and road transportation are used for the Mercosul countries. The weakness of the supporting infrastructure for soy transport is considered the bottleneck of the sector. Such infrastructure flaws seriously affect the competitiveness of the product, since they offset the lower production cost advantage. De Paula & Faveret (2000) have pointed out six main factors responsible for swelled transport cost and the consequent loss of competitiveness of the grains produced in the Cerrado area, which are very distant from the maritime ports. These factors are:
• Almost 60% of the cargo transport in Brazil is made by roads and using trucks.
• The increasing production in inner areas of the country accentuates the dependence on roads.
• The aging trucks being used generate costs to its operators, which charge higher tariffs.
• The road carrier sector is predominantly composed by thousands of independent truck drivers which require direct negotiation and anticipated payments for the transport service.
• Despite increasing investments, other possible means of transportation, such as railroads or rivers, have not become effective alternatives to road transportation due to their lack of flexibility and limited capacity.
The predominance of trucks in Brazil is attributed to topographical, historical and economical factors whose justification will not be addressed here. The consequence is that most of the new inland production frontiers, which are far away and naturally isolated from the sea coast, are not adequately accessible, except, as already mentioned, by poorly maintained roads and aged trucks. Railroads are generally scarce but whenever they are available, the trucks have the function of collecting the production at the farms and taking it to a rail terminal. It is interesting to compare Brazil with Argentina, a neighboring country and a major competitor in soybean production. In Argentina, most of the volume of soybeans is transported by trucks over relatively short distances between the production areas and the city of Rosario on the banks of the Parana River, from where the cargo is shipped to Buenos Aires or directly to Europe and Asia. Therefore, we might say that Brazil depends on trucks over large distances, while Argentina uses more trucks over much shorter distances.
Regarding the sea ports, the flow of soybeans is traditionally directed to ports in the south or southeast region and more recently to ports in the north of the country. The main ports in the south are Rio Grande and S˜ao Francisco do Sul; in the southeast they are Santos, Paranagu´a, and Vit´oria. When the exports flow north they use Manaus, reached exclusively by rivers, Ponta da Madeira or Itaqui, reached by either railways or rivers. Concerning ports, a recurrent problem in Brazil since the country was in this particular not well contemplated by nature, the main factors that affect their competitiveness are:
• Tariff costs.
• Demand satisfaction, limited by the restricted capacity of terminals and warehouses.
• Congestion of ships and trucks during the peak of the harvest season, seriously affecting the flow of grains.
• Lack of investment to expand the ports’ facilities.
• Limitations on the draft of most of the ports, restricting the access only to smaller ships.
3 MODEL FORMULATION
speeding up to the process, creating value added services, and making the supply chain more competitive internationally.
The model proposed below is fundamentally based on the classical transshipment model, in which the chosen locations,i.e., the port terminals, play the role of transshipment points to the final destinations. In addition, the proposed model includes the eventual application of a certain number of services able to add value to the incoming products, both in the form of time value, such as storage, or in the form of physical change, such as smashing and processing. By the same token, it is to note that if for a given solution no kind of value added service is applied, the model reduces to the transshipment model and the solution turns out to be always composed by integer numbers.
The general problem of locating a logistics platform or specialized terminal considers a set of J potential locations; a set I of points of origin; a set K of points of destination; a set M of inputs; a setQof products or commodities; and a setSof services. In the case of soybeans, the services provided in specialized terminals might include transshipment, segregated warehousing, smashing (a process that transforms soybeans in soy meal) and processing (oil refining), besides discharging and shipping services. Certainly, these services add value to the entire soybean supply chain.
The parameterCi j mi n represents the cost of inbound transportation of the inputmfrom origini to a specialized terminal j, and the parameterCoutj kqrepresents the outbound cost of transportation of the productqfrom a specialized terminal j to destinationk.
For each specialized terminal or port j ∈ J, there is a fixed cost fj for its installation, a fixed cost gserj sv referring to opening the service sin this terminal, and a cost αserj smv which varies as a function of the volume of the input m that uses the services of this terminal. Ports j are capacitated facilities which have a total capacity Wj and an installed capacity wj s of service s. Capacity flows between a given origin-destination pair have been ignored. The congestion commonly observed tends to happen during the harvesting period and is a consequence of the lack of warehousing at every origin; if this problem is solved, smaller tariffs and a more smooth flow would be attained.
There is also a commercialization price Pkq for productq at destinationk, a volumeSi m of the inputmoffered at the origini, a volumeDkq of the product demanded at the destinationk, and a coefficientβj smq for inputs that are altered in their volumes if they are turned into by products q,depending on the kind of services applied in the terminal j. In addition, the parameter Z indicates the number of terminals that will be opened.
The decision variables of the model are: Xi ni j sm, representing the flow of inputmsent from the point of origini to the terminal j to be subjected to the services; Xoutj ksq, representing the flow of productq that has received the services in the terminal j and is directed to destination k; Yj =1, indicating the decision to open a terminal in the location jwhileYj =0, otherwise; and Yj sserv=1, defining the decision to offer the servicesin the terminal jandYserj s v=0, otherwise.
in order to maximize the total profit for the supply chain. In summary, the relevant sets of points, parameters and decision variables for the general model are as follows:
Sets:
I Set of points of origini(cities, plants, cooperatives, terminals or distribution centers) J Set of specialized terminals j(located in public sea ports or private terminals) K Set of points of destinationk(maritime terminals)
M Set of inputsm
Q Set of productsq S Set of servicess
Parameters of the model:
Pkq Price of the productq ∈Qsold to destinationk∈K
Ci j mi n Cost of transporting inputm∈ Mfrom origini∈ I to the terminal j ∈ J
Coutj kq Cost of the transporting the productq ∈ Qfrom the specialized terminal j ∈ J to destinationk∈K
fj Fixed cost of installation of a specialized terminal j ∈ J
gserj sv Fixed cost to open the services∈ Sin the specialized terminal j ∈ J
αserj smv Variable cost of the package of servicess ∈ S, applied to the inputm ∈ M in the specialized terminal j ∈ J
βj smq Change of volume coefficient by services∈Sand inputm∈M wj s Nominal service capacity of the service types∈Sin terminal j∈ J Wj Total capacity in the specialized terminal j ∈ J
Z Maximum number of opened specialized terminals Si m Supply of inputsm∈ Mat the origini ∈ I
Dkq Maximum demand for the productq ∈ Qat destinationk∈K
Decision variables:
Yj
(
1, if the specialized terminal is opened in location j 0, otherwise
Yj sserv (
1, if the servicesis offered at the location j 0, otherwise
Xi j smi n Quantity of the input m, assigned from origin i to the specialized terminal j, to receive the services
The proposed model becomes:
Maximize X
j∈J
X
k∈K
X
q∈Q
X
s∈S
Pkq Xoutj ksq
−X
j∈J
( X
i∈I
X
m∈M
Ci j mi n X s∈S
Xi ni j sm )
−X
j∈J
(
fjYj+gserj svYserj s v+
X
s∈S
X
m∈M
X
i∈I
αserj smvXi j smi n
)
−X
j∈J
X
k∈K
X
q∈Q
Coutj kq X s∈S
Xoutj ksq
Subject to X j
X
s
Xi j smi n ≤ Si m ∀ i ∈I, m∈ M (1)
X
j
X
s
Xoutj skq ≤Dkq ∀ k∈K, q∈ Q (2)
X
m
X
i
Xi j smi n ≤wj sYj sserv ∀ j ∈ J, s∈ S (3)
X s X m X i
Xi ni j sm≤Wj Yj ∀ j ∈ J (4)
βj smq
X
i
Xi j smi n −X
k
Xoutj skq =0 ∀ j ∈ J, s∈ S,m∈ M,q∈ Q (5)
X
j
Yj ≤ Z ∀ j ∈ J (6)
Xi ni j sm,Xoutj ksq ≥0 ∀ i ∈ I,j ∈ J,s∈ S, (7)
k∈K,m∈M,q ∈ Q
Yj ∈ {0,1} ∀ j ∈ J, s∈S (8)
Yj sserv∈ {0,1} ∀ j ∈ J,s∈ S (9)
Constraint (2) states that the quantity of productq from all terminals j ∈ J must be equal or lower than the maximum demand of productq at destinationk. Equation (3) states that for each terminal jand each service packagesthe inbound flow of inputmsent to such terminal must be compatible with the nominal service capacity locally offered. Constraint (4) states that the total inputsmsent from all originsi to any given servicesin terminalsjmust be compatible with the capacity of the corresponding terminal j.
Constraint (5) represents for each terminal, each input, each product, and each type of service the flow conservation equation indicating the equilibrium between all amounts received and sent from the corresponding terminals. Constraint (6) states a limit of Z terminals to be opened, and the remaining constraints (7) through (8) and (9) indicate the non-negativity of the decision variables and the binary condition of the location variables.
4 RESULTS OF THE CASE STUDY
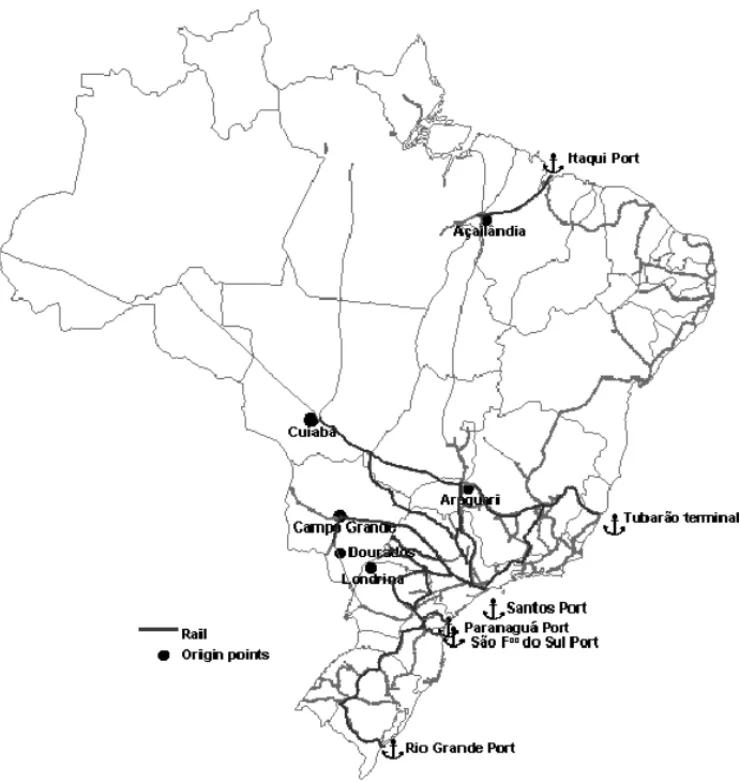
The case study has considered the volume of exported soybeans in the year 2004, and the sample was defined mainly by way of accessibility to basic data. The physical connections, portrayed in Figure 2, included six points of origin with corresponding supplies (Table 2), six potential transshipment ports (Table 3) with their nominal services and total capacities, and three ports of destination with their maximum demands (Table 4). The six selected points of origin are linked by railroad to potential ports, which does not exclude, as noted before, an extensive truck collection at the farms and the transshipment to the railroad terminal. These six points were selected by determining the largest centroid points of supply that are connected by railroad to the six main transshipment ports considered in the study. The three selected destination ports were Rotterdam – Holland; Hamburg – Germany; and Shanghai – China, and are representative of the most important destination ports to soybean supply chain. The cost coefficients as well as all parameters used in the case study are quite realistic for the sample elements considered. These cost elements represent average costs between trucks and railways tariffs and are available in Dubke (2006). No seasonality was considered in the model, but rather yearly averages.
In summary, the relevant sets of points for this case study are as follows:
I Set of cities or points of origin i ∈ I = {Ac¸ailˆandia, Araguari, Campo Grande, Cuiab´a, Dourados, Londrina};
J Set of specialized terminals j ∈ J = {ITQ – Itaqui, TUB – Tubar˜ao, SAT – Santos, PAR – Paranagu´a, SFS – S˜ao Francisco do Sul, RG – Rio Grande};
K Set of ports of destinationk∈K = {Rotterdam, Hamburg, Shanghai}; M Set of inputsm∈ M= {soybean};
Q Set of productsq ∈Q= {soybean, soy meal, soy oil}; S Set of servicess∈S= {warehousing, smashing, processing}.
Figure 2– Origin points and transshipment terminals. Source: Dubke (2006).
Table 2– Set of origins of soybeans in Brazil – 2004.
Origin Cities Supply
(Si m) (i) (ton)
S1 Ac¸ailˆandia – PA 70,000 S2 Araguari – MG 80,000 S3 Campo Grande – MS 300,000 S4 Cuiab´a – MT 250,000
S5 Dourados – MT 200,000
S6 Londrina – PR 300,000
Total 1,200,000
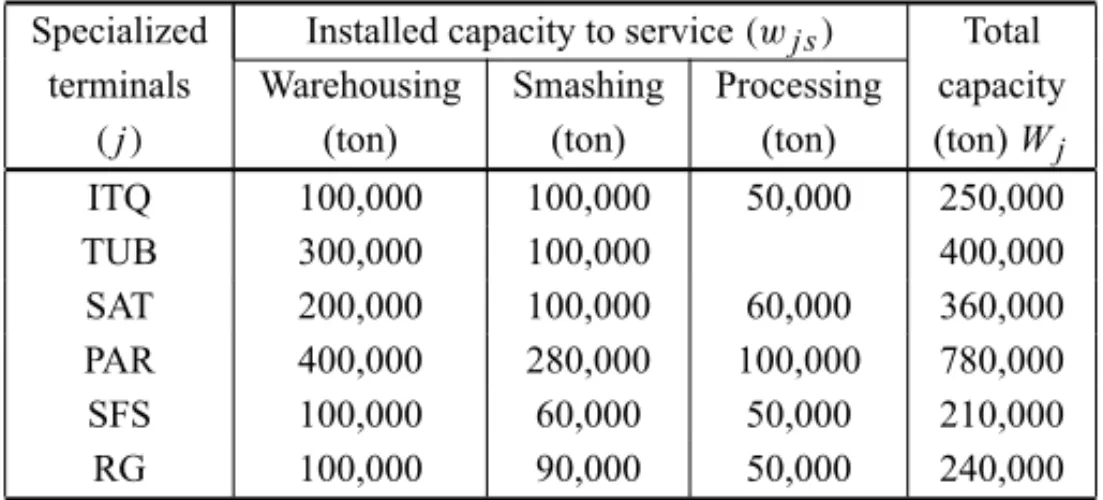
Table 3– Nominal service and total capacity in specialized terminals – 2004.
Specialized Installed capacity to service(wj s) Total
terminals Warehousing Smashing Processing capacity
(j) (ton) (ton) (ton) (ton)Wj
ITQ 100,000 100,000 50,000 250,000
TUB 300,000 100,000 400,000
SAT 200,000 100,000 60,000 360,000 PAR 400,000 280,000 100,000 780,000
SFS 100,000 60,000 50,000 210,000
RG 100,000 90,000 50,000 240,000
Source: Dubke (2006).
Table 4– Maximum demand at destinationsDkq – 2004.
Destinations Products Max. demand
Dk q (ton)
HAM Soymeal 960,000
HAM Soyoil 240,000
ROT Soybean 1,200,000 ROT Soymeal 960,000
ROT Soyoil 240,000
SHG Soybean 1,200,000 SHG Soymeal 960,000
SHG Soyoil 240,000
Total 7,200,000
Source: Dubke (2006).
4.1 Main results
Table 5 summarizes the solutions for a varying number of terminals. It shows that it is economical to have more terminals, since restricting the model to Z ≤ 6 yielded a solution of US$ 241.9 million and Z = 6 was proposed. In addition, all six terminals would operate with storage services but without smashing or processing,i.e., refining, as shown in the first row of Table 5. Soy allocations from the origins to the terminals and from these to destination ports are presented in Tables 6 and 7.
Table 5– Results ofZ≤6 specialized terminals.
Z
F.O. results
US$ M Yj
Yserj v
Warehousing Smashing Processing Z≤6 241,9 ITQ, TUB, SAT, SFS, PAR, RG ITQ, TUB, SAT, SFS, PAR, RG
Z≤5 235,1 ITQ, TUB, SAT, SFS, PAR ITQ, TUB, SAT, SFS, PAR SAT Z≤4 227,9 ITQ, TUB, SAT, PAR ITQ, TUB, SAT, PAR TUB, SAT
Z≤3 216,5 TUB, SAT, PAR TUB, SAT, PAR TUB, SAT, PAR
Z≤2 189,0 TUB, PAR TUB, PAR TUB, PAR
Z=1 115,2 PAR PAR PAR PAR
Note: ITQ (Itaqui), TUB (Tubar˜ao), SAT (Santos), PAR (Paranagu´a), SFS (S˜ao Francisco do Sul) and RG (Rio Grande). Source: Dubke (2006).
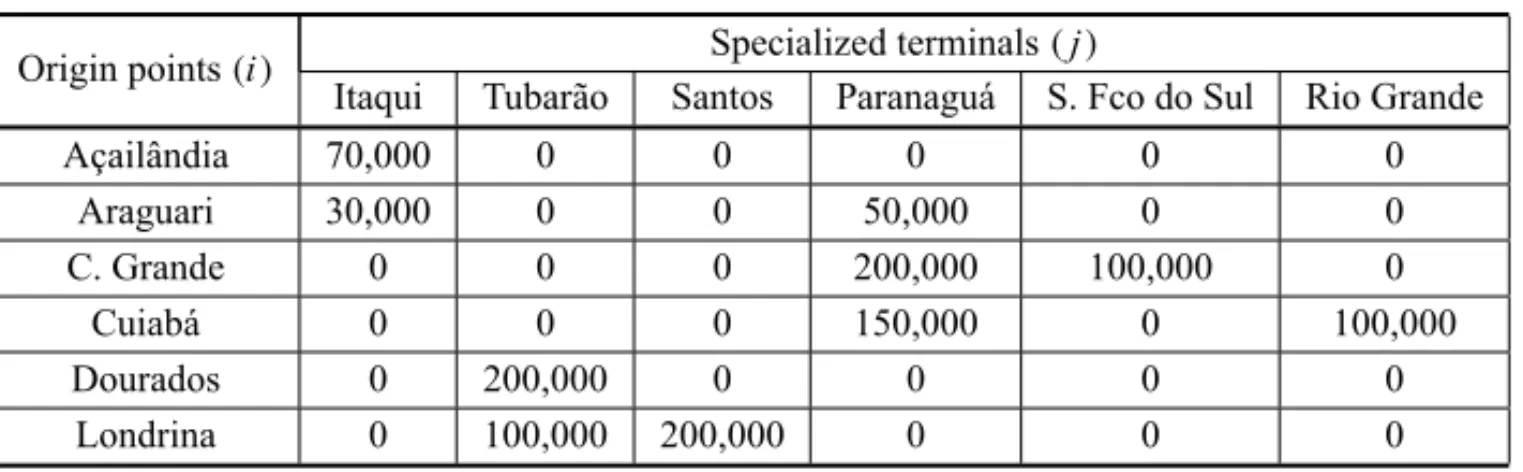
Table 6– Soy allocation flow from origins to specialized terminals (ton).
Origin points(i) Specialized terminals(j)
Itaqui Tubar˜ao Santos Paranagu´a S. Fco do Sul Rio Grande
Ac¸ailˆandia 70,000 0 0 0 0 0
Araguari 30,000 0 0 50,000 0 0
C. Grande 0 0 0 200,000 100,000 0
Cuiab´a 0 0 0 150,000 0 100,000
Dourados 0 200,000 0 0 0 0
Londrina 0 100,000 200,000 0 0 0
Note: Results for the caseZ≤6 terminals. Source: Dubke (2006).
Table 7– Soy allocation flow from specialized terminals to destinations (ton).
Ports(k) Rotterdam Hamburg Shanghai
Itaqui (ITQ) 0 100,000 0
Tubar˜ao (TUB) 300,000 0 0
Santos (SAT) 200,000 0 0
Paranagu´a (PAR) 400,000 0 0 S. Fco. Sul (SFS) 0 100,000 0
Rio Grande (RG) 0 100,000 0
Results for the caseZ≤6 terminals. Source: Dubke (2006).
For just one terminal, Z = 1, Paranagu´a would be the one chosen and would perform all three kinds of services, but the objective function would result in the much smaller amount of US$ 115.2 million.
Table 6 describes the flow of soybeans from each of the six origins to each terminal for the case Z =6.
Table 7 shows the exports from each terminal to each destination. The table suggests that unless Asia pays higher tariffs exports will be only directed to Europe.
4.2 Sensitivity analysis for capacity expansion
Table 8 indicates the solution if the installed capacity in the selected maritime terminals were increased by 100%. Such increase would affect the fixed costs considered in the model. Inte-restingly, if Z is restricted to Z ≤ 6, the solution would recommend Z = 4 terminals (Itaqui, Tubar˜ao, Santos, and Paranagu´a), all operating with storage services. If Z ≤ 3, the port of Santos would be discarded, while forZ ≤2 the two ports would be Tubar˜ao and Paranagu´a. For Z =1, the only port selected would be Paranagu´a, offering warehousing and smashing, but the value of the solution would be reduced expressively.
Table 8– Sensitivity analysis for fixed costs and installed capacity.
Z
F.O. results
US$ M Yj
Yserj v
Warehousing Smashing Processing Z ≤6 246,4 ITQ, TUB, SAT, PAR ITQ, TUB, SAT, PAR
Z ≤5 246,4 ITQ, TUB, SAT, PAR ITQ, TUB, SAT, PAR Z ≤4 246,4 ITQ, TUB, SAT, PAR ITQ, TUB, SAT, PAR Z ≤3 244,3 ITQ, PAR, TUB ITQ, PAR, TUB
Z ≤2 240,6 TUB, PAR TUB, PAR
Z =1 197,1 PAR PAR PAR
Note: ITQ (Itaqui), TUB (Tubar˜ao), SAT (Santos), PAR (Paranagu´a), SFS (S˜ao Francisco do Sul) and RG (Rio Grande). Source: Dubke (2006).
Certainly, the production of grains is highly seasonal and so are prices, and transportation costs but the model has considered yearly averages. This seems reasonable since producers have the possibility of stocking the product awaiting more favorable conditions. Something similar also happens in the ports, which are able to retain stocks to smooth out the in and outflows of the products.
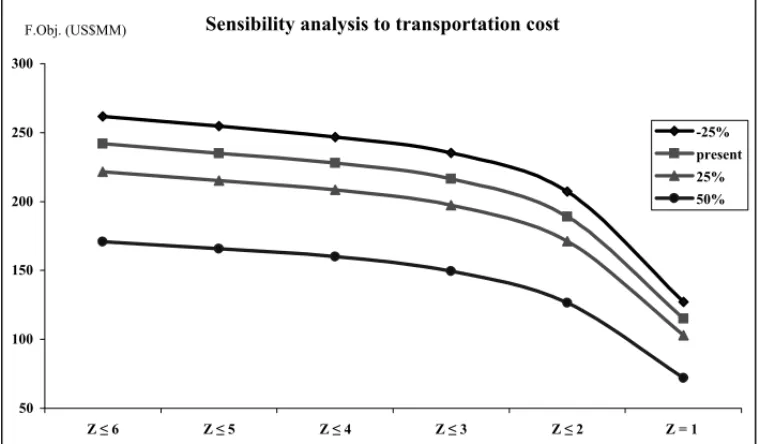
4.3 Sensitivity analysis for transportation costs
the model decreased its objective function. For all cost changes the solution of the model is given by the same variables as presented in Table 5. In addition, Figure 3 shows the relative shift of each solution for each number of terminals Z.
F.Obj. (US$MM)
Figure 3– Sensitivity analysis for transportation costs. Source: Dubke (2006).
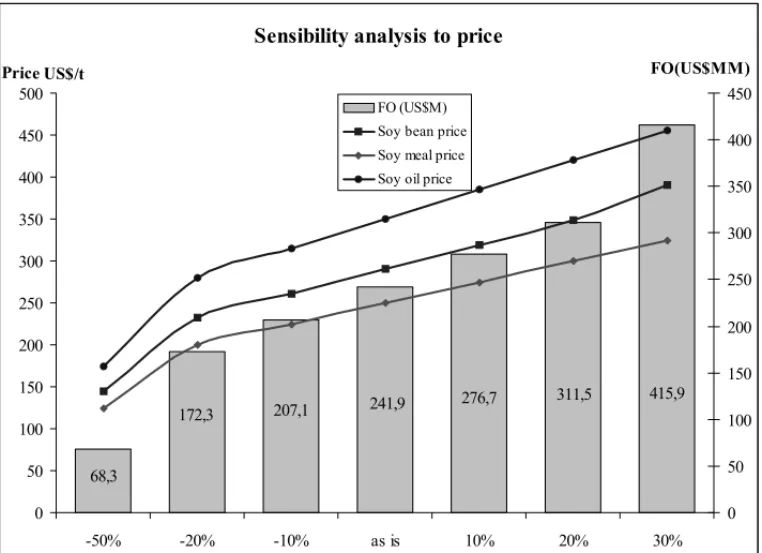
4.4 Sensitivity analysis for prices
Prices in the international market considered in the case study (US$ 290/t for soy, US$ 250/t for soy meal and US$ 350/t for soy oil), have produced an objective function of US$ 241.9 million for the system, according to Table 5. In order to assess the sensitivity, we have applied slight increases of 10%, 20% and 30% in prices, and the model produced objective functions of US$ 276.7 million, US$ 311.5 million and US$ 415.9 million, respectively. Considering a price reduction of 10%, 20% and 50%, the model decreased the objective function value to US$ 207.1 million, US$ 172.3 million, and US$ 68.3 million, respectively, compared to the current solution. Figure 4 indicates the sensitivity to several different price changes and to the three different products: raw soybean, soy meal, and soy oil.
5 CONCLUSIONS
415,9 311,5
276,7 241,9
207,1 172,3
68,3
0 50 100 150 200 250 300 350 400 450 500
-50% -20% -10% as is 10% 20% 30%
0 50 100 150 200 250 300 350 400 450 FO (US$M)
Soy bean price
Soy meal price Soy oil price
Figure 4– Sensitivity analysis for prices. Source: Dubke (2006).
converted, without additional environment damages, into grain production, a more efficient and economically prosperous activity.
On the other hand, the new production frontiers are quite distant from the maritime ports from which the soybeans reach the international markets. The transportation costs are significantly high and they tend to offset the relative advantage resulting from high productivity, less capital costs, and low production costs. Therefore, the major problem that deserves priority is the reduc-tion of the downstream logistics costs since the structure relies today mostly on old trucks and poorly paved roads. In this sense, the ports in the north, like Itaqui, represent a new opportunity, since they can be reached by railway and by rivers. Another problem currently overlooked is the transformation of the soy beans in more valuable products such as the soy oil and the soy meal. Therefore, short-term measures to face the infrastructure problems are: warehousing and further processing.
soy grains into soy oil and soy meal. The objective is to maximize the profitability of exporters taking into consideration the balance between income, port costs, and inbound and outbound transportation costs.
The model’s applicability was tested with realistic data from the supply chain of soybeans. Sen-sitivity evaluations regarding inbound and outbound transportations costs, investments, installed capacity and prices in international markets were also roughly examined. One important element was the sensitivity to the installed capacity, since the modeling, as expected, has considered ave-rage yearly capacity. Certainly, the soybean production is highly seasonal and so are prices, and transportation costs, specially the truck costs. However, producers and cooperatives have the possibility of stocking the product waiting for more favorable conditions, and also the ports may retain the product to balance the incoming and outcoming flows.
We hope that the present exploratory study might motivate more extended ones, supported by the country’s strategic planning authorities, to make long range planning on logistics issues regarding the exports of grains. The idea is to amplify the study both in its extension in order to include all productive areas of the country, and all potential ports, as well as to tackle the problem of the transportation network planning evolution, including new roads, new railroads and river ways specially on the Amazon basin.
ACKNOWLEDGEMENTS
The authors would like to acknowledge several institutions that have granted support to this research. The first author would like to express her gratitude to CAPES, PUC-Rio, Instituto Federal do Espirito Santo – IFES and VALE, while the second author is grateful to the CNPq, that supported partially the research.
REFERENCES
[1] AHUJAR, MAGNANTITL & ORLINJB. 1993.Network flows.Prentice Hall, Inc., New Jersey. [2] BNDES. 2004. BNDES SETORIAL. O ciclo da soja: Desempenho da cultura da soja entre 1961 e
2000. Rio de Janeiro,20: 127–222.
[3] BRANDEAU M & CHIU S. 1989. An overview of representative problems in location research. Management Science,35(6): 645–674.
[4] CAMPBELLJ. 1993. One-to-many distribution with transshipments: an analytic model. Transporta-tion Science,27(4): 330–340.
[5] CANELC & KHUMAWALABM. 1996. A mixed-integer programming approach for the international facilities location problem.International Journal of Operations & Production Management,16(4): 49–68.
[6] CONAB – COMPANHIA NACIONAL DE ABASTECIMENTO. 2008. Indicadores da agropecu´aria. Acessible at:<www.conab.gov.br>; accessed on July, 28.
[8] CVRD – COMPANHIAVALE DORIODOCE, VALE. 2005. Ind´ustria da Soja e Farelo de Soja para Exportac¸˜ao. S˜ao Paulo, Technical report.
[9] DEPAULASR & FAVERET FILHOP. 2000. Panorama do Complexo da Soja. In:BNDES setorial. Special Edition. BNDES, Rio de Janeiro.
[10] DREZNERR & HAMACHERH. 2002 (Ed.).Facility location: applications and theory.Berlin: Verlag publishing.
[11] DUBKEAF. 2006. Modelo de localizac¸˜ao de terminais especializados: um estudo de caso em cor-redores de exportac¸˜ao da soja.Doctoral Dissertation in Industrial Engineering. Programa de P ´os-graduac¸˜ao em Engenharia Industrial, Pontifical Catholic University of Rio de Janeiro.
[12] EMBRAPA – EMPRESA BRASILEIRA DE PESQUISAS AGROPECUARIAS´ . 2002. Tecnologias de produc¸˜ao de soja – Paran´a. Londrina: Embrapa Soja.
[13] FOURERR, GAYDM & KERNIGHANBW. 2003.AMPL – A modeling language for mathematical programming. 2nd Edition, South Melbourne, Australia, Thompson.
[14] HAYUTY. 1981. Containerization and the load center concept.Economic Geography,57(2): 160– 176.
[15] HARKNESSJ & REVELLEC. 2003. Facility location with increasing production costs.European Journal of Operational Research,145: 1–13.
[16] HUTC. 1963. Multi-commodity network flows.Operations Research,11(3): 344–360.
[17] ILOG AMPL CPLEX SYSTEMVERSION8.0 –USER’S GUIDE. FRANCE. 2002. Accessible at:
<www.ampl.com>accessed on 06/06/2005.
[18] IZQUIERDOR. 1994. Transportes – Un Enfoque Integral. Madrid, Colegio de Ingenieros de Caminos, Canales y Puertos.
[19] KONINGSJW. 1996. Integrated centers for the transshipment, storage, collection and distribution of goods: a survey of the possibilities for a high-quality intermodal transport concept.Transportation Policy, Great Britain,3(1/2): 3–11.
[20] MATISZIWT. 2005. Modeling transnational surface freight flow and border crossing improvement. Doctoral Dissertation in Geography, Ohio State University, USA.
[21] OWENSH & DASKINM. 1998. Strategic facility location: a review.European Journal of Operatio-nal Research,111: 423–447.
[22] PIRKULH & JAYARAMANV. 1998. A multi-commodity, multi-plant, capacitated facility location problem: formulation and efficient heuristic solution.Computers and Operations Research, Great Britain,25(10): 869–878.
[23] REVELLECS & EISELTHA. 2005. Location Analysis: A Synthesis and Survey.European Journal of Operational Research,165: 1–19.
[24] REVELLECS & LAPORTEG. 1996. The plant location problem: new models and research prospects. Operations Research,44(6): 864–874.
[26] SIQUEIRATW. 2004. O ciclo da soja: desempenho da cultura da soja entre 1961 e 2003. In:BNDES Setorial, Rio de Janeiro,20: 127–222.
[27] SIDHARAN R. 1995. The capacitated plant location problem. European Journal of Operational Research,87: 203–213.
[28] SOUZAMO, MARQUESDV, SOUZAGS & MARRAR. 2010. O Complexo da soja: aspectos des-critivos e previs˜oes.Pesquisa Operacional para o Desenvolvimento,2(1): 56–86.
[29] USDA – UNITEDSTATESDEPARTMENT OFAGRICULTURE. 2008. Acessible at:<www.usda.gov>
accessed on 07/28/2008.
[30] TANIGUSHIE, NORITAKEN, YAMADAT & IZUMIATNIT. 1999. Optimal size and location planning of public logistics terminals.Transportation Research E,35(3): 207–222.