*e-mail: rodrmagn@fei.edu.br
Kinetics of Sigma Phase Formation In a Duplex Stainless Steel
Rodrigo Magnabosco*
Department of Mechanical Engineering, Ignatian Educational Foundation – FEI,
Av. Humberto A. C. Branco, 3972, office K5-09, 09850-901 São Bernardo do Campo - SP, Brazil
Received: January 14, 2009; Revided: April 24, 2009
This work determines the kinetics of sigma phase formation in UNS S31803 Duplex Stainless Steel (DSS), describing the phase transformations that occur in isothermal aging between 700 and 900 °C for time periods up to 1032 hours, allowing the determination of the Time-Temperature-Precipitation (TTP) diagram for sigma phase and proposing a model to predict the kinetics of sigma phase formation using a Johnson-Mehl-Avrami (JMA) type expression. The higher kinetics of sigma phase formation occurs at 850 °C. However, isothermal aging between 700 and 900 °C for time periods up to 1032 hours are not sufficient to the establishment of thermodynamic equilibrium. Activation energy for both nucleation and growth of sigma phase is determined (185 kJ.mol–1) and its value is equivalent to the activation energy for Cr diffusion in ferrite, indicating that diffusion of Cr is probably the major thermally activated process involved in sigma phase formation. The determined JMA type expression presents good fit with experimental data between 700 and 850 °C.
Keywords: duplex stainless steels, sigma phase, phase transformations, kinetics
1. Introduction
Duplex Stainless Steels (DSS) are widely used in applications that demand high mechanical resistance, toughness and corrosion resist-ance1-5. UNS S31803, which presents typical chemical composition Fe-22% Cr-5% Ni-3% Mo-0,15% N-0,02% C[2], has a microstructure of 40-45% of ferrite and 55-60% austenite, obtained after solution heat treatment at temperatures between 1000 and 1200 °C, followed by water quenching6.
However, during heating between 700 and 900 °C precipitation of a hard and brittle Cr-rich phase, called sigma, can occur, result-ing in brittleness and reduction in corrosion resistance6-14. There are strong indications that sigma phase formed at 900 °C present isolated particles morphology, precipitated from ferrite; however, between 700 and 800 °C eutectoid decomposition of ferrite is observed, resulting in a lamellar morphology of sigma phase and secondary austenite, impoverished in Cr and Mo if compared to the original austenite present in the duplex structure15. At 850 °C, sigma phase can be formed by three distinct mechanisms: nucleation and growth from original ferrite, eutectoid decomposition of ferrite (also forming secondary austenite) and growth from austenite after total consump-tion of original ferrite6,7. These three mechanisms lead to Cr depletion at the metallic matrix surrounding sigma phase, resulting in lower corrosion resistance.
It was found that sigma phase preferably forms at ferrite/austenite interfaces, but its formation is delayed with increasing high coher-ent, low energy ferrite/austenite interfaces that can be formed during weld procedures16. In-situ synchrotron X-ray diffraction showed that the mechanisms of sigma phase formation between 700 and 850 °C changed from discontinuous precipitation in the early stages of transformation to the growth of the existing sigma after nucleation site saturation17.
The fraction of sigma phase can be described by a Johnson-Mehl-Avrami (JMA) type expression, as showed in Equation 1, where f is the fraction of sigma phase formed (0 <f <1) after an iso-thermal treatment at a time period t, and k is defined by Equation 2, where Qσ is the activation energy for sigma phase formation and R is the universal gas constant (8,31 J.mol–1.K–1). The exponent n can
assume values between 0.5 and 2.5 for diffusion controlled growth or values from 1 to greater than 4 if phase formation occurs as discontinuous precipitation or interface controlled growth 18.
f= −1 e(−k t. )n (1)
k k e
Q R T = −
0. .
σ (2)
UNS S31803 DSS isothermically aged between 700 and 850 °C17 for time periods up to 10 hours showed variations in n exponent from 7, in the earlier stages of sigma phase formation, to values lower than 0.7 after 10 hours aging. Other work19 suggested that n = 4.11 during isothermal aging between 850 and 900 °C for time periods up to 40 minutes. These works did not extract from experimental data any activation energy for sigma phase formation, and there are no indications of a complete expression that can estimate the fraction of sigma phase formed during isothermal aging.
This work determines the kinetics of sigma phase forma-tion in UNS S31803 DSS, describing the phase transformaforma-tions that occur in isothermal aging between 700 and 900 °C for time periods up to 1032 hours, allowing the determination of the Time-Temperature-Precipitation (TTP) diagram for sigma phase and proposing a model to predict the kinetics of sigma phase formation using a JMA type expression.
2. Experimental Procedure
ag-were conducted in a tubular electric furnace with solid-state controller, which maintained aging temperature 1 °C around the chosen tempera-ture, under a 99.9% N2 atmosphere, in order to suppress oxidation of the sample surfaces and prevent nitrogen loss from the DSS. Water quenching interrupted the heat treatments.
After the heat treatments the specimens were abraded using silicon carbide (SiC) papers to a 600-grit finish before mounting in thermosetting plastic, leaving an exposed surface area of approximately 0.5 cm2, parallel to the rolling direction. The mounted specimens were metallographic polished in a semi-automatic grounding and polishing machine, with final polishing provided by 1µm diamond abrasive. After metallographic polishing samples were etched for 40 seconds in modified Behara reagent, composed of 20 mL hydrochloric acid (HCl), 80 mL distilled water and 1g potassium metabissulfide (K2S2O5); to this stock solution, 2 g of ammonium bifluoride (NH4F HF) were added just before the etching. This etching procedure allowed the distinction between ferrite, austenite and sigma phases, and their presence in the microstructure was
Scanning electron microscopy (SEM) helped in phase determination through backscattered electron image (BEI), considering that sigma phase appears as a lighter phase at BEI images as a consequence of its higher Cr and Mo contents; chromium nitrides, on the other hand, appears darker than other phases because of its N content.
Selective etching of sigma phase was obtained through electrolytic etching in 10% potassium hydroxide (KOH) aqueous solution, using 2 Vdc during 1 minute. This etching procedure allowed quantitative metallography of sigma phase, performed in 40 fields equivalent to the one showed in Figure 1c with an automated image analysis system attached to an optical microscope. Ferrite content of the samples was obtained through 30 magnetic measurements at each specimen. Mean values and standard deviations of the measured ferrite and sigma volume fractions were obtained from those measurements.
3. Results
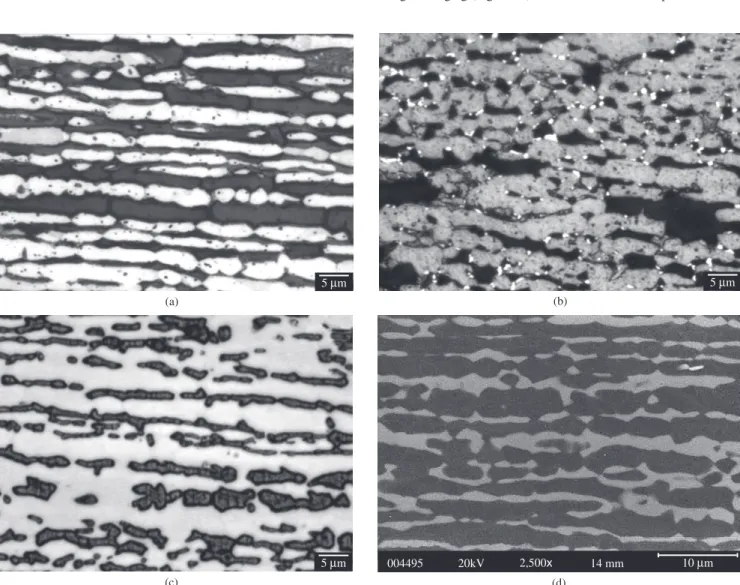
Figure 1a shows typical microstructures found in the solution-treated specimens, containing only austenite and ferrite; the ferrite content of the solution treated sample is 40.9 ±1.9%. Aged samples showed sigma phase formation always associated to ferrite-austenite interfaces (Figure 1b), and sigma phase growing is also observed ( Figure 1c). Long-term aging (Figure 1d) resulted in total consumption of ferrite,
Figure 1. Typical microstructures found in the UNS S31803 DSS studied: a) solution-treated, showing ferrite (dark) and austenite; b) aged 10 minutes at 850 °C, showing ferrite (dark), austenite (gray) and sigma; c) aged 1 hour at 850 °C, sigma selectively etched; d) aged 100 hours at 850 °C, showing austenite (dark) and sigma. a) and b) are optical micrographs after modified Behara etching; c) is optical micrograph after KOH electrolytic etching; d) is BEI.
Table 1. Chemical composition of the investigated steel (wt.(%))
Cr Ni Mo Mn Si N C
Figure 2. Examples of X-Ray diffraction patterns found in this study: a) solution-treated; b) aged 10 minutes at 850 °C; c) aged 1 hour at 850 °C; d) aged 100 hours at 850 °C. Ferrite, austenite and sigma characteristic peaks are represented by α, γ and σ respectively.
and the microstructure in those cases are composed by austenite and sigma phases only. In all aging temperatures, there is no evidence of eutectoid-like transformation products. Phase identification is confirmed by X-ray diffraction patterns, as showed in Figure 2.
Figures 3 to 7 show ferrite and sigma phase volume fraction as a function of aging time for the 5 studied temperatures. It can be observed that sigma phase formation is strongly related to ferrite consumption, confirming the Optical Microscopy (OM) and SEM observations. Between 700 and 850 °C, the volume fraction of sigma phase presents an increase up to a maximum about 50-54% (Figures 3 to 6), but at 900 °C the maximum volume fraction was approximately 40%, occurred after 100 hours of ageing (Figure 7).
Figures 3 to 6 also showed that between 700 and 850 °C the maximum amount of sigma phase formed is higher than the original ferrite content, indicating that after total consumption of ferrite, sigma phase can grow from the existing austenite. This behavior was not observed at 900 °C, where the maximum amount of sigma phase formed is equivalent to the initial ferrite content; those observations suggest differences in the sigma phase formation mechanisms.
Chromium nitride was observed only in BEI analysis of the specimen aged 1008 hours at 850 °C, as showed in Figure 8. From eight SEM images the volume fraction of nitride was estimated in 0.4%; the small amount of nitride formed explains the absence of nitride characteristic peaks in X-Ray diffraction patterns. After the calculation of the equilibrium phase content as a function of
tem-perature using Thermo-Calc® software and TC-Fe5 database, showed in Figure 9, the observed nitride was identified as hexagonal close packed (HCP) nitride (Cr2N type).
4. Discussion
It can be noted in Figure 9 that equilibrium content of sigma phase reaches approximately 28% at 700 °C, lower than the maximum sigma phase observed after 1032 hours at this temperature (54%, Figure 3). The same occurred in the other studied temperatures, sug-gesting that equilibrium is not reached at the studied temperatures even considering the long-term aging applied. The calculated equi-librium volume fraction of nitride at 850 °C (approximately 2%) is also higher than the volume fraction found after 1008 hours aging at this temperature (0.4%), another indication that equilibrium is not reached at the studied temperatures.
Experimental data, however, allows the determination of sigma phase formation kinetics, and the TTP diagram for sigma phase between 700 and 900 °C can be plotted (Figure 10) by mathemati-cal extrapolation of the measured volume fraction of sigma phase showed in Figures 3 to 7. It can be observed that higher sigma phase formation kinetics occurs at 850 °C, marked by the “nose” noted in this temperature in the C-type curve.
Another possible analysis initiates in the fact that sigma phase formation is strongly related to ferrite consumption, and the obser-vation that sigma preferably nucleates at ferrite-austenite interfaces. In order to obtain a kinetic model, Equation 1 was re-arranged, leading to Equation 3, which allows the data analysis of Figure 11; n-exponent and k factor of JMA equation for every temperature Figure 3. Ferrite and sigma phase content (vol. %) as a function of aging time at 700 °C.
Figure 5. Ferrite and sigma phase content (vol%) as a function of aging time at 800 °C.
Figure 6. Ferrite and sigma phase content (vol. %) as a function of aging time at 850 °C.
Figure 7. Ferrite and sigma phase content (vol. %) as a function of aging time at 900 °C.
Figure 8. BEI of specimen aged 1008 hours at 850 °C, showing sigma (lighter), austenite (gray) and a darker phase identified as HCP nitride (Cr2N type).
Figure 9. Equilibrium volume fraction of phases thermodynamically calculated.
studied can be extracted from Figure 11, and these values are sum-marized in Table 2.
ln[−ln(1−f)]=n ln t.[ ( )]+ln k( ) (3)
Re-arrange of Equation 2 allows the plot of Figure 12, and according to Equation 4 is possible to determine the activation energy for both nucleation and growth of sigma from ferrite (Qσ) and the value of pre-exponential term (ko), which are Qσ=185 kJ.mol–1 and ko=1.6.10[9]. However, as can be seen in Figure 12, those values are valid only between 700 and 850 °C, in which is possible to approximate a linear behavior; k and n values for 900 °C lead to a point outside the line used to determine Qσ and ko.
ln k Q
R T ln k
( )= − σ
( )
−1 + ( 0) (4)The activation energy for both nucleation and growth of sigma phase from ferrite of 185 kJ.mol–1 is similar to the activation energy for Cr-diffusion in ferrite (235 ±15 kJ.mol–1 for bulk diffusion20-23 and 218 kJ.mol–1 for grain-boundary diffusion in α-Fe23), and smaller than the activation energy for Cr-diffusion in austenite (278 ±10 kJ.mol–1)20,24, indicating that sigma phase nucleation and growth from ferrite strongly depends on Cr-diffusion to the grain boundaries or ferrite-austenite interfaces. The dependence of sigma formation with Cr diffusion in ferrite is expected, since nucleation of sigma phase always occurs at ferrite-austenite interfaces, and growth of sigma phase are strongly related to consumption of ferrite.
Mo diffusion in ferrite, however, presents higher activation energy for diffusion (289 ± 13 kJ.mol–1) 25,26 than the activation energy for both nucleation and growth of sigma phase from ferrite (185 kJ.mol–1). This indicates that diffusion of Cr is probably the major thermally activated process involved in sigma phase formation.
The mean value of n = 0.915 ± 0.144 determined in the valid range of Qσ and ko (from 700 to 850 °C), near unity, is associated in the literature18 to discontinuous precipitation, considering grain boundary nucleation after saturation. The assumption of nucleation site saturation is valid, assuming the typical microstructures found in the earlier stages of sigma formation, as showed in Figure 1b.
Using the values of n, Qσ and ko, Equation 1 can be re-written into Equation 5, which allows the prediction of the amount of sigma phase formed during isothermal ageing of the studied DSS. A com-parison between the experimental data of volume fraction of sigma and calculated values is presented in Figures 13 to 17, assuming that the maximum sigma phase formed at a given temperature occurs when f = 1. Equation 5 allows the estimation of sigma phase content with very good correlation factors for temperatures between 700 and 800 °C (Table 3). However, increasing temperature leads to reduction in the correlation factor and higher differences between experimental and calculated values in the earlier stages of sigma phase formation: for aging times up to 0.3 hours, Equation 5 always predicted a higher sigma phase content (Figures 13 to 15).
f e t e
T = 1 1 6 109 0 915
185 103 8 31 – – . . . . – . . . (5)
The absence of a good fit in the earlier stages of sigma phase formation can be associated to the variations of n exponent reported in the literature17 from 7 to values lower than 0.7 after 10 hours aging, which indicates that the mechanism of sigma phase formation is initially governed by discontinuous precipita-tion or interface controlled growth and, after site saturaprecipita-tion, it changes to diffusion controlled growth 18. In both cases, however, the diffusion of Cr – for nucleation in the earlier stages or in the growing of sigma phase – plays an important role in the sigma phase formation kinetics.
Table 2. n-exponent and k factor of JMA equation for sigma phase formation from ferrite in the studied DSS.
T [°C] 700 750 800 850 900
n 1.03 0.71 0.92 1.00 0.82
k 0.15 0.92 2.20 3.00 0.62
Figure 11. JMA plot of sigma phase formation from ferrite as a function of ln transformation time (hours) at each of five studied transformations. Linearity and high correlation factor (R² = 0.98 for 850 °C data is showed) indicates the same sigma phase formation mechanism in all studied transformation times at 850 °C.
Figure 12. Plot for determination of activation energy for both nucleation and growth of sigma from ferrite (Qσ) and the value of pre-exponential term (ko), in temperatures between 700 and 850 °C.
5. Conclusions
• TTPdiagramforsigmaphaseinUNSS31803DSSbetween
700 and 900 °C was obtained, showing higher kinetics of sigma phase formation at 850 °C;
• Isothermalagingbetween700and900°Cfortimeperiods
up to 1032 hours are not sufficient to the establishment of thermodynamic equilibrium in UNS S31803 DSS;
• Nucleationofsigmaphaseoccurspreferablyatferrite-austenite
interfaces, and growth of sigma phase is strongly related to consumption of ferrite;
• Activation energy for both nucleation and growth of sigma
phase was determined (185 kJ.mol–1, equivalent to the activation energy for diffusion in ferrite), indicating that diffusion of Cr is probably the major thermally activated process involved in sigma phase formation; and
• AJMAtypeexpressionwasdeterminedtoestimatethefrac -tion of sigma phase formed during isothermal aging of UNS S31803 DSS, presenting good fit with experimental data between 700 and 850 °C.
References
1. Erbing ML, Groth HL. Duplex-un’alternativa all’acciaio inossidabile 316 per il risparmio di peso in applicazioni offshore. L’Acciaio Inossidabile. 1993; (2):10-13.
2. Eckenrod JJ, Pinnow KE. Effects of chemical composition and thermal history on the properties of alloy 2205 duplex stainless steel. In: New Developments in Stainless Steel Technology; 1984; Detroit. Detroit: Metals Park, American Society for Metals; 1985. p. 77-87.
Figure 13. Experimental and calculated sigma phase content (vol. %) as a function of aging time at 700 °C.
Figure 14. Experimental and calculated sigma phase content (vol. %) as a function of aging time at 750 °C.
Figure 15. Experimental and calculated sigma phase content (vol. %) as a function of aging time at 800 °C.
Figure 16. Experimental and calculated sigma phase content (vol. %) as a function of aging time at 850 °C.
60 50 40 30 20 10 0
0.01 0.1 1 10 100 1000 10000
V
olume fraction of sigma (%) experimental
calculated
Aging time at 900 °C (hours)
Figure 17. Experimental and calculated sigma phase content (vol. %) as a function of aging time at 900 °C.
Table 3. Correlation factor (R²) between experimental and calculated sigma phase content for the studied temperatures.
T [°C] 700 750 800 850 900
3. Nordström J, Rung B. Bollitori e torri di stoccaggio di pasta per carta in acciai inossidabili duplex consentono risparmio di peso e di costi.
L’Acciaio Inossidabile. 1995; 2:7-12.
4. Leffler B. Alloy 2205 for marine chemical tankers.Materials Performance. 1990; (4):60-63.
5. Agarwal DC. Duplex stainless steels: the cost effective answer to corrosion problems of major industries. Key Engineering Materials. 1988; 20-28(20):1677-1692.
6. Nilsson JO. Super duplex stainless steels. Materials Science and Technology. 1992; 8(8):685-700.
7. Magnabosco R, Alonso-Falleiros N. Pit morphology and its relation to microstructure of 850 °C aged uns s31803 duplex stainless steel.
Corrosion. 2005; 61(2):130-136.
8. Magnabosco R, Alonso-Falleiros N. Sigma phase and polarization response of UNS S31803 in sulfuric acid.Corrosion. 2005; 61(8):807-814. 9. Gilman JJ. Hardening of high-chromium steels by sigma phase formation.
Transactions of the American Society for Metals. 1951; 43:161-192. 10. Hoar TP, Bowen KW. The electrolytic separation and some properties
of austenite and sigma in 18-8-3-1 chromium-nickel-molybdenum-titanium steel. Transactions of the American Society for Metals. 1953; 45:443-474.
11. Hall EO, Algie SH. The sigma phase.Metallurgical reviews. 1966; 11:61-88.
12. Solomon HD, Devine Jr. TM. Duplex stainless steels: a tale of two phases. In: Conference of the Duplex Stainless Steels; 1982; Ohio. Ohio: ASM; 1982. p. 693-756.
13. Brandi SD, Padilha AF. Precipitação de fase siga em aços inoxidáveis ferríticos-austeníticos com microestrutura duplex. In: INOX’90; 1990; São Paulo. São Paulo: Nucleoinox; 1990. p. 135-152.
14. Potgieter JH, Premachandra K, Jackson EMLEM, Nana S.Duplex: complex or simplex. FWP Journal. 1991; 31(1):17-29.
15. Barbosa CA, Mori FY, Souza MHC, Falleiros IGS.Formação de fase sigma em aço inoxidável austenítico-ferrítico. Metalurgia ABM; 32(227):669-673.
16. Sato YS, Kokawa H. Preferential precipitation site of sigma phase in duplex stainless steel weld metal. Scripta Materialia. 1999; 40(6):659-663. 17. Elmer JW, Palmer TA, Specht ED. Direct observations of sigma
phase formation in duplex stainless steels using in-situ synchrotron X-Ray diffraction. Metallurgical and Materials Transactions A. 2007; 38A(3):464-475.
18. Christian JW. The theory of transformations in metals and alloys: Part I. 3 ed. Oxford: Elsevier; 2002. p. 538-546.
19. Calliari I, Zanesco M, Ramous E. Influence of isothermal aging on secondary phases precipitation and toughness of a duplex stainless steel SAF 2205. Journal of Materials Science. 2006; 41(22):7643-7649. 20. Bowen AW, Leak GM. Solute diffusion in Alpha- and Gamma-Iron.
Metallurgical Transactions. 1970; 1(6):1695-1700.
21. Bowen AW, Leak GM. Diffusion in Bcc Iron Base Alloys. Metallurgical Transactions. 1970; 1(10):2767-2773.
22. Terentyev D, Malerba L. Diffusivity of solute atoms, matrix atoms and interstitial atoms in Fe-Cr alloys: a molecular dynamics study. Journal of Nuclear Materials. 2004; 329-333(2):1161-1165.
23. Wang ZB, Tao NR, Tong WP, Lu J, Lu K. Diffusion of chromium in nanocrystalline iron produced by means of surface mechanical attrition treatment.Acta Materialia. 2003; 51(2):4319–4329.
24. Ruzickova J, Million B. Self-diffusion of the components in the FCC phase of binary solid solutions of the Fe-Ni-Cr System. Materials Science and Engineering. 1981; 50(1):59-64.
25. Borisov VT, Golikov VM, Sherbendinskiy GV. Diffusion of molybdenum in iron and iron-molybdenum alloy.Fiz. Metallov i Metalloved. 1966; 22(7):175-176.
26. Nitta H, Miura K, Iijima Y. Self-diffusion in iron-based Fe-Mo alloys.