Populational fluctuation and spatial distribution of
Alphitobius diaperinus (Panzer) (Coleoptera; Tenebrionidae)
in a poultry house, Cascavel, Parana state, Brazil
Chernaki-Leffer, AM.
a*, Almeida, LM.
a, Sosa-Gómez, DR.
b, Anjos, A.
cand Vogado, KM.
daDepartamento de Zoologia, Universidade Federal do Paraná – UFPR, CP 19020, CEP 81531-990, Curitiba, PR, Brazil bCentro Nacional de Pesquisa da Soja, CP 231, CEP 86001-970, Londrina, PR, Brazil
cDepartamento de Estatística, UFPR, CP 19081, CEP 81531-990, Curitiba, PR, Brazil dUniversidade do Oeste do Paraná – UNOESTE, Cascavel, PR, Brazil
*e-mail: [email protected]
Received February 21, 2005 – Accepted April 25, 2005 – Distributed May 31, 2007 (Whith 2 figures)
Abstract
Knowledge of the population fluctuation and spatial distribution of pests is fundamental for establishing an appropriate control method. The population fluctuation and spatial distribution of the Alphitobius diaperinus in a poultry house in Cascavel, in the state of Parana, Brazil, was studied between October, 2001 and October 2002. Larvae and adults of the lesser mealworm were sampled weekly using Arends tube traps (n = 22) for six consecutive flock grow-outs. The temperature of the litter and of the poultry house was measured at the same locations of the tube traps. Beetle numbers increased continuously throughout all the sampling dates (average 5,137 in the first week and 18,494 insects on the sixth week). Significantly greater numbers of larvae were collected than adults (1 to 20 times in 95% of the sampling points). There was no correlation between temperature and the number of larvae and adults collected, therefore no fluctuation was observed during the sampling period. The population growth was correlated to litter re-use. The highest temperatures were observed in deep litter. The spatial distribution of larvae and adults in the poultry house was hetero-geneous during the whole period of evaluation. Results suggest that monitoring in poultry houses is necessary prior to adopting and evaluating control measures due to the great variability of the insect distribution in the poultry house.
Keywords: lesser mealworm, poultry house, temperature, population dynamic.
Flutuação populacional e distribuição espacial de
Alphitobius diaperinus
(Panzer)
(Coleoptera; Tenebrionidae) em granja avícola de corte em Cascavel, Paraná
Resumo
O conhecimento da flutuação populacional e distribuição espacial de pragas são fundamentais para o estabelecimento de uma metodologia de controle adequada. A flutuação populacional e distribuição espacial de Alphitobius diaperinus em aviário de corte, localizado em Cascavel, Paraná foi avaliada no período entre outubro/2001 e Outubro/2002. Larvas e adultos do cascudinho foram coletados semanalmente com armadilhas de Arends (n = 22) em seis lotes de frangos, consecutivamente. A temperatura da cama foi medida nos locais onde as armadilhas foram expostas, bem como a temperatura no interior do galpão do aviário. O número de besouros aumentou continuamente em todas as áreas do aviário no decorrer das semanas de coleta (média de 5.137, na primeira semana, e de 18.494 insetos, na sexta semana). O número de larvas coletadas foi significantemente maior que o número de adultos (de 1 a 20 vezes em 95% do total de coletas realizadas). Não houve correlação entre as variações de temperatura do galpão e da cama e o nú-mero de insetos coletados, não sendo, portanto, observada flutuação populacional ao longo do período de avaliação. O crescimento da população esteve relacionado ao acúmulo de camas, observando-se temperaturas mais altas em locais onde a cama era mais profunda. A distribuição espacial de larvas e adultos no galpão foi desuniforme com relação aos locais de coleta. Com base nos resultados obtidos, sugere-se que há necessidade de monitoramento dos aviários individualmente antes do emprego de qualquer medida de controle, devido à grande variabilidade na distribuição dos insetos em um único galpão de criação.
1. Introduction
Insect population dynamics are influenced by a va-riety of genetic and environmental factors (Clark et al., 1967). Understanding these factors is an important tool for use in integrated pest management (IPM). Effective IPM requires, a) understanding population cycles by regular sampling for decision making regarding the ef-fectiveness of control and appropriate pesticide use (Safrit and Axtell 1984); b) gathering and analysing in-formation on the efficiency of control; c) understanding pest habitat selection through continuous field studies; and d) understanding the metabolic importance of en-vironmental conditions, such as temperature, especially when held at optimal and constant levels. Here we ex-amine some of these conditions to study control of a chicken house pest.
The lesser mealworm, Alphitobius diaperinus (Panzer, 1797) (Coleoptera: Tenebrionidae) is the most abundant beetle inhabiting litter in chicken (broiler) houses in Brazil. The life cycle (from eggs to adults) takes 89 days at 22 °C and 26 days at 31 °C (Chernaki and Almeida, 2001a, b). Hence, temperatures inside poultry houses (21 to 33 °C) are ideal for the devel-opment of the mealworm. Litter temperature in the chicken houses (between 25 and 30 °C) and the chicken growth interval (nearly 50 days) permit the concurrent development of a full life cycle of the mealworm dur-ing the completion of hatchdur-ing to adult of a grow-out of chickens (Erichsen and Jespersen, 1997; Salin et al., 2000).
Controlled temperature in poultry houses with long lasting manure accumulation and adequate moisture pro-vide favorable conditions for the development of bee-tles throughout the year (Stafford and Collison, 1987). Climate effects are mitigated since beetles live in a shel-tered environment (Pfeiffer and Axtell, 1980). However, in Californian turkey brooder houses, the mealworm population responds to seasonal fluctuations of tem-perature, with larger populations at higher temperatures (spring and summer) (Voris et al., 1994). Spatial distribu-tion of adult mealworms is favored by high soil moisture, low compactness of the soil surface and low density of the soil, while larvae and pupae do not require moisture (Salin et al., 2000).
In a spatial analysis of the lesser mealworm in broiler production facilities, a model was developed that was limited by the dynamics of beetle population. That is, populations did not follow simple rules even though environmental conditions within the poultry house were uniform over time (Strother and Steelman, 2001).
Due to the importance of the beetles and lack of stud-ies in Brazilian poultry houses, we studied population dynamics and spatial distributions to better understand how to control this potentially important insect pest.
2. Material and Methods
2.1. Conditions and management of a poultry house
Lesser mealworm larvae and adults were collected at a poultry house in the city of Cascavel, Parana, in southern Brazil. The poultry house (12 x 133 m, oriented more or less E-W) held approximately 21,000 chickens. Wood shavings (litter) were used to cover the floor of the house. Litter was re-used after each flock for up to 43 weeks. The growth period for each grow-out was 43 - 50 days. After completion of a grow-out, litter was re-moved by tractor and scraper and disinfected with quater-nary ammonia. At that time, walls and ceiling were sprayed with the insecticide cypermethrin (Cypermil®- Ouro Fino
1.3 liters diluted into 1,000 liters H2O, approximately 627 mL.m-2).
2.2. Insect collection
Adults and larvae stages of lesser mealworm were sampled from October 2001 to October 2002. Insects were collected with Arends tube traps (Safrit and Axtell, 1984). This trap is commonly used to evaluate insecticide efficiency for litter beetle control (Turner, 1986). Twenty-two traps were placed in the litter below feeders: seven in each side row and eight in the central row. Temperature in the house was measured using a DeltaTRAK®
dig-ital thermometer. Traps were collected weekly, placed in plastic bags and frozen. Beetles (larvae, adult) from each trap were counted. Concurrent with this study, cypermethrin (Cypermil®, Ouro Fino - 300 mL.60 L-1
H2O - 38 mL.m-2) was applied between the third and
fourth usage of the litter, under the feeders where meal-worms were most abundant.
2.3. Statistical Analysis
Data were not normalizable, and so analysis used Kruskal-Wallis tests, Wilcoxon, Signal test and Multiple Comparators Analysis for cases of big samples (Campos, 1983), with Software R (Ihaka and Gentleman, 1996) and Sigmastat (Jandel Scientific, 1994). The effect of the insecticide on insect abundance populations was performed by using the Signal Test. The litter tempera-ture and insects distribution were analyzed by using the Kruskal-Wallis test and Multiple Comparators Analysis for cases of big samples. Spatial distribution was ana-lyzed by using the Kruskal-Wallis and Wilcoxon tests.
3. Results
3.1. Population Variation and Temperature
3.2. Population variation and litter
Mealworm abundance was related to the repeated use of the litter. Total mealworm abundance (p = 0.004) and mealworm larval abundance (p = 0.03) decreased dramatically between the third and fourth litter usage when the insecticide was applied. Mealworm popula-tions grew again beginning with the fifth brood and by the sixth brood, abundance was at pre-treatment levels (Table 1, Figure 1).
3.3. Population distribution and litter temperature
Temperature varied among grow-outs: first flock (p = 0.02) second, third, fourth, fifth and sixth flocks (p < 0.001, Kruskal-Wallis). Litter temperature varied among traps (Campos 1983 test). Litter temperature was highest near the entrance, at feeders 1 - 3, 13 - 15 and 16 - 18. Traps 1, 2, 3, 14, 15, 16 and 17 (eastern side of the house) had temperatures significantly greater, in all samples (p < 0.001) compared to the litter temperature under the traps 5, 6, 7, 8 and 22 (west side) where lit-ter was shallow. Litlit-ter temperature was similar under the traps 4, 9, 10, 11, 12, 13, 18, 19, 20 and 21 (p > 0.05, house center).
Differences in temperature litter parameters and in-sect abundance per site (22 traps) were tested using the Kruskal-Wallis test. The number of mealworms was sim-ilar on the first, fifth and sixth grow-outs. Insect numbers significantly greater were observed in the second flock larvae (p = 0.005); adults (p = 0.003) and larvae plus adults (p = 0.003); third flock only of adults (p = 0.013) and fourth flock to larvae (p = 0.0005), adults (p = 0.026) and larvae plus adults (p = 0.021). These results show that the distribution of the mealworms is heterogeneous and unrelated to temperature (p < 0.05).
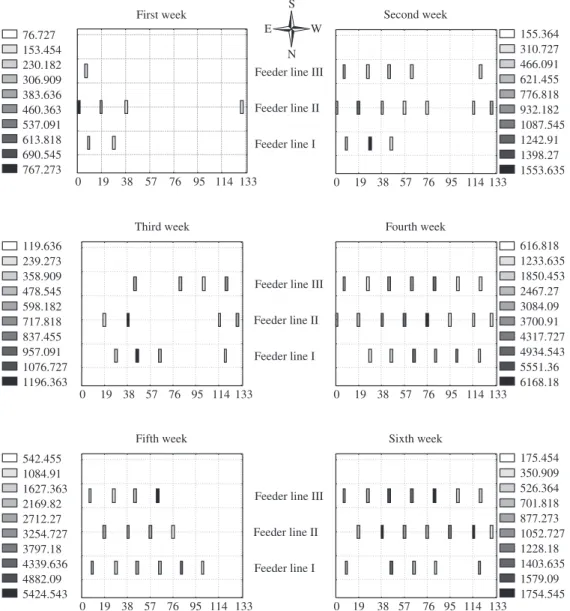
3.4. Spatial distribution in litter
Beetle numbers increased continuously throughout the sampling dates (average 5,137 the first week and 18,494 insects in the sixth week). Mealworm abundance and distribution under the feeders at each row (north side row, central row and south side row) were compared. These three rows were different only in the fifth grow-out (Kruskal-Wallis, p < 0.05) and the number of larvae (Wilcoxon, p = 0.02) and adults (Wilcoxon, p = 0.003) on the south side were greater than on the north side. More adults were collected in the litter where there was no poultry (west side). The house was separated in
Table 1. Adults and larvae number of A. diaperinus collections in a poultry house in Cascavel Parana State during October, 2001 to October, 2002.
Grow-out Total abundance of adults
Total abundance of larvae
Total abundance of larvae plus adults
Litter temperature (°C)1
House temperature (°C)1
Flock I 13,764 32,879 46,643 27.3 ± 1.85 25.0 ± 1.57 Flock II 6,570 63,000 69,570 30.9 ± 0.64 24.2 ± 0.65 Flock III 8,445 125,589 134,034 33.2 ± 1.01 25.0 ± 0.52 Flock IV 6,790 60,877 67,667 34.2 ± 0.23 27.7 ± 0.61 Flock V 18,993 93,746 112,739 31.8 ± 0.57 22.4 ± 0.71 Flock VI 38,527 106,696 145,223 30.5 ± 1.19 22.5 ± 1.20
1Mean value ± SE.
Figure 1. Population fluctuations of A. diaperinus related to litter re-use in poultry houses. 0
20 40 60 80 100 120 140
Insects ab
undance (
x
10
3)
0 5 10 15 20 25 30 35 40
Flock II
Mean temperature (°C)
Flock I Flock III Flock IV Flock V Flock VI
Adults Larvae
two parts: the East, from the entrance of the house to 66.5 m and the West, which was the remainder. Both were very different in the number of mealworms collected (Figure 2).
4. Discussion
Larvae were more abundant than adults in most of the samples. Population fluctuation of the lesser meal-worm does not seem to be related to the temperature in the poultry house and it increased 60 days after insecti-cide application (also see Voris et al., 1994). Therefore, the lack of a population decline in winter may be due to limited annual temperature variation within poul-try houses (20.5 to 28.3 °C) and in the litter (25.1 to 35.1 °C). However, Strother and Stellman (2001) do not agree with Voris et al. (1994) who describe similar trends
in poultry houses with relatively uniform environmental conditions: in the first week of the third grow-out an av-erage of 86 adult and eight larval beetles per trap were caught; on the eighth week of the third grow-out, the beetle population was distributed throughout the entire house and an average of 339 adults and 808 larvae per trap were caught. This differs, however, from previously reported results by Voris et al. (1994) in which it was shown that the mealworm population responds to sea-sonal fluctuations in temperature and follows the rise and fall of the temperature outside the house (variations of 8 to 26 °C).
Long-term manure accumulation should provide favorable temperature conditions for the increase of beetle populations throughout the year. The life cycle (eggs to eggs) of A. diaperinus varies from 52 days
Figure 2. Spatial distribution of larvae and adults of A. diaperinus collections in first, second, third, fourth, fifth and sixth weeks of third flock grow-out in Cascavel Parana State.
76.727 153.454 230.182 306.909 383.636 460.363 537.091 613.818 690.545 767.273 First week
0 19 38 57 76 95 114 133 N S
W
E 155.364
310.727 466.091 621.455 776.818 932.182 1087.545 1242.91 1398.27 1553.635 Feeder line I
Feeder line II Feeder line III
Second week
0 19 38 57 76 95 114 133
119.636 239.273 358.909 478.545 598.182 717.818 837.455 957.091 1076.727 1196.363 Third week
0 19 38 57 76 95 114 133
616.818 1233.635 1850.453 2467.27 3084.09 3700.91 4317.727 4934.543 5551.36 6168.18 Feeder line I
Feeder line II Feeder line III
Fourth week
0 19 38 57 76 95 114 133
542.455 1084.91 1627.363 2169.82 2712.27 3254.727 3797.18 4339.636 4882.09 5424.543 Fifth week
0 19 38 57 76 95 114 133
175.454 350.909 526.364 701.818 877.273 1052.727 1228.18 1403.635 1579.09 1754.545 Feeder line I
Feeder line II Feeder line III
Sixth week
at 28 °C to 31 days at 31 °C (Chernaki and Almeida, 2001 b). Therefore, the temperature of the litter ob-served during this study allows the formation of one to 1/2 insect generations every grow-out (45 to 50 days). Long-term manure accumulation also result in high litter density, mainly in the east side (first 44 meters), providing insects with excellent conditions for survival. In this study the litter temperature was higher in sites with higher litter density (Armitage, 1985; Stafford and Collison, 1987; Salin et al., 2000). Differences between temperatures at different collection points are not related to the number of insects collected. The spatial distribution of A. diaperinus in the poultry house was studied to show heterogeneity in larvae and adult distributions. Only the fifth grow-out showed significant differences between larvae and adults and the three feeder rows.
The spatial distribution of A. diaperinus was not re-lated to the poultry distribution: no significant differenc-es were observed among the three sections of the poultry house. The poultry distribution was not uniform over the poultry house: in the first week they were concentrated in one third of the poultry house (east side), in the second week they were also distributed in the middle third and after the third week, they were distributed all over the poultry house. Strother and Steelman (2001) also found that beetles do not always congregate in the locations predicted by the model and only during the weeks of the last grow-out were the beetles able to aggregate in pre-ferred areas specifically predicted by the model. Poultry houses in Brazil have been monitored because the varia-tion in insect populavaria-tions is highly heterogeneous in one single house.
Acknowledgments — The authors wish to thank the Cooperativa Agropecuária Cascavel Ltda-(Coopavel) for assistance with the insect collection and to the Conselho Nacional de Desenvolvimento Científico e Tecnológico – CNPq. We also thank Dr. James J. Roper for reviewing the text in English.
References
ARMITAGE, DM., 1985. Environment of deep-pit poultry houses: survey of air and manure temperatures in British houses. Br. Poult. Sci., vol. 26 p. 275-280.
CAMPOS, H., 1983. Estatística Experimental não-paramétrica. 4. ed., 349p., ESALQ/USP, Piracicaba.
CHERNAKI, AM. and ALMEIDA, LM., 2001a. Morfologia dos estágios imaturos e do adulto de Alphitobius diaperinus
(Panzer) (Coleoptera: Tenebrionidae). Revta bras. Zool., vol. 18, no. 2, p. 351-363.
CHERNAKI, AM. and ALMEIDA, LM., 2001b. Exigências térmicas, período de desenvolvimento e sobrevivência de imaturos de Alphitobius diaperinus (Panzer) (Coleoptera: Tenebrionidae). Neotropical Entomol., vol. 30, no. 3, p. 365-368.
CLARK, LR., GEIER, PW., HIGHES, RD. and MORRIS, RF., 1967. The ecology of insect populations in theory and pratice. In LAM, WF., PEDIGO, LP. and HINZ, PH. Population dynamics of bean leaf beetles (Coleoptera: Chrysomelidae) in Central Iowa. Environ. Entomol., vol. 30 p. 562-567.
ERICHSEN, LD. and JESPERSEN, JB., 1997. Behaviour and population dynamics of litter beetles in broiler houses. Danish Pest Infestation Laboratory Annual Report, 71. In LAMBKIN, TA. Investigations into the management of darkling beetle. Website: http://www.rirdc.gov.au.
IHAKA, R. and GENTLEMAN, R., 1996. R: a language for data analysis and graphics. Journal of Computational and Graphical Statistics vol. 5 p. 299-314.
JANDEL SCIENTIFIC, 1994, Sigmastat statistical software, user’s manual. San Rafael, California, Jandel Scientific. 831p. PFEIFFER, DG. and AXTELL, RC., 1980. Coleoptera of poultry manure in caged-layer houses in North Carolina. Environ. Entomol., vol. 9 p. 21-28.
SAFRIT, RD. and AXTELL, RC., 1984, Evaluations of sampling methods for darkling beetles (Alphitobius diaperinus) in the litter of turkey and broiler houses. Poultry Sci., vol. 63, p. 2368-2375.
SALIN, C., DELETTRE, YR., CANNAVACCIUOLO, M. and VERNON, P., 2000. Spatial distribution of Alphitobius diaperinus (Panzer) (Coleoptera: Tenebrionidae) in the soil of a poultry house along a breeding cycle. Eur. J. Soil Biol. vol. 36, p. 107-115.
STAFFORD, KC. and COLLISON, CH., 1987. Manure pit temperatures and relative humidity of Pennsylvania high-rise poultry houses and their relationship to arthropod population development. Poultry Sci., vol. 66, p. 1603-1611.
STROTHER, KO. and STEELMAN, DC., 2001, Spatial analysis of Alphitobius diaperinus (Coleoptera: Tenebrionidae) in broiler production facilities. Environ. Entomol., vol. 30, no. 3, p. 556-561.
TURNER, EC., 1986. Structural and litter pests. Poultry Sci., vol. 65, p. 644-648.