Soybean yield in response to application of phosphate rock
associated with triple superphosphate
Adilson de Oliveira Júnior
1*; Luís Ignácio Prochnow
2; Dirceu Klepker
31
Embrapa Soja, Rod. Carlos João Strass, Distrito de Warta, C.P. 231 – 86001-970 – Londrina, PR – Brasil.
2
International Plant Nutrition Institute/IPNI, R. Alfredo Guedes, 1949 – C.P. 400 – 13400-970 – Piracicaba, SP – Brasil.
3
Embrapa Soja – Setor Experimental de Balsas, R. Cohab, 813 – C.P. 131 – 65800-000 – Balsas, MA – Brasil. *Corresponding author <[email protected]>
ABSTRACT: Soybean (Glycine max L. Merrill) crop started to be planted in the Brazilian Cerrado in the 1970’s, and this region currently contributes with 57% of total soybean production in Brazil. Under natural conditions in this region, the soils present chemical limitations such as low pH, low Cation Exchange Capacity, low nutrient availability, and moreover, clayey soils have a high P fixation capacity mainly due to high contents of Fe/Al oxides. Since P is the most limiting nutrient is this region, a study was performed in the state of Maranhão, Brazil, in a Typic Hapludox, with clayey texture and low available P (extracted by resin). Treatments were defined to evaluate soybean response to broadcast Arad phosphate rock (PR) plus banded triple superphosphate (TSP) and to evaluate the soybean response to three proportions of PR and TSP. The experiment was established in October 2004 and was carried out for three consecutive crop years (2004/05 to 2006/07). The associated use of PR and TSP, in several situations, resulted in yields at least similar to that obtained with the use of the water soluble P source and, in some cases, even using lower P rates. Regarding the “mixtures”, a linear response was observed when they were banded; however, when they were broadcasted, no increase in yield was observed above 50% of relative solubility.In conclusion, the association of sources differing in solubility may be a feasible agronomic option for P fertilizer management of soybeans. Key words: Brazil, Glycine max L. Merrill, Oxisols, P source solubility, phosphorus, cerrado soils
Produtividade da soja em resposta à aplicação de fosfato de rocha
associado ao superfosfato triplo
RESUMO: O cultivo de soja (Glycine max L. Merrill) na região do Cerrado iniciou-se na década de 1970 e, atualmente, representa aproximadamente 57% da produção total do Brasil. Sob condições naturais, os solos dessa região apresentam limitações químicas, como baixos valores de pH, de Capacidade de Troca de Cátions, de disponibilidade de nutrientes, bem como elevada capacidade de fixação de P nos solos de textura argilosa, principalmente pelos altos teores de óxidos de Fe/Al. Levando-se em conta que o P é o nutriente mais limitante à produção nessa região, foi instalado um experimento no estado do Maranhão, em Latossolo Vermelho-Amarelo distrófico argiloso e com baixo teor disponível de P (extraído com resina). Objetivou-se verificar a resposta da cultura à aplicação do fosfato de rocha Arad (FR) em área total mais superfosfato triplo (SFT) em aplicação localizada; e verificar a resposta da cultura a três proporções de FR e SFT. O experimento foi instalado em outubro de 2004 e conduzido por três safras consecutivas (2004/05 a 2006/07). A utilização associada de FR e SFT, em várias condições, resultou em produtividades no mínimo semelhantes à obtida com a fonte solúvel e, em alguns casos, até utilizando menores quantidades de P. Quanto às “misturas”, verificou-se resposta linear para a aplicação localizada; entretanto, para a aplicação a lanço, não houve aumento na produtividade a partir de 50% de solubilidade relativa. Logo, a associação de fontes com solubilidades distintas pode ser uma opção agronomicamente viável para o manejo da adubação fosfatada da soja.
Palavras-chave: Brasil, Glycine max L. Merrill, Latossolos,solubilidade de fontes de P, fósforo, solos sob Cerrado
Introduction
Brazil started to be considered an important country in the agricultural scenario after the introduction of soybean (Glycine max L. Merrill) crop. Nowadays, this is the largest food crop in the country, worth nearly US$ 17 billion in 2008. In the 1960’s, the crop was limited to the Southern Region of Brazil, but since then breeders have developed varieties that can grow in most parts of the country. Agricultural sci-entists have tamed the highly acidic soils of the Brazilian Cerrado through applications of lime and other soil
amend-ments. They also have reduced fertilizer costs by developing methods to inoculate Leguminosae seeds with rhizobia, a type of bacteria that colonize the roots of certain plants, such as soybeans, and promote nitrogen fixation (Tollefson, 2010).
These soils have low pH, low Cation Exchange Capacity (CEC), low nutrient content, high P fixation capacity (clayey soils), and high exchangeable Al saturation (Leal and Velloso, 1973). Phosphorus is the main limiting nutrient to crop pro-duction in this region. Lopes and Cox (1977) carried out a soil characterization survey in the Cerrado and observed that 92% of the samples collected presented available P levels (ex-tracted by Mehlich 1) lower than 2 mg dm–3
. Nevertheless, the continuous correct management of soil fertility and the adoption of practices that promote better fertilizer efficiency, such as no-tillage, have been leading to increased P availabil-ity in these areas.
Several mineral and organic P sources are available for ag-ricultural purposes. Worldwide, fully acidulated phosphates (superphosphates and ammoniated phosphates) constitute the main sources of P used for agricultural production (Prochnow et al., 2004a). As an alternative to the use of su-perphosphates, phosphate rocks or an association of both sources can be used to manage P fertilization with sources presenting distinct solubility traits (Chien et al., 2009). The joint utilization of these sources can be either accomplished by applying combinations of phosphate rock and soluble sources (Chien et al., 1987; Franzini et al., 2009a, 2009b;
Nachtigall et al., 1989; Menon et al., 1991; Prochnow et al., 2004b; Villanueva et al., 2006) or by applying them separately but in the same area (associated use).
This study aimed at evaluating soybean yield as a response to the application of P sources in an Oxisol in the Brazilian Cerrado. It was hypothesized that the use of natural rock phosphates might be possible to replace other soluble sources of P traditionally used in soybeans, as well as asso-ciations of P fertilizers with intermediate solubility in water.
Material and Methods
The experiment was established in October 2004 in the southern part of the state of Maranhão (6º46’08" S, 45º45’50" W), in a Typic Hapludox, with a clayey texture (510 g kg–1), available P (resin) level of 2 mg dm–3, and maxi-mum P fixation capacity (Langmuir isotherm) of 0.776 mg g–1
. The area was primarily established in 2000/01 and limed in October 2001 with 8 t ha–1
of limestone (Relative Neu-tralizing Value = 70%). This liming rate was calculated to raise the soil pH in water to approximately 5.5 and the base saturation to 60%. After liming, the area was left fallow un-til the beginning of the experiment.
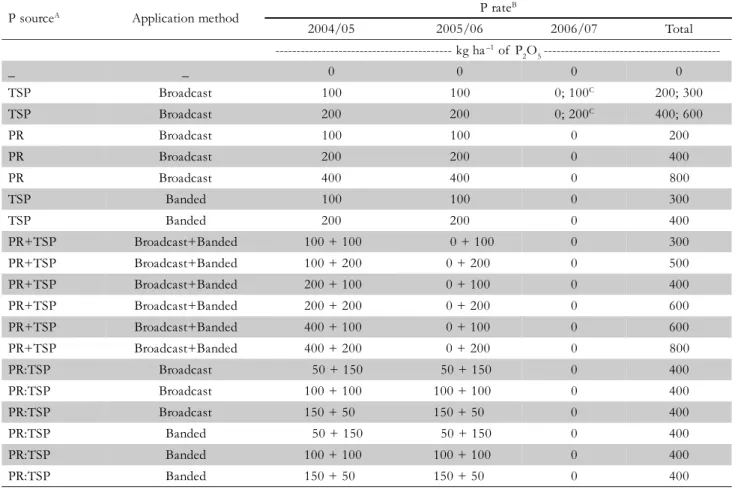
Table 1 – Description of treatments.
ATSP: Triple superphosphate; PR: Arad phosphate rock; PR+TSP: Broadcast PR + banded TSP; PR:TSP: “mixtures” of P sources in three
proportions (3:1, 1:1, and 1:3); BThe rate of TSP applied was calculated based on the NAC+ H
2O soluble P and the rate of PR was
determined from the total P content; CTreatments corresponding to P response curve rates that were applied as broadcast TSP subdividing
the respective plots.
P sourceA Application method P rate
B
2004/05 2005/06 2006/07 Total
--- kg ha–1 of P
2O5
---_ _ 0 0 0 0
TSP Broadcast 100 100 0; 100C 200; 300
TSP Broadcast 200 200 0; 200C 400; 600
PR Broadcast 100 100 0 200
PR Broadcast 200 200 0 400
PR Broadcast 400 400 0 800
TSP Banded 100 100 0 300
TSP Banded 200 200 0 400
PR+TSP Broadcast+Banded 100 + 100 0 + 100 0 300
PR+TSP Broadcast+Banded 100 + 200 0 + 200 0 500
PR+TSP Broadcast+Banded 200 + 100 0 + 100 0 400
PR+TSP Broadcast+Banded 200 + 200 0 + 200 0 600
PR+TSP Broadcast+Banded 400 + 100 0 + 100 0 600
PR+TSP Broadcast+Banded 400 + 200 0 + 200 0 800
PR:TSP Broadcast 50 + 150 50 + 150 0 400
PR:TSP Broadcast 100 + 100 100 + 100 0 400
PR:TSP Broadcast 150 + 50 150 + 50 0 400
PR:TSP Banded 50 + 150 50 + 150 0 400
PR:TSP Banded 100 + 100 100 + 100 0 400
The treatments were defined aiming at assessing the crop response to broadcasted Arad phosphate rock (PR) in asso-ciation with banded triple superphosphate (TSP), a soluble source of P, as well as the crop response to the application of a specific rate of P, either broadcast or banded in the seed row, supplied by three proportions of PR and TSP, from now on called “mixtures” (Table 1). Although the combina-tion of three proporcombina-tions of PR and TSP cannot be consid-ered an actual mixture, since PR was applied in the un-grounded form and TSP was applied as granules, this term is used between quotation marks throughout the text refer-ring to the application of a fixed rate of P supplied by these three proportions of the two sources.
The experiment followed a randomized block design with three replications. Each plot covered an area of 72 m2 (6 m × 12 m) with 15 rows of soybeans planted at 0.40 m row spacing. The useful area of each plot was 12 m2
(2.4 m × 5 m).
The experiment was carried out on three consecutive crop years (2004/05 to 2006/07), cultivating soybeans un-der a conventional system, using BRS Sambaíba variety. The treatments were applied to the first two crops, and the re-sidual effect of the previous applications was evaluated in the 3rd one. Given that it was necessary to apply the nutri-ent within the study year in order to calculate its residual effect (Pimentel-Gomes and Conagin, 1991), P response curve rates were applied again as broadcast TSP subdivid-ing the correspondsubdivid-ing plots. The rate of TSP was calcu-lated based on the extraction of neutral ammonium citrate + water (NAC + H2O) soluble P (41.5% P2O5), while the rate of PR was determined from the total P content (33.3% P2O5).
Rates of potassium, sulfur, and micronutrients used, as well as the seeding dates of each crop are in Table 2. Sulfur and micronutrients were applied only in the first crop year, at rates considered sufficient to maintain adequate availabil-ity for the following crops (Embrapa, 2003).The rainfall dur-ing the three crop years was adequate for soybean develop-ment. The accumulated rainfall between December and June ranged from 800 mm to 1,500 mm, depending on the crop year. Despite the variation in this value, the distribution within each month was uniform, with no occurrence of dry periods, which could cause damage to plant growth. Grain yield was the main variable evaluated through harvesting six 5-meter long rows of soybeans, whereas in the divided plots, three 5-meter long rows were harvested.
All data generated during the first crop year (2004/05) from the broadcast PR treatments in association with banded TSP was evaluated by multiple regression, considering P rates supplied as broadcast PR and banded TSP as independent variables. In addition, through horizontal comparison stud-ies, it was possible to determine the combinations of P rates that resulted in a certain yield level (isolines). The SigmaPlot® version 10 (Systat Software, 2006) and TableCurve 3D®
ver-sion 4.0 (Systat Software, 2002) software products were used. In the 2nd crop year (2005/06), the model was adjusted as in the previous crop, although no broadcast PR applica-tion was performed (Table 1). Nonetheless, the interpreta-tion of the multiple regression equainterpreta-tion must take into ac-count that one independent variable represents PR applica-tion in 2004/05, and the other represents the annual appli-cation of P (2004/05 and 2005/06) as banded TSP.
In the 3rd
crop year (2006/07), under the residual effect of both sources, the model was adjusted again as a func-tion of P rates. In this case, one independent variable repre-sents the PR application carried out in 2004/05, and the other represents TSP application performed in 2004/05 and 2005/ 06.
The three models were adjusted using soybean grain yield as the response variable. In the vertical comparison, isolines corresponding to the maximum technical efficiency values ( ˆYmax) were indicated for the three crop years, and the val-ues corresponding to 90% of the ˆYmax (0.9 ˆYmax) were indicated for the two first ones.
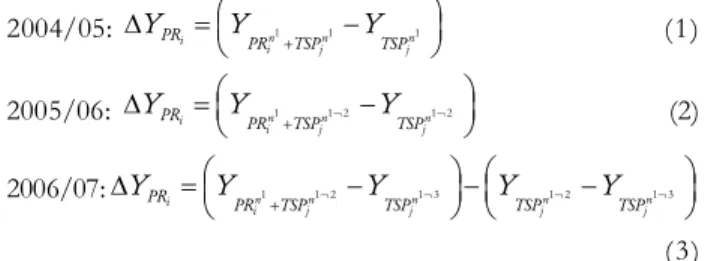
The treatment arrangement enabled calculation of PR contribution in the final yield results in order to obtain the immediate effect of phosphate rock (IEPR) with or without a soluble source in the first crop year (2004/05), as well as PR residual effect (REPR) with a soluble source in the 2nd crop year (2005/06) and without it in the 3rd crop year (2006/07). The generic models used in the calculation of the response variation (Y) due to PR (ΔYPR) are described in equations 1 to 3.
2004/05: i n1 n1 n1
i j j
PR PR TSP TSP
Y ⎛Y + Y ⎞
Δ =⎜ − ⎟
⎝ ⎠ (1)
2005/06: i n1 n1 2 n1 2
i j j
PR PR TSP TSP
Y Y ¬ Y ¬
+
⎛ ⎞
Δ =⎜ − ⎟
⎝ ⎠ (2)
2006/07: i n1 n1 2 n1 3 n1 2 n1 3
i j j j j
PR
PR TSP TSP TSP TSP
Y Y ¬ Y ¬ Y ¬ Y ¬
+
⎛ ⎞ ⎛ ⎞
Δ =⎜ − ⎟ ⎜− − ⎟
⎝ ⎠ ⎝ ⎠
(3)
Crop year Seeding date Nutrient rate
A
K2O S Zn Mn Cu B Mo Co
--- kg ha–1 --- --- g ha–1
---2004/2005 12/12/2004 100 150 5 5 5 2.5 150 15
2005/2006 12/17/2005 80 0 0 0 0 0.0 0 0
2006/2007 12/11/2006 80 0 0 0 0 0.0 0 0
AK
2O: potassium chloride; S: elemental sulfur; Zn, Mn, Cu e Co: sulfate forms; B: boric acid; Mo: sodium molybdate; all the sources were
broadcast.
where: i= P rate: broadcast PR; j = P rate: banded SP; n1
= P source applied in 2004/05; n1¬2
= P source applied in 2004/ 05 and 2005/06; n1¬3 = P source applied in 2004/05, 2005/ 06, and 2006/07.
The ΔYPR values in the 3rd
crop year (2006/07) (Eq. 3) were calculated in two steps. In the first step, the annual broadcast TSP application (obtained from the subdivision of the corre-sponding plots) served as a reference, making it possible to obtain the yield variation as a function of broadcast PR and banded TSP applications (ΔYPR+TSP). The 2nd step was per-formed using banded TSP applications in the first (2004/05) and 2nd (2005/06) crop years as a reference. Therefore, it was possible to isolate the contribution of PR in the 3rd
crop year (2006/07) even under the residual effect of banded TSP.
Using ΔYPR data, it was possible to calculate PR contri-bution as percentages, as follows:
PR
PR PR
ΔY
IE (%) or RE (%) 100 Y
⎛ ⎞
=⎜ ⎟×
⎝ ⎠ (4)
where: IEPR or REPR = contribution of PR expressed as a percentage of the final Y value; ΔYPR = variation in the Y variable due to PR; Y = dependent or response variable value obtained in a given treatment
All data regarding the immediate and residual effects of PR in the 2nd crop year (2005/06) were related to their corre-sponding rates through multiple regression models, allow-ing interpolations within the applied P (both PR and TSP) interval. The isolines for the corresponding adjustments were also calculated (horizontal comparison). These multiple re-gression models were not adjusted for the 3rd crop year. Ad-ditionally, the average soybean yields obtained in each of the three crop years were compared by a multiple comparison test as a function of the treatments.
The results obtained for the “mixtures” were analyzed by orthogonal contrasts, comparing groups of sources (higher
vs. lower solubility) and application forms (broadcast vs. banded), as well as using simple linear regression models, in which soybean yields in each crop year were correlated with the average of the three crop years as a function of source/ ”mixture” relative solubility (RS).
The fertilizer application in different proportions while maintaining the rate of P2O5 at 200 kg ha–1 resulted in five levels of RS, corresponding to the percentages of the water-soluble sources total content, which were used in the regres-sion analyses as independent model variables.
The significance of the equation estimation parameters was evaluated for all the adjusted regression models taking into consideration the 1%, 5%, 10%, and non-significant probabilities, represented by **, *, ° and ns, respectively.
Results and Discussion
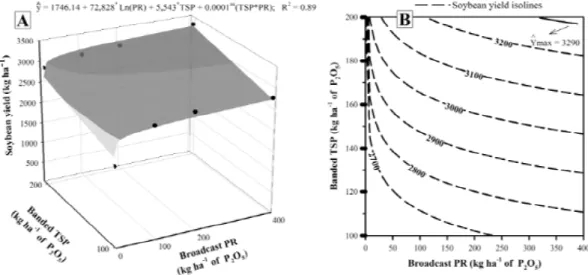
Both independent variables had a positive influence on crop response (Figure 1). However, the single application of each source resulted in yields lower than 2,500 kg ha–1
, while several source combinations resulted in yields higher than 3,000 kg ha–1. Therefore, it is possible to reach high yields through adequate management of P sources. Since no eco-nomic analyses were performed, an isoline was drawn for the value of 2820 kg ha–1
, which corresponds to 90% of the maximum yield (3130 kg ha–1). Based on these yield values, it was possible to mathematically single out the contribu-tion of PR in the final yield value (IEPR) when applied sepa-rately or in association with TSP. PR contribution decreased exponentially with increased participation of the highly soluble source, regardless of the rate applied (Figure 2). Nev-ertheless, when the highest banded P rate (200 kg ha–1
) was used, PR applied at the rates of 100, 200, and 400 kg ha–1
of P2O5 resulted yield increases of 12%, 22%, and 17%, respec-tively. IEPR remained stable at rates above 150-200 kg ha–1 of
P2O5, regardless of the amount of TSP applied (Figure 2b). These results indicate that PR dissolution reactions reached maximum values at rates close to 200 kg ha–1 of P2O5. There-fore, if immediate effects are expected, the use of P rates higher than this value is not a viable option.
In the 2nd crop year (2005/06), soybean response was evaluated as a function of banded TSP annual application and the residual effects of PR application in the previous year (Figure 3). Isolated TSP application resulted in yields rang-ing from 2,000to 2,700 kg ha–1. However, higher yields (> 3,000 kg ha–1) were only reached when considering the con-tribution of PR applied in the previous year (Figure 3B), which highlights the positive interaction between sources.
Another probable explanation for this interaction is the ini-tial effect caused by the water-soluble P that would lead to higher plant uptake of P from PR due to better root system development (Chien et al., 1987).
The maximum yield estimated by the model function was 3,203 kg ha–1. This value was obtained using P rates (broad-cast PR) between 320 and 330 kg ha–1 of P2O5 and annual ap-plication of 158 to 165 kg ha–1
of P2O5 (banded TSP). The isolines corresponding to 90% of the maximum yield (0.9
ˆ
Ymax) had a value of approximately 2880 kg ha–1. The mini-mum P rate, applied as banded TSP, to reach this value was 100 kg ha–1 of P2O5 when associated to the residual effect of the application of 350 kg ha–1
of P2O5 (broadcast PR) (Figure 3b).
Figure 2 – Immediate effect of phosphate rock (IEPR) estimate based on soybean yield in the first crop year (2004/05), as a function of broadcast PR and banded TSP applications at the same crop year (A), and the corresponding isolines for the adjusted regression model (B).
Figure 3 – Soybean yield in the 2nd crop year (2005/06) as a function of broadcast PR applied in the first crop year (2004/05) and banded
TSP applied in the first (2004/05) and 2nd (2005/06) crop years (A), and the corresponding isolines for the adjusted regression
PR residual effect (REPR) in the 2nd
crop year (2005/06) was calculated considering the annual application of 100 and 200 kg ha–1 of P2O5 as TSP (Figure 4). This procedure was adopted because the initial experiment design did not include treatments referring to PR applied only in the first year and without TSP application (100 + 0, 200 + 0, and 400 + 0).
A decrease in REPR was registered for banded P rates (TSP). As TSP rates increased, reductions of 23%, 21%, and 24% in REPR were detected at the rates of 100, 200, and 400 kg ha–1 of P2O5 (broadcast PR), respectively. In contrast with what was noticed for IEPR regarding the residual effect, no plateau was observed for P rates applied as PR (Figure 4a). Therefore, using rates above 200 kg ha–1
of P2O5 as broad-cast PR in the first crop year (2004/05) resulted higher REPR in the following crop (Figure 4b). PR application presented an excellent residual effect, especially when associated to the lowest banded P rate. For example, the residual effect of broadcast PR at the rate of 400 kg ha–1 of P2O5 associated to the annual application of banded TSP at the rate of 100 kg ha–1
of P2O5 made a contribution of 35-40% to the final yield value (2839 kg ha–1) (Figure 3a), representing approximately 1,100 kg ha–1 of soybeans produced as a result of PR re-sidual effect.
In the 3rd crop year (2006/07), soybean yield was evalu-ated as a function of the residual effect of broadcast PR applied in the first crop year (2004/2005) and banded TSP applied in the first (2004/05) and 2nd (2005/06) crop years (Figure 5). The maximum yield (3,290 kg ha–1
) resulted from the highest P rates, regardless of the source used (Fig-ure 5b). Several combinations of PR and TSP produced yields higher than 3,000 kg ha–1. The extreme combinations were 0 + 200 and 400 + 150, meaning that the minimum annual input of soluble P sources to obtain yields of at least 3,000 kg ha–1 in the 3rd crop year (2006/07) based on their residual effect was 150 kg ha–1
of P2O5, regardless the PR application.
Figure 4 – Phosphate rock residual effect (REPR) estimate based on soybean yield in the 2nd crop year (2005/06) as a function of broadcast
PR applied in the first crop year (2004/05) and banded TSP applied in the first (2004/05) and 2nd (2005/06) crop years (A),
and the corresponding isolines for the adjusted regression model (B).
The REPR values for the 3rd
crop year (2006/2007) (Table 3) ranged from 5% to 13% when banded TSP was applied at the rate of 200 kg ha–1 of P2O5 in the first (2004/05) and 3rd crop years (2006/07), and from 28% to 31% when the soluble source was used at the rate of 100 kg ha–1
of P2O5. Even under the residual effect of TSP application, the base yields for REPR calculation were not very low (around 1,900 kg ha–1
at the rate of 100 kg ha–1
of P2O5 and approximately 2,900 kg ha–1
at the rate of 200 kg ha–1
of P2O5), providing evidence that the residual effect of PR applied two crop years before is expressive and consistent, especially when associ-ated to the lowest rate of banded P.
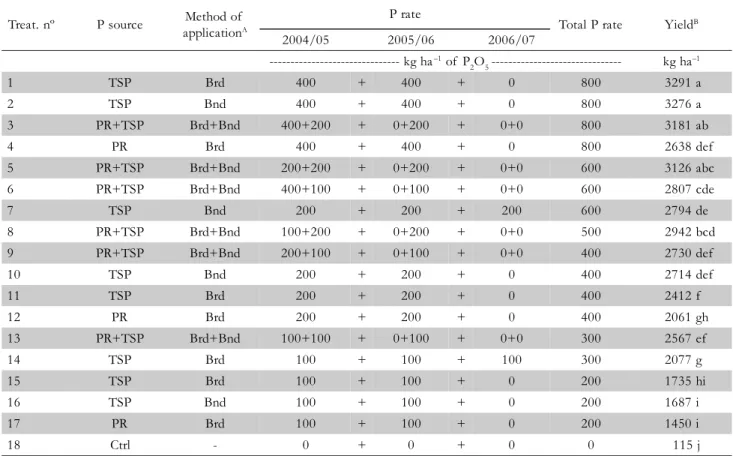
Considering the average yields for the three crop years (Table 4), the joint application of both sources presented no statistically significant difference (Tukey at 5%) in relation to the application of TSP alone (both broadcast and banded) at the rate of 800 kg ha–1
of P2O5 (treatments 1, 2, and 3). The intermediate (400 and 600 kg ha–1 of P2O5) and lower (300 kg ha–1 of P2O5) rates of P presented similar or higher responses for the joint application compared to the individual applica-tions of each source. For instance, the annual broadcast TSP application at the rate of 100 kg ha–1 of P2O5 (treatment 14) resulted in an average yield of 2,077 kg ha–1, lower than the yield (2,567 kg ha–1) obtained in treatment 13 with the appli-cation of 100 kg ha–1
of P2O5 (broadcast PR in the first crop year – 2004/05) in association with the annual application of 100 kg ha–1 of P2O5 (banded TSP in the first – 2004/05 and 2nd
crop years – 2005/06). These results indicate that the asso-ciation of sources can be an agronomically feasible practice, al-though further studies are necessary. Similar results were ob-tained by Franzini et al. (2009a), who reported that the rela-tive agronomic effecrela-tiveness of Gafsa PR associated to TSP (1:1) was as good as that obtained with the use of TSP for soybean dry matter yield under controlled conditions.
In the 1st (2004/05) and in the 2nd
re-P rateA
Soybean yield (Y) ∆YPR+TSP ∆YPR REPR
2004/05 2005/06 2006/07
PR TSP PR TSP PR TSP
--- kg ha–1 of P
2O5 --- --- kg ha
–1 --- %
0 100 0 100 0 100B 2497 0 -
-0 200 0 200 0 200B 3271 0 -
-0 100 0 100 0 0 1934 - 563 0 0
0 200 0 200 0 0 2900 - 370 0 0
100 100 0 100 0 0 2678 181 744 28
100 200 0 200 0 0 3063 - 208 163 5
200 100 0 100 0 0 2813 316 878 31
200 200 0 200 0 0 3120 - 150 220 7
400 100 0 100 0 0 2776 279 842 30
400 200 0 200 0 0 3345 74 445 13
Table 3 – Phosphate rock residual effect (REPR) estimate based on soybean yield in the 3rd crop year (2006/07) in response to broadcast PR applied in the first crop year (2004/2005) and banded TSP applied in the first (2004/05) and 2nd (2005/ 06) crop years.
ABroadcast PR and banded TSP; BBroadcast TSP (subdivided plots).
Table 4 – Soybean yield as a function of total P rates and P sources applied during three crop years.
ABrd: broadcast application; Bnd: banded application; Brd+Bnd: broadcast PR + banded TSP applications; BAverage of three crop years.
Values followed by the same letter are not different (p < 0.05). Coefficient of variation = 4.28%; MSD(Tukey 5%) = 327 kg ha–1.
Treat. nº P source Method of applicationA
P rate
Total P rate YieldB
2004/05 2005/06 2006/07
--- kg ha–1 of P
2O5 --- kg ha –1
1 TSP Brd 400 + 400 + 0 800 3291 a
2 TSP Bnd 400 + 400 + 0 800 3276 a
3 PR+TSP Brd+Bnd 400+200 + 0+200 + 0+0 800 3181 ab
4 PR Brd 400 + 400 + 0 800 2638 def
5 PR+TSP Brd+Bnd 200+200 + 0+200 + 0+0 600 3126 abc
6 PR+TSP Brd+Bnd 400+100 + 0+100 + 0+0 600 2807 cde
7 TSP Bnd 200 + 200 + 200 600 2794 de
8 PR+TSP Brd+Bnd 100+200 + 0+200 + 0+0 500 2942 bcd
9 PR+TSP Brd+Bnd 200+100 + 0+100 + 0+0 400 2730 def
10 TSP Bnd 200 + 200 + 0 400 2714 def
11 TSP Brd 200 + 200 + 0 400 2412 f
12 PR Brd 200 + 200 + 0 400 2061 gh
13 PR+TSP Brd+Bnd 100+100 + 0+100 + 0+0 300 2567 ef
14 TSP Brd 100 + 100 + 100 300 2077 g
15 TSP Brd 100 + 100 + 0 200 1735 hi
16 TSP Bnd 100 + 100 + 0 200 1687 i
17 PR Brd 100 + 100 + 0 200 1450 i
18 Ctrl - 0 + 0 + 0 0 115 j
sponse to their solubility was linear (Figure 6). This direct relationship was probably a consequence of both the prefer-ential use of the soluble fraction by plants (lower loss due to fertilizer location) and mainly the lower agronomic
a plateau trend was observed as a function of solubility, with no increase in yield above approximately 50% RS in the first (2004/05) and 2nd (2005/06) crop years (Figure 6). In this case, the higher dissolution of the water-insoluble fraction of the “mixture” contributed to increase the yield and, con-sequently, to reach a plateau. Similarly, Motomiya et al. (2004) reported a linear increase in soybean yield with increasing pro-portions of TSP in a “mixture” with Gafsa PR applied in the furrow. When either the separate sources or the “mix-tures” were broadcasted, Motomiya et al. (2004) did not ob-serve differences between the application of the “mixtures” and the isolated application of TSP. These results support the need of soil contact for better drainage of the water-in-soluble fraction dissolution products (Rajan et al., 1996), lead-ing to higher agronomic efficiency of the “mixtures” when used under these conditions.
In the 3rd
crop year (2006/07), under the residual effect of previous P source applications (Figure 6c), the
relation-Figure 5 – Soybean yield in the 3rd crop year (2006/07) as a function of broadcast PR applied in the first crop year (2004/05) and banded
TSP applied in the first (2004/05) and 2nd (2005/06) crop years (A), and the corresponding isolines for the adjusted regression
model (B).
ship between yield and solubility was linear for banded ap-plication, despite the low coefficient of determination of the model applied (higher response variation under the residual effect). The broadcast application, though, resulted in a qua-dratic response, a trend caused by the yield decrease when TSP was applied separately. The use of the sources/“mix-tures”, regardless of the form of application, resulted in yields of approximately 2,500 kg ha–1
, close to the Brazilian average yield in this same crop year (2,823 kg ha–1
) (CONAB, 2007). This indicates that the application of these sources/ “mixtures” can result, in the long term, in economically ac-ceptable yields, especially because no P was applied in the last crop year.
Although the response to solubility was linear when the sources/“mixtures” were banded, the slope of the adjusted functions for the three crop years (Figure 6) decreased from 22.44 in the first (2004/05), to 15.92 in the 2nd
(2005/06), and finally to 7.02 in the 3rd (2006/07) crop years. This
indi-Table 5 – Orthogonal contrasts of soybean yield, during three crop years, comparing P source groups presenting low relative solubility (LRS) and high relative solubility (HRS) and comparing broadcast and banded application forms.
A
1
X : average soybean yield obtained with the application of P source groups presenting low relative solubility (200+0 and 150+50 kg ha–1 of
P2O5 – PR + TSP) or average soybean yield obtained with broadcast application of P sources/“mixtures”; B 2
X : average soybean yield obtained with the application of P source groups presenting high relative solubility (100+100; 50+150, and 0+200 kg ha–1 of P
2O5 – PR
+ TSP) or average of soybean yield obtained with banded application of P sources/“mixtures”; Cns, **, *: non-significant, and significant at
1% and 5%, respectively. Contrast
Soybean yield
2004/05 2005/06 2006/07
A B FC F F
--- kg ha–1
---(LRS) vs (HRS) for Broadcasted 2069 2283 3.8* 2353 2662 34.9** 2544 2587 3.9ns
(LRS) vs (HRS) for Banded 1047 2266 123.6** 1673 2500 250.2** 2349 2799 15.2** (Broadcasted) vs (Banded) 1534 2154 66.6** 2004 2477 170.4** 2529 2561 1.8ns
Coefficient of variation (%) 10.53 4.51 8.76
1
AExtreme values of solubility (1% and 90%) correspond to the respective
uses of PR and TSP alone; P rate: 200 kg ha–1 of P 2O5.
Figure 6 –Relationship between soybean yield, in the first (2004/ 05) (A), 2nd (2005/06) (B) and 3rd (2006/07) crop
years (C), and the relative solubility of P sources/ “mixtures”.
AExtreme values of solubility (1% and 90%) correspond to the respective
uses of PR and TSP alone; P rate: 200 kg ha–1 of P 2O5.
Figure 7 – Average soybean yield, during three crop years, in response to the relative solubility of P sources/ “mixtures”.
cates that, as time passes by, the water-insoluble fraction of the “mixtures” and PR contributes more effectively to the final yield results (increase in the intercept values of the equa-tions) due to much more representative soil-fertilizer con-tact. Sousa and Lobato (2003) emphasized the importance of the contact between soil and PR to increase the relative agronomic effectiveness of this source of P, as time goes by, in banded applications.
Regarding the average of the three crop years (Figure 7), the crop clearly presented a linear response to solubility when
the sources/“mixtures” were banded and a quadratic re-sponse when they were broadcasted, with the maximum point of the equation at 60% of RS.
When the sources/“mixtures” with higher RS (TSP:PR – 200:0 and 150:50) were compared to those with lower RS (100:100, 150:50, and 0:200) by orthogonal contrasts (Table 5), it was evident that, within the period of P application, the responses of sources/“mixtures” with higher RS were higher (p≤ 0.05) than those shown by those with lower RS, regardless of the form of application. Nevertheless, under the residual effect, this difference was observed only for the banded application, corroborating once more the importance of soil contact as well as time (number of crops) for higher water-insoluble fraction dissolution.
Comparing application forms based on the average value of sources/“mixtures” (Table 5), we observed differences between the first two crops, broadcast application resulting higher yields (Figure 6a and 6b). However, in the 3rd crop year (2006/07), this difference was not observed, since the banded application of the “mixtures” with lower RS resulted in better responses compared to the two previous crops (Fig-ure 6c).
The fact that no RS “critical level” was obtained when the sources were banded is likely to be related to the applica-tion of TSP in a granular form, which would result in a higher crop recovery efficiency of P applied, and, addition-ally, PR presented lower efficiency when banded. Conse-quently, both factors would contribute to a linear response as a function of RS.
Conclusions
planning for soybean crop. Applying P sources as “mixtures” also seems to be agronomically feasible. In case of broad-cast application, the point at which water solubility does not directly influence soybean yield was estimated in 60% con-sidering the average of three crops.
References
Chien, S.H.; Adams, F.; Khasawneh, F.E.; Henao, J. 1987. Effects of combinations of triple superphosphate and a reactive phosphate rock on yield and phosphorus uptake by corn. Soil Science of American Journal 51: 1656-1658.
Chien, S.H.; Menon, R.G. 1995a. Agronomic evaluation of modified phosphate rock products. IFDC’s experience. Fertilizer Research 41: 197-209.
Chien, S.H.; Menon, R.G. 1995b. Factors affecting the ag ronomic effectiveness of phosphate rock for direct application. Fertilizer Research 41: 227-234.
Chien, S.H.; Prochnow, L.I.; Cantarella, H. 2009. Recent developments of fertilizer production and use to improve nutrient efficiency and minimize environmental impacts. Advances in Agronomy 102: 267-322.
Companhia Nacional de Abastecimento [CONAB]. 2007. Brazilian crop production follow-up; Grains 2006/2007 season; twelfth survey, September 2007. Available at: http://www.conab.gov.br/ c o n ab we b / d o wn l o ad / saf ra/ 12_ l e van t ame n t o _ se t 2007.p d f . [Accessed Oct. 23, 2007]. (in Portuguese).
Empresa Brasileira de Pesquisa Agropecuária [Embrapa]. 2003. Soybean production technology: Central Region of Brazil, 2004. Embrapa Soja/EPAMIG: Fundação Triângulo, Londrina, PR, Brazil. (Sistemas de Produção, 4). (in Portuguese).
Franzini, V.I.; Muraoka, T.; Coraspe-León, H.M.; Mendes, F.L. 2009a. Efficiency of reactive phosphate rock applied in mixtures with triple superphosphate in maize and soybean. Pesquisa Agropecuária Brasileira 44: 1092-1099. (in Portuguese, with abstract in English). Franzini, V.I.; Muraoka, T.; Mendes, F.L. 2009b. Ratio and rate effects of 32P-triple superphosphate and phosphate rock mixtures on corn growth. Scientia Agricola 66: 71-76.
Khasawneh; F.E.; Doll, E.C. 1978. The use of phosphate rock for direct application to soils. Advances in Agronomy 30: 159-207. Leal, J.R.; Velloso, A.C.X. 1973. Phosphorus adsorption in Oxisols
from Brazilian Savannas. Pesquisa Agropecuária Brasileira 8: 81-88. (in Portuguese, with abstract in English).
Lopes, A.S.; Cox, F.R. 1977. A survey of the fertility status of surface soils under “Cerrado” vegetation in Brazil. Soil Science Society of American Journal 41: 742-747.
Menon, R.G.; Chien, S.H.; Gadalla, A N. 1991. Phosphate rock compacted with superphosphates vs. partially acidulated rocks for bean and rice. Soil Science Society of America Journal 55: 1480-1484. Motomiya, W.R; Fabrício, A.C.; Marchetti, M.E.; Gonçalves, M.C.;
Robaina, A.D.; Novelino, J.O. 2004. Phosphate application methods fo r so ybe an under no -til lag e sy ste m. P esquisa Agrope cuária Brasileira 39: 307-312. (in Portuguese, with abstract in English). Nachtigall, G.R.; Brauner, J.L.; Zolezzi, M.; Tapia, F. 1989. Blend of
triple superphosphate with phosphate of Jacupiranga in the same granule about the efficiency of the natural phosphate. Revista Brasileira de Ciência do Solo 13: 269-273. (in Portuguese, with abstract in English).
Pimentel-Gomes, F.; Conagin, A. 1991. Fertilization experiments: planning and statistics analysis. p. 103-188. In: Oliveira, A.J.; Garrido, W.E; Araujo, J.D.; Lourenço, S., eds. Methods to research soil fertility. Embrapa, Brasília, DF, Brazil. (in Portuguese).
Prochnow, L.I.; Alcarde, J.C.; Chien, S.H. 2004a. Agronomic efficiency of totally acidulated phosphates. p. 605-663. In: Yamada, T.; Abdalla, S.R.S., eds. Phosphorus in Brazilian agriculture. Associação Brasileira para Pesquisa da Potassa e do Fosfato, Piracicaba, SP, Brazil. (in Portuguese).
Prochnow, L.I.; Chien, S.H.; Carmona, G.; Henao, J. 2004b. Greenhouse evaluation of phosphorus sources produced from a low-reactive Brazilian phosphate rock. Agronomy Journal 96: 761-768. Rajan, S.S.S.; Watkinson, H.; Sinclair, A.G. 1996. Phosphate rocks for
direct application to soils. Advances in Agronomy 57: 77-159. Sousa, D.M.G.; Lobato, E. 2003. Phosphorus fertilization in the Brazilian
Ce rrado Reg ion. In formaç ões Ag ron ômi cas 102: 1-16. ( in Portuguese).
Systat Software. 2006. Sigmaplot for Windows: version 10. Available at: http://www.systat.com/products/sigmaplot/. [Accessed Oct. 22, 2007].
Systat Software. 2002. TableCurve 3D: version 4. Available at: http:// www.systat.com/products/TableCurve3D/. [Accessed Oct. 22, 2007].
Tollefson, J. 2010. The global farm. Nature 466: 554-556. Available at: http://www.nature.com/news/2010/100728/pdf/466554a.pdf. [Accessed Aug. 4, 2010].
Villanueva, F.C.A.; Muraoka, T.; Trevizam, A.R.; Franzini, V.I.; Rocha, A.P. 2006. Improving phosphorus availability from Patos phosphate rock for Eucalyptus: a study with 32P radiotracer. Scientia Agricola 63: 65-69.