Response mode, compatibility, and dual-processes in the evaluation
of simple gambles: An eye-tracking investigation
Enrico Rubaltelli
∗Stephan Dickert
†Paul Slovic
‡Abstract
We employed simple gambles to investigate information processing in relation to the compatibility effect. Subjects should be more likely to engage in a deliberative thinking strategy when completing a pricing task rather than a rating task. We used eye-tracking methodology to measure information acquisition and processing in order to test the above hypothesis as well as to show that losses and alternatives with uncertain outcomes are more likely than gains and alternatives with sure outcomes to be processed through a deliberative thinking process. Results showed that pupil dilations, fixation duration and number of fixations increased when subjects evaluated the gambles with a pricing task. Additionally, the number of fixations increased as the gamble outcome became increasingly negative and when the outcome was uncertain (vs. sure). Fixations were also predictive of subjects’ final evaluations of the gambles. We discuss our results in light of the cognitive processes underlying different response modes in economic preferences. Keywords: compatibility effect, dual-process theory, gambles, risk, loss aversion, uncertainty.
1
Introduction
Both psychologists and economists have traditionally been interested in understanding how people make de-cisions under uncertainty and how they deal with eco-nomic risks. However, whereas the latter have con-ventionally been more concerned with delineating the conditions under which decisions follow rational norms and expectations (Von Neumann & Morgenstern, 1947), psychologists have focused on analyzing the cognitive processes underlying decisions and preferences (Simon, 1976, 1978). An early laboratory study showed that peo-ple pay more selective attention to probabilities or pay-offs depending on the response mode of the presented task (e.g., choice versus judgment; Slovic & Lichtenstein, 1968). For instance, when asked to specify a price to sell a simple gamble offering a probabilitypto win an amount x, individuals are more likely to base their judgment on the gamble payoff (x). However, when people are asked to make a choice between two or more gambles they are more likely to base the decision on the probability (p) of obtaining a positive outcome.
Subsequent research by Lichtenstein and Slovic (1971, 1973) demonstrated, both in the laboratory and in a Las
Enrico Rubaltelli and Stephan Dickert contributed equally to the present paper. We would like to thank Andreas Glöckner for his support and help with the present research project and Susann Fiedler for help with data preparation.
∗University of Padova, Department of Developmental and
Social-ization Psychology, Via Venezia, 8–35131 Padova, Italy. Email: [email protected].
†Max Planck Institute for Research on Collective Goods. ‡Decision Research & University of Oregon.
Vegas casino, that with a particular set of paired gambles it is possible to reverse people’s preferences simply by asking them to choose among gambles or to set a price for each of them. Each pair of gambles included one gamble that offered a large payoff but with low probability (la-beled $-bet) and another gamble that offered a small pay-off but with high probability (labeled P-bet). In this way it was possible to assess which dimension was more influ-ential in each task and to determine whether their effects on people’s preferences were big enough to induce pref-erence reversals. Consistent with the above reasoning, re-sults showed that , many people chose the P-bet because it offered the highest chance to win, but then placed a higher selling price on the $-bet ,which offered the possi-bility of winning a larger amount of money. Research on preference reversals suggests that this phenomenon is mainly induced by an overpricing of the $-bet in the pricing condition when this gamble offers a larger payoff compared with the P-bet (Tversky, Slovic, & Kahneman, 1990). This result has been replicated many times (Lind-man, 1971; Grether & Plott, 1979; Hamm, 1979; Gold-stein & Einhorn, 1987; Karni & Safra, 1987; Schkade & Johnson, 1989; Tversky, Slovic, & Kahneman, 1990; Chapman & Johnson, 1995), no doubt because it offers a particular challenge for economic theories of choice which assume stable preferences.
Several explanations have been suggested to account for preference reversals like these (Seidl, 2002), of which the compatibility effect is probably the most prominent (Tversky, Sattath, & Slovic, 1988). Compatibility effects between task and response have been shown in several
research domains in cognitive psychology (e.g., Simon effect; see Simon, 1990). Tversky, Sattath and Slovic (1988) suggested a similar explanation to account for the different degree of attention given to specific attributes depending on the method used to elicit preferences. In particular, these authors postulated that, when attributes are compatible with the response scale, they are assigned greater weight because they are most easily mapped onto the response. For instance, when subjects are asked to set a price for a gamble this task is compatible with the infor-mation about the gamble payoff, which is also expressed in monetary values (e.g., dollars). Conversely, when the task requires a choice the payoff information is not eas-ily mapped onto the response anymore and loses some of its salience. In fact, Slovic, Griffin, and Tversky (1990) could show that using non-monetary outcomes attenuates preference reversals when no compatibility between the pricing task and the outcome attribute was possible.
An assumption of the compatibility effect is that re-sponse modes compatible with specific characteristics of the options (e.g., payoffs) draw attention to them. At-tentional deployment to these characteristics, in turn, in-creases the weight given to them in the construction of preferences (Willemsen, Böckenholt, & Johnson, 2011). Research on attentional processes underlying choices and preference reversals supports the role of attention in the compatibility effect (Schkade & Johnson, 1989). Us-ing the Mouselab computer-based process-tracUs-ing sys-tem, Schkade and Johnson were able to force subjects to view components of each gamble sequentially one at a time. Results showed that the percentage of time spent looking at payoffs was significantly greater in a pricing task than in a rating task, therefore supporting the hypoth-esis that people attend to information differently depend-ing on the answer they are required to provide. The pro-cess tracing methodology used by Schkade and Johnson allowed them to considerably improve the understanding of the processes behind the compatibility effect. Ratings of attractiveness required less time than the generation of a price. Additionally, in the pricing task, the information search pattern was significantly more dimensional than in the ratings task (transitions between two outcomes or two probabilities within the same gamble as opposed to transitions between a payoff and its probability). Finally, there were differences in how people generated their an-swers in the two tasks. When generating a price, subjects spent one third of the time adjusting their evaluation on the response scale, whereas in the rating task they spent the same amount of time to generate the response but ad-justed the position of the pointer on the scale less often.
Based on this seminal work and the recent application of physiological measures to the study of thinking and decision-making, we aimed to extend the understanding of the compatibility effect by measuring people’s
infor-mation processing by way of an eye-tracking methodol-ogy (Just & Carpenter, 1980). Several complementary methodologies to study information processing from a physiological perspective have recently proven useful to investigate how people make decisions, including event related potentials (ERPs; e.g., Polezzi et al., 2008), and fMRI (e.g., Knutson, Rick, Wimmer, Prelec, & Loewen-stein, 2007; Sanfey, Rilling, Aronson, Nystrom, & Co-hen, 2003). Physiological measures have also been ap-plied to investigate intuitive and deliberative thinking sys-tems. For instance, using skin conductance responses (SCRs), it was shown that intuitive processes can be faster than deliberative (i.e., conscious) processes in deci-sions based on experience (Bechara, Damasio, Tranel & Damasio, 1997). Furthermore, Horstmann, Ahlgrimm & Glöckner (2009) used eye-tracking methodology to ana-lyze people’s information processing when instructed to decide deliberatively or intuitively. Although their find-ings illustrated that instructing decision modes may not result in qualitatively different information processing, deciding deliberatively was related to a higher number of fixations, a more complete information search, and more repeated information inspections.
In the current paper we assess physiological and at-tentional eye-tracking measures that allow for a natural acquisition of information (e.g., natural eye-movements, fixations, and pupil dilations; Glöckner & Herbold, 2011; Horstmann et al., 2009; Velichovsky, 1999) while ex-tending Schkade and Johnson’s (1989) results on the in-formation processing underlying the compatibility effect. Specifically, our goal is to show that (1) compatibility ef-fects are also present when using simple gambles in both gain frame and loss frame, and (2) we intended to draw a connection between the compatibility effect and dual process theories (see Epstein, 1994; Chen & Chaiken, 1999; Evans, 2008). We hypothesized that the different processes activated by task compatible characteristics of an alternative could exert their effect by leading decision makers to rely on either more deliberative or more au-tomatic thinking strategies. In particular, setting a price seems to entail more fine-tuned adjustments once an ini-tial evaluation is established. This dynamic of adjust-ments could hint at a deliberative type of processing ac-tivated by the search for the most advantageous balance between costs (the price paid) and benefits (the amount of the possible gain). By deliberative processing we mean a strategy characterized by a conscious and detailed eval-uation of the pros and cons of a specific gamble.1 In
contrast, a holistic strategy is based on a more general, less detailed and less conscious evaluation of the gam-ble. Therefore, we test the hypothesis that the pricing task requires more deliberative information processing
1Note that conscious evaluations might include both analytical and
with a conscious process of comparison between differ-ent pieces of information. This reasoning is consistdiffer-ent with the fact that ratings of attractiveness are also used as a measure of affective reactions (Bateman, Dent, Peters, Slovic & Starmer, 2007) and should be more influenced by an intuitive thinking strategy. Specifying a price, on the other hand, should be mainly based on the conscious effort of setting the correct price. Thus, we expect that people exert more cognitive effort and deliberation when they are asked to set a price rather than to rate a gamble’s attractiveness. As a measure of cognitive effort we will use the overall eye fixation count, that is how many times subjects look at information about a gamble’s outcomes or their associated probabilities.
Hypothesis 1a: Subjects should exert more cognitive effort (in terms of eye fixation count) when providing a price than when providing ratings of attractiveness, since the pricing task should activate a more deliberative think-ing strategy than the ratthink-ing task.
Hypothesis 1b: Subjects should give the payoff in-formation more weight than the respective probabilities when providing a price than when providing ratings of at-tractiveness. In other words, subjects should fixate prices more often than the respective probabilities when provid-ing a price than when providprovid-ing ratprovid-ings of attractiveness. We also expect to find a set of additional results based on the type of alternatives (simple gambles) that we em-ploy in our study. For instance, subjects should exert more cognitive effort when the amount to be lost in-creases in comparison to an increase in the amount to be won. This is consistent with research on the effects of gain vs. loss framing on cognitive processes, which has demonstrated that people exhibit more thorough evalu-ations and more effortful cognitive analysis when faced with potential losses (Ditto et al., 1998; Dunegan, 1993; Fischer, Jonas, Frey, & Kastenmüller, 2007; Lopes, 1987). Additionally, research on loss aversion shows that losses loom larger than gains (prospect theory; Kahne-man & Tversky, 1979) and typically carry more weight in decisions. Subjects should be more careful in judging a loss than a gain, whose relevance is psychologically less intense. This hypothesis is also consistent with previous literature describing a negativity bias (Baumeister, Brat-slavsky, Finkenauer, & Vohs, 2001; Rozin & Royzman, 2001). Baumeister et al. concluded that it is adaptive for individuals to mobilize their attention and resources toward negative information. We believe that losses in-duce people to anticipate stronger affective reactions than gains, therefore causing them to pay more attention and to evaluate them more carefully. This is in line with pre-vious work demonstrating that emotions can drive atten-tional processes (see Öhman, Flykt & Esteves, 2001; An-derson, 2005; Vuilleumier, 2005).
Hypothesis 2: Subjects should exert more cognitive
ef-fort (in terms of eye fixation count) as the outcome be-comes increasingly negative.
In addition to different cognitive processes for gains and losses, we also examine alternatives with uncertain outcomes and alternatives with sure outcomes. Previous research demonstrated that sure outcomes have a special status in people’s mind. Kahneman & Tversky (1979) described what they called the certainty effect, whereby individuals overweigh sure outcomes compared with un-certain ones. Starting from this evidence, we hypothe-sized that people should process alternatives with sure outcomes and alternatives with uncertain outcomes dif-ferently. In particular, subjects should exhibit more de-liberative processing characteristics (e.g., fixate on more information) when presented with an uncertain outcome rather than a sure one, since uncertainty should make it more difficult to attach a specific value to the gam-ble. Alternatives whose outcomes are impossible to at-tain should be processed more easily and with less effort than alternatives whose outcomes are very unlikely but not impossible. Again, subjects should exhibit more de-liberative processing characteristics when they evaluate an alternative whose outcomes are almost impossible be-cause uncertainty makes its value harder to judge. There-fore, the current study will provide additional evidence about the processes behind the certainty effect (Kahne-man & Tversky, 1979) and extend these findings to the lower end of the probability scale.
Hypothesis 3a: More information should be attended to, in terms of overall eye fixation count, when subjects evaluate alternatives with uncertain outcomes (e.g., 98% chance to either gain or lose) rather than alternatives with sure outcomes (100%), because uncertainty should con-tribute to making an alternative’s overall value more dif-ficult to judge.
Hypothesis 3b: Similarly, the evaluation of alternatives offering an impossible outcome (0%) should induce sub-jects to attend to less information (in terms of overall fix-ation count) than the evalufix-ation of alternatives offering outcomes that are almost impossible (e.g., a 2% chance of either gain or lose).
types of outcomes (sure versus uncertain) should also af-fect how alternatives are evaluated. If people attend more to payoffs in the WTP-task, then they should be less sen-sitive to the difference between sure and uncertain out-comes, since less attention is deployed to the processing of probabilities. However, such diminished sensitivity to the difference between sure and uncertain outcomes should not arise in the rating task since, in this case, people do not attend more to payoffs than probabilities. Therefore, we expect to find a difference between sure and uncertain outcomes when subjects are asked to rate their attractiveness, whereas no difference should arise when subjects are asked to set a price.
We derive this hypothesis directly from the compati-bility effect. Since the response mode has an effect on which piece of information is weighed more highly, peo-ple’s appreciation of the difference between alternatives with sure and uncertain outcomes should depend on the method used to elicit preferences. For instance, even when the chances to win or lose are very close (e.g., 100% vs. 98% or 0% vs. 2%), the difference between certainty and uncertainty can still make a substantial difference in the way people perceive the alternatives. Because of the compatibility effect, such difference should be more rele-vant when subjects provide ratings of attractiveness rather than when they specify a price.
We hypothesized that people should provide higher at-tractiveness ratings for a 100% gain compared to a 98% gain and for a 2% gain compared with a 0% gain. Sim-ilarly, subjects should provide higher attractiveness rat-ings for a 98% loss compared with a 100% loss and for a 0% loss compared with a 2% loss. However, subjects should set similar prices for 100% and 98% alternatives and also for 0% and 2% ones.2
Hypothesis 4a: According to the compatibility effect, we expect that valuations of gambles are more influenced by the gambles’ outcomes when these valuations consist of prices (vs. attractiveness ratings).
Hypothesis 4b: Since rating and pricing should induce people to attend to the outcomes differently, alternatives with sure and uncertain outcomes will be evaluated dif-ferently when people are asked to rate attractiveness, but not when they are asked to set a price.
In summary, the main goal of this study is to apply the eye-tracking methodology to the investigation of the compatibility effect as well as to extend the analysis of this effect by linking it to dual-process theories of deci-sion making (see Epstein, 1994; Chen & Chaiken, 1999;
2We are aware that subtle changes in the wording may have a
signif-icant impact on people’s preferences, therefore influencing the results. For instance, we presented the alternatives with uncertain outcomes as 98% chance to gain (lose) CX and 2% chance to gain (lose) nothing. Different results might be found when the same alternative is worded as 98% chance to gain (lose) CX and 2% chance to lose (gain) nothing (see also Bateman et al., 2007).
Evans, 2008; Hypotheses 1a and 1b). Further, we hy-pothesize that subjects should exert more cognitive ef-fort with increasing losses (Hypothesis 2). People should also attend to more information when evaluating alter-natives with uncertain outcomes (98%) rather than al-ternatives with sure outcomes (100%; Hypothesis 3a). Similarly, they should attend to less information when evaluating alternatives with impossible outcomes (0%) rather than alternatives with almost impossible outcomes (2%; Hypothesis 3b). Finally, Hypothesis 4a and 4b state that valuations should be influenced by the gambles’ at-tributes compatible with the response scale and that sub-jects should provide different evaluations for alternatives with sure versus uncertain outcomes when they provide a rating of attractiveness.
2
Method
2.1
Subjects and design
A total of 37 undergraduates (Mean age = 22.9, SD = 3.3; 59% female) from the University of Bonn, Germany, took part in the study. Subjects had normal or corrected-to-normal vision, completed the study (approximately 45 minutes) individually, and were compensated with C10 (approximately $14) for their time. The independent vari-ables of interest included the amount to be won (lost), its associated probability, and the response mode (attractive-ness rating vs. willing(attractive-ness to pay). They were all manip-ulated within-subjects, with between-subjects variables only being used for counterbalancing of the presentation order and order of the response tasks (see below). The main dependent variables consisted of the two evalua-tion tasks: ratings of attractiveness and willingness to pay (WTP). WTP-tasks were played only hypothetically since none of the gambles was played for real. Additionally, we recorded subjects’ eye-movements during the task.
2.2
Materials and procedure
The experiment contained 16 gambles that were con-structed out of four different probabilities (i.e., 0%; 2%; 98%; 100%) to win or lose one of four different amounts of money (C2.50; C5.00; C7.50; C10.00). Each proba-bility was crossed with each payoff amount to result in 16 winning gambles and 16 losing gambles. Subjects evalu-ated the 32 gambles twice: once on an attractiveness scale (anchored by−5 = “very unattractive” and 5 = “very
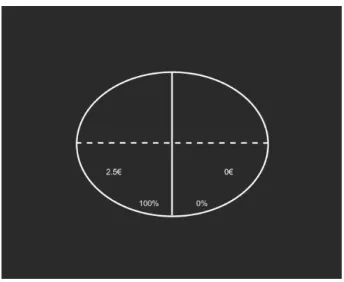
Figure 1: Screenshot of gambles presentation during the experiment.
at each presentation: the probability to win (lose), the winning (losing) amount, the complimentary probability to win (lose) nothing and a zero to denote the amount at-tached to the complimentary probability. For example, a gamble with a 2% probability to win C5.00 was accom-panied by the complimentary 98% probability to win C0. The length and location of the scale on the screen was identical in both response modes: 500 pixels in length and placed at the bottom of the screen. The presen-tation order of the gambles was fully randomized and the order of the response mode (attractiveness rating vs. willingness-to-pay) was block-randomized within-subjects. The gamble attributes regarding the winning (losing) probability and amount were presented in one of four quadrants of a circle and equidistant to the cen-ter of the compucen-ter screen. The gamble attributes of the complementary probability were presented in the op-posite horizontal quadrant (always leaving 2 quadrants empty each trial). This was done in order to avoid an-ticipatory attentional focus prior to the onset of the gam-ble attributes (see Figure 1, for an example of how the gambles were presented).
Subjects’ eye-movements were recorded with the Eye-gaze binocular system (LC Technologies), with a binocu-lar sampling rate of 120 Hz and fixation accuracy of about 0.45°. The two infrared-sensitive corneal cameras were positioned underneath a 17-inch color computer screen monitor (Samsung Synchmaster 740B, refresh rate 60 Hz, reaction time 5 ms) with a resolution of 1280 x 1024 pixels and approximately 60 cm away from the subject. Individual fixations were recorded for fixations with a length of at least 50ms and fixation radius of 20 pixels. To determine information acquisition, for each trial we determined four (out of eight possible) fixed (160 pixels
long and 50 pixels high) non-overlapping areas of inter-est (AOIs) around the gamble attributes (i.e., two prob-abilities and two outcomes), which were recorded as an AOI-fixation when subjects fixated on that attribute.
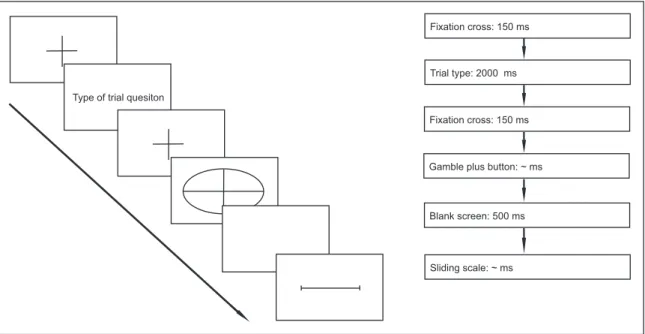
At the start of the experiment, subjects were informed about the eye-tracking procedure and that they were about to be presented with several gambles. They were also in-formed that in some blocks the required evaluation was a rating of each gamble’s attractiveness, whereas in other blocks they had to state how much they would be willing to pay to play a winning gamble (or to avoid having to play a losing gamble). On each trial of the experiment subjects first saw a white fixation cross at the center of the black screen for 150ms, then an indicator of the type of response they were asked to make (attractiveness rat-ing or WTP) for 2000ms, then another fixation cross for 150ms followed by the display of the gamble attributes. Subjects could take as much time as they wanted to look at the gambles’ attributes, once they were ready to answer they had to press the spacebar in order to continue and evaluate the gamble. In between the display of the gam-ble and the evaluation screen a blank screen of 500ms was interleaved. For a schematic representation of the procedure see Figure 2.3
3
Results
3.1
Preliminary data analyses
A manipulation check on the influence of the counterbal-ancing factors response mode and order of gambles re-vealed no difference in valuations due to the order of the response mode (p> .31) or presentation order of gambles (p> .53).4 Subjects’ changes in mean pupil dilation for
every trial were calculated by subtracting the base rate pupil dilation (measured during the presentation of fixa-tion crosses and blank screens in-between trials) from the average pupil dilation over all fixations during any single trial. The mean fixation duration for each trial was cal-culated by averaging across all fixations within each trial during which the gamble was presented on the screen. Table 1 details the summary statistics for the eye-tracking analysis by response mode.5
3Due to a programming mistake, data for attractiveness ratings in
the 98% and 100% gambles with negative outcomes was lost for 29 subjects. Therefore, analyses reported in the text that pertain to losses are based on the data from eight subjects.
4Unless otherwise noted, we standardized both subjects’ ratings on
the attractiveness scale and their willingness to pay.
5Additional preliminary analyses on the general information
Figure 2: Experimental procedure.
Type of trial quesiton
Fixation cross: 150 ms
Trial type: 2000 ms
Fixation cross: 150 ms
Gamble plus button: ~ ms
Blank screen: 500 ms
Sliding scale: ~ ms
3.2
Compatibility effect, processing
strate-gies and cognitive effort
We expected that subjects engage in a more deliberative processing strategy in the WTP-task compared to the rat-ing task, where ratrat-ings should be characterized by a more holistic type of processing (Hypothesis 1a). Addition-ally, the compatibility effect predicts that the outcomes of the gambles are given more weight in the WTP-task than in the attractiveness rating-task (Hypothesis 1b). To test these hypotheses, we conducted a repeated-measures regression with the type of gamble attribute (outcomes vs. probabilities), response mode (WTP vs. attractiveness rating), and the corresponding interaction as predictors of subjects’ fixations on the amounts to be won (or lost) and associated probabilities.6 Results revealed a significant
effect of response mode, b = .47,t(37) = 3.43,p= .002, a non-significant effect of gamble attribute, b = .04,t(37) = 0.58,p> .57, and a marginally significant interaction, b = .08,t(37) = 1.96,p= .058. As expected, per trial more fixations on the amount to be won (lost) and associated probabilities were recorded in the WTP-task (M = 3.95;
SE= 0.29) compared to the attractiveness rating task (M
= 3.01;SE= 0.18), supporting Hypothesis 1a. This sug-gests that attractiveness ratings rely on a more holistic judgment without extensive information acquisition, and possibly recruit intuitive processes relative to more delib-erative processes that underlie a precise WTP-response.
6We controlled for clusters in repeated observations (Rogers, 1993)
in this and all other repeated-measures regressions. Predictors and cri-terion variables were standardized prior to analyses.
Additionally, the marginally significant interaction lends some support to Hypothesis 1b, such that more fixations were recorded on the amount to be won (lost) (M= 4.07;
SE= 0.34) than on the associated probabilities (M= 3.84; SE= 0.26) in the WTP-trials, whereas the amount of fixa-tions in the attractiveness rating-task was fairly equal for outcomes (M= 2.97; SE= 0.20) and probabilities (M = 3.05;SE= 0.18).
Table 1: Eye-tracking summary statistics by response mode: Means and (standard errors).
WTP Attractiveness
Pupil size (radius in mm) 2.100 (.050) 2.090 (.060)
Pupil dilation (∆) −.040 (.005) −.059 (.005)
Mean fixation duration (in sec) .203 (.005) .194 (.004)
Mean evaluation time (in sec) 4.320 (.270) 3.280 (.160)
Number of AOI fixations per decision 14.060 (.950) 11.320 (.620)
Number of total fixations per decision 21.030 (1.190) 16.870 (.780)
Proportion of fixations on amounts to be won (lost) .299 (.010) .270 (.008)
Proportion of fixations on probabilities of amounts to be won (lost) .277 (.007) .266 (.006)
Number of attribute-based transitions (attribute-wise) 2.010 (.130) 1.620 (.100)
Number of alternative-based transitions (alternative-wise) 4.830 (.370) 4.030 (.250)
Note. Eye-tracking statistics are calculated during presentation of gambles (excluding the response phase); attribute-based transitions are transitions between the two outcomes (and the two probabilities), alternative-based transitions consist of transitions between outcomes and their respective probabilities within one side of the gamble; standard errors are robust and adjusted for 37 clusters of observation.
3.2.1 Total number of AOI fixations, fixation length, and pupil dilation
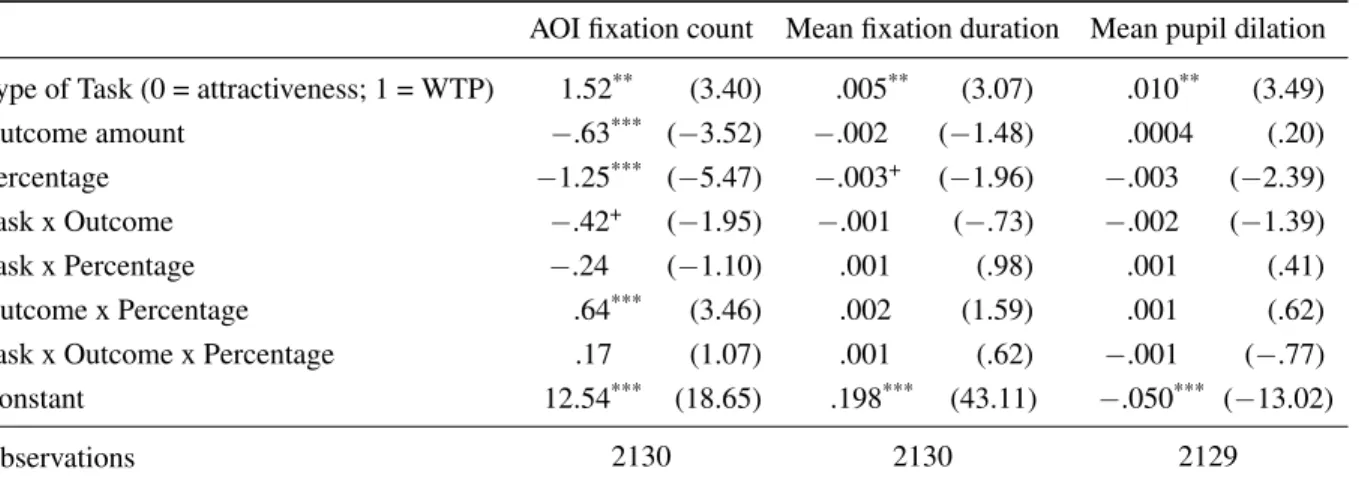
Results of the regression analyses are presented in Table 2. As expected, the total number of AOI fixations in-creased in the WTP-task compared to the attractiveness rating-task. In line with Hypothesis 1a, more careful information acquisition took place when subjects were asked to set a price for a gamble compared to rating its attractiveness. Additionally, the number of total AOI fix-ations decreased as the outcome increased, which is sup-portive of Hypothesis 2.7 Finally, the marginally
signif-icant interaction (p = .059) between task and outcome amount provides further evidence for Hypothesis 1b, as the relationship between the amount to be won (lost) and total AOI fixations was stronger in the WTP-task, b =
−1.04,t(37) =−3.58,p= .001, than in the attractiveness
rating task, b =−.65,t(37) =−2.44,p= .02.
Addition-ally, results revealed that total AOI fixations increased as percentages decreased. Furthermore, the interaction between outcome amount and percentages revealed that fixations increased with decreasing amount only for low probabilities (i.e., 0 and 2%).
Similar to the results for the number of fixations, we also found a main effect for type of task and percentage for the average fixation duration. The average duration of a fixation was significantly longer in the WTP-task,
7Further analyses revealed that the effect of outcomes on fixation
count are best described by a linear trend (b =−1.01,t=−4.71,p<.001) such that fixations decreased as the outcome amount increased from
−10 to 10. Using a dichotomous gain vs. loss predictor instead of con-tinuous outcomes showed similar results such that fixation counts were higher for losses than gains, b =−0.53, t =−2.94, p<.001.
indicating deeper and more deliberative processing com-pared to the attractiveness rating task (Hypothesis 1a). Also, fixation length increased as percentages decreased and as the winning (losing) outcomes decreased, albeit not significantly so (as would be predicted by Hypothesis 2). Moreover, the interaction between type of task and outcome was not significant (as would be predicted by Hypothesis 1b).
Finally, results for pupil dilations showed a main ef-fect for task type such that pupil dilation was bigger in the WTP-task compared to the rating task, supporting the notion that subjects exerted more cognitive effort during pricing tasks (Hypothesis 1a). Also, pupil dilation in-creased as percentages dein-creased. However, neither the main effect for outcome amount nor the interaction be-tween outcome and task reached statistical significance.
3.3
Difference between alternatives with
sure (or impossible) and uncertain
out-comes
Table 2: Total AOI fixation count, mean fixation duration, and mean pupil dilation.
AOI fixation count Mean fixation duration Mean pupil dilation
Type of Task (0 = attractiveness; 1 = WTP) 1.52** (3.40) .005** (3.07) .010** (3.49)
Outcome amount −.63*** (−3.52) −.002 (−1.48) .0004 (.20)
Percentage −1.25*** (−5.47) −.003+ (−1.96) −.003 (−2.39)
Task x Outcome −.42+ (−1.95) −.001 (−.73) −.002 (−1.39)
Task x Percentage −.24 (−1.10) .001 (.98) .001 (.41)
Outcome x Percentage .64*** (3.46) .002 (1.59) .001 (.62)
Task x Outcome x Percentage .17 (1.07) .001 (.62) −.001 (−.77)
Constant 12.54*** (18.65) .198*** (43.11)
−.050*** (−13.02)
Observations 2130 2130 2129
Note. Outcome amount includes all gain and loss outcomes;tstatistics in parentheses are based on robust standard errors and adjusted for 37 clusters of observation; predictors were standardized;+p< 0.10, *p< 0.05, **p< 0.01,
***p< 0.001.
Table 3: AOI fixations dependent on task and uncertain (98%) vs. sure (100%) probabilities.
Fixations on winning/losing % Fixations on winning/losing $
Type of task (0 = attractiveness; 1 = WTP) .465** (3.03) .660*** (3.52)
Probability (1 = 100%; 0 = 98%) −.316** (2.83) −.195+ (−1.95)
Task x probability (1 = 100%; 0 = 98%) −.110 (−1.24) −.102 (−1.18)
Constant 3.420*** (15.54) 3.419*** (14.79)
Observations 948 948
Note.tstatistics in parentheses are based on robust standard errors and adjusted for 37 clusters of observation; predictors are standardized;+p< 0.10, *p< 0.05, **p< 0.01, ***p< 0.001.
gamble featured a 98% rather than a 100% outcome. In other words, subjects paid more attention to the proba-bility of an almost sure outcome (i.e., 98%) than on the probability of a sure outcome (i.e., 100%; see Table 3). This effect was almost significant (p= .059) for fixations for the winning (losing) outcome. These findings are in line with Hypothesis 3a, which states that subjects should attend to more information about probabilities when eval-uating alternatives with almost sure outcomes than alter-natives with sure outcomes. Also, as already demon-strated fixations for both probabilities and outcome in-formation increased in the WTP-task. Furthermore, al-though neither of the interactions reached statistical sig-nificance, subjects paid significantly more attention to al-most sure probabilities (i.e., 98%) than sure probabilities (i.e., 100%) only in the WTP-trials, b =−0.43, t(37) = −3.52,p= .001, whereas this was not the case in
attrac-tiveness trials, b =−0.20,t(37) =−1.27,p= .211.
Sim-ilarly, subjects paid significantly more attention to out-comes of almost sure vs. sure probabilities in the
WTP-trials, b =−0.30,t(37) =−2.46,p= .019, but not in the
attractiveness trials, b =−0.09,t(37) =−0.66,p= .513.
Similarly, we found that more attention is given to the winning (losing) outcomes as well as their respective probabilities when the chance to win (lose) was possi-ble (i.e., 2%) rather than impossipossi-ble (i.e., 0%; see Ta-ble 4). These findings are in line with Hypothesis 3b, which states that subjects should attend to less informa-tion about probabilities when evaluating alternatives with impossible outcomes than alternatives with almost im-possible outcomes. In addition, more fixations on the re-spective AOIs were present in WTP-trials vs. attractive-ness trials. Finally, both for fixations on winning (los-ing) outcomes as well as their respective probabilities a significant interaction between task and probability type demonstrated that subjects attended more to the informa-tion of probable (vs. impossible) gambles in the WTP-trials (b =−0.52,t(37) =−4.30,p< .001, and b =−0.49, t(37) =−4.06,p< .001 for probabilities and outcomes,
Table 4: AOI fixations dependent on task and uncertain (2%) vs. impossible (0%) probabilities.
Fixations on winning/losing % Fixations on winning/losing $
Type of task (0 = attractiveness; 1 = WTP) .345* (2.69) .479** (2.99)
Probability (1 = 0%; 0 = 2%) −.303** (−3.59) −.276** (−2.80)
Task x probability (1 = 0%; 0 = 2%) −.221** (−3.27) −.220** (−3.30)
Constant 3.456*** (17.65) 3.583*** (14.64)
Observations 1182 1182
Note.tstatistics in parentheses are based on robust standard errors and adjusted for 37 clusters of observation;
+p< 0.10, *p< 0.05, **p< 0.01, ***p< 0.001
=−0.88,p= .385, and b =−0.06,t(37) =−0.56,p= .581
for probabilities and outcomes, respectively).
Overall these results demonstrate that, in line with Hy-pothesis 3a and 3b, a 98% probability attracts more atten-tion than a 100% probability, possibly because it may be harder to process or represent mentally. Likewise, a 2% chance seems to attract more attention than 0%. Addi-tionally, the interactions with the type of task further sug-gest that this effect is stronger when subjects set a price for the gambles compared to rating the gambles’ attrac-tiveness.
3.4
Compatibility effect in the evaluation of
gambles
According to the compatibility effect, valuations should be influenced more by outcomes when they represent prices rather than attractiveness ratings. Therefore, we regressed gamble outcomes, type of task (WTP vs. attrac-tiveness ratings), and the interaction on subjects’ evalua-tions separately for winning and losing outcomes. For winning outcomes, results indicated that valuations were higher as gamble outcomes increased, b = .45, t(37) = 13.87, p <.001, that valuations were higher for
attrac-tiveness ratings than prices, b =−.46, t(37) =−7.51,p
<.001, and also a significant interaction between gamble outcomes and task, b = .24,t(37) = 5.2,p<.001. As
ex-pected, the influence of gamble outcomes had a stronger effect on valuations in the WTP-task, b =.69, t(37) = 11.35, p <.001, than in the attractiveness rating task, b = .20, t(37) = 3.89, p <.001. For losing outcomes, re-sults were similar such that valuations were significantly predicted by gamble amount, b =−.39, t(37) =−9.42, p <.001, by task, b =−.19, t(37) =−3.00,p <.01, and
the interaction, b =−.42,t(37) =−8.87,p<.001.
Impor-tantly, gamble amount was predictive of valuations only in the WTP-task, b =−.81,t(37) =−10.43,p<.001, and
not in the attractiveness rating task, b = .03,t(37) = 0.66,
p=.514. Additionally, we also tested whether valuations were more influenced by the gambles’ percentage to win when the task was to provide attractiveness ratings rather than WTP-prices (as would be predicted by the compat-ibility effect). A regression with gamble percent, type of task, and the interaction on subjects’ evaluations for winning gambles revealed a main effect for gamble per-cent, b =.69,t(37) = 14.36,p<.001, and task, b =−.24, t(37) =−5.21,p<.001, in addition to a significant
inter-action, b =−.10, t(37) =−3.06, p <.01. As expected,
the relationship between gamble percent and evaluations was stronger in the rating task, b = .79,t(37) = 13.75,p
<.001, than in the WTP-task, b = .59, t(37) = 10.02, p
<.001. For losing gambles, valuations were also signifi-cantly predicted by percentages, b = .08,t(37) = 2.19,p
<.05, by task, b = .31,t(37) = 6.49,p<.001, and the in-teraction, b = .44,t(37) = 9.05,p<.001. Not surprisingly,
while increasing percentages decreased attractiveness rat-ings, b =−.36,t(37) =−5.25,p<.001, it increased WTP
(for not having to play the gamble), b = .52,t(37) = 10.06, p<.001. The above results are in direct support of the compatibility effect and Hypothesis 4a.
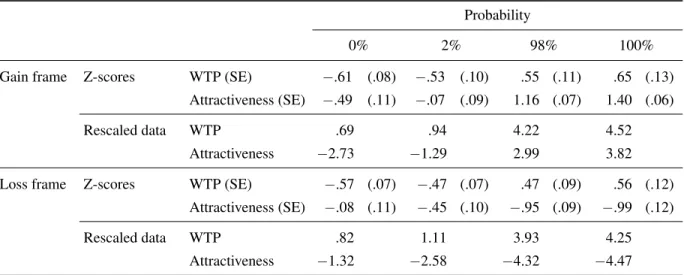
Hypothesis 4b states that there should be a difference in the evaluation of alternatives offering sure gains (or sure losses) versus uncertain gains (or uncertain losses) when subjects are asked to rate them rather than to set a price. Both z-scores and rescaled means for gains and losses at the different probability levels are presented in Table 5.
un-Table 5: Evaluation of alternatives in the two experimental tasks (both raw and rescaled means).
Probability
0% 2% 98% 100%
Gain frame Z-scores WTP (SE) −.61 (.08) −.53 (.10) .55 (.11) .65 (.13)
Attractiveness (SE) −.49 (.11) −.07 (.09) 1.16 (.07) 1.40 (.06)
Rescaled data WTP .69 .94 4.22 4.52
Attractiveness −2.73 −1.29 2.99 3.82
Loss frame Z-scores WTP (SE) −.57 (.07) −.47 (.07) .47 (.09) .56 (.12)
Attractiveness (SE) −.08 (.11) −.45 (.10) −.95 (.09) −.99 (.12)
Rescaled data WTP .82 1.11 3.93 4.25
Attractiveness −1.32 −2.58 −4.32 −4.47
Note. Z-scores were computed separately for WTP and attractiveness trials. Rescaled WTP scores denote actual prices in Euros, and rescaled attractiveness ratings ranged from−5 to +5.
certain outcomes depend on the type of task. The signifi-cant interactions between the type of probability and task for the comparison between 0% vs. 2% supports our hy-pothesis. However, this interaction was not significant for the comparison between 98% vs. 100%. The significant three-way interaction further suggests that the interaction between probability type and task depends on whether the gamble outcomes were positive or negative. For positive outcomes, subjects gave higher valuations for gambles with a 2% vs. a 0% chance of winning, but this effect was stronger for attractiveness ratings than for WTP-prices, b = .33,t(37) = 3.42,p<.01. For negative outcomes, sub-jects gave higher valuations for gambles with a 0% vs. 2% chance of losing, but again this effect was stronger for attractiveness ratings than for WTP-prices, b =−.46, t(37) =−5.54,p<.001. For gambles with 98% vs. 100%
chances of winning (losing), the pattern of results looked similar but failed to reach significance both for winning gambles and losing gambles (ps > .17). Overall, these re-sults demonstrate that the difference between impossible and uncertain outcomes primarily emerges in ratings of attractiveness but not when subjects focus more on pay-offs making the difference between probabilities less rel-evant. Results for sure vs. uncertain outcomes were less clear, which might have resulted from a lack of power in these conditions.
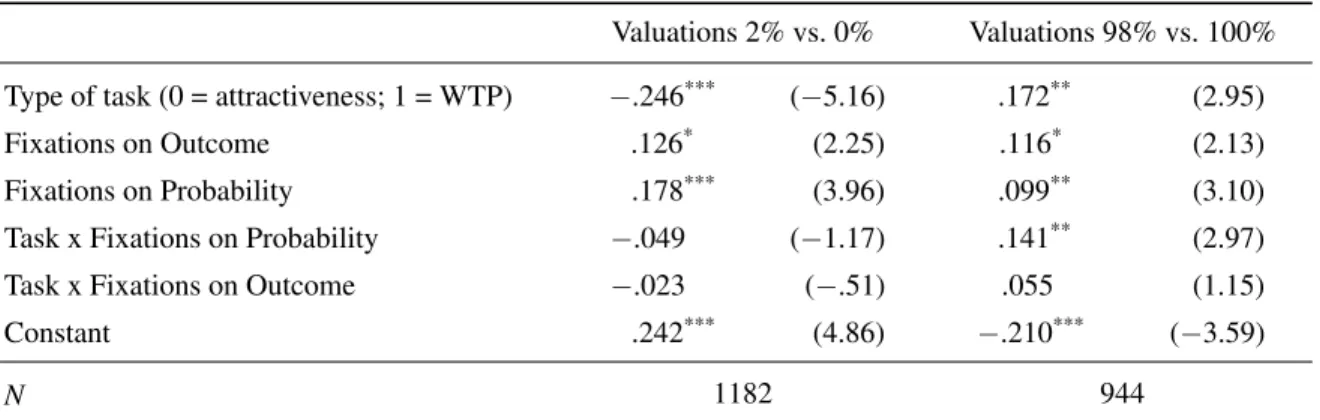
Finally, we also examined whether valuations of gam-bles were predicted by fixations on information regarding the gamble’s outcome (i.e., amount to be won or lost) and respective percentage, and whether this was dependent on the type of task. We ran separate regression analyses for
positive and negative outcomes, in which subjects’ valu-ations of the gambles were predicted by the proportion of fixations on outcome, respective probability, and the two-way interactions with task type. Results in Table 7 show that (apart from the main effects for task) fixations on out-comes as well as fixations on probabilities increased val-uations for gambles. With the exception of fixations on probabilities for loss gambles, these effects were not task dependent. For loss gambles, more fixations on percent-ages increased people’s willingness to pay (to not play the gamble), b = .20,t(37) = 4.06,p<.001, while it did not change attractiveness ratings, b =−.06,t(37) =−1.00,p
=.325.
4
Discussion
The present paper used an eye-tracking technique to as-sess the effect that a specific set of variables has on the strategies used to process and evaluate these mone-tary prospects. In particular, we manipulated the type of task (response mode: WTP vs. attractiveness rating), the amounts to be won (lost), and the probabilities associated with the outcome of simple gambles (sure or impossible outcomes vs. uncertain, almost sure or almost impossible ones).
out-Table 6: Evaluation of alternatives dependent on task, outcome, and probability.
Valuations 2% vs. 0% Valuations 98% vs. 100%
Outcome type (0 = losses; 1 = gains) .373*** (4.10) 2.113*** (16.80)
Probability type (0 = uncertain; 1 = sure) .367*** (5.03)
−.042 (−.79)
Type of task (0 = attractiveness; 1 = WTP) −.024 (−.23) 1.416*** (9.71)
Outcome type x probability −.781*** (−6.00) .284*** (3.91)
Outcome type x task −.427*** (−3.75) −2.026*** (−11.86)
Probability x task −.463*** (−5.54) .139 (1.80)
Outcome type x probability x task .794*** (5.40)
−.280* (−2.21)
Constant −.449*** (−4.69) −.951*** (−10.60)
N 1182 948
Note.tstatistics in parentheses are based on robust standard errors and adjusted for 37 clusters of observation; Valuations were standardized;+p< 0.10, *p< 0.05, **p< 0.01, ***p< 0.001.
Table 7: Evaluation of alternatives dependent on task, fixations on outcome and fixations on probability.
Valuations 2% vs. 0% Valuations 98% vs. 100%
Type of task (0 = attractiveness; 1 = WTP) −.246*** (−5.16) .172** (2.95)
Fixations on Outcome .126* (2.25) .116* (2.13)
Fixations on Probability .178*** (3.96) .099** (3.10)
Task x Fixations on Probability −.049 (−1.17) .141** (2.97)
Task x Fixations on Outcome −.023 (−.51) .055 (1.15)
Constant .242*** (4.86)
−.210*** (−3.59)
N 1182 944
Note.tstatistics in parentheses are based on robust standard errors and adjusted for 37 clusters of observation; variables were standardized;+p< 0.10, *p< 0.05, **p< 0.01, ***p< 0.001.
comes when asked to set a price but they exert more effort in doing this. In other words, we maintain that WTP-evaluations are made relying on deliberative think-ing processes whereas attractiveness ratthink-ings are based on more holistic processes. The eye-tracking methodology allows us to reach a more precise conclusion on this issue than previous data from the Mouselab computer-based process-tracing technique (Schkade & Johnson, 1989).
Results confirmed that outcomes of gambles are given more weight in the WTP-task compared to the rating task. Subjects attended more to this information when they had to provide a price, whereas the attention directed to out-comes and probabilities was not significantly different when subjects were asked to judge the gambles’ attrac-tiveness. In addition, AOI-fixations, fixation duration, and average pupil dilation were greater for the
clarification since we are not suggesting that specifying a price is necessarily a task requiring a cold, analytical processing, but rather that the higher effort exerted in this condition is a consequence of the need for conscious eval-uation of different pieces of information, possibly includ-ing affective reactions. Therefore, our conclusion is not in contrast with the fact that attending to more informa-tion could be a way to fine-tune the affective reacinforma-tions induced by the components of a gamble.
To our knowledge this is the first time that the com-patibility effect is linked with dual-process theories and with the use of different thinking processes in pricing tasks versus rating tasks. Setting a price requires an eval-uation of the amount of the win (loss) but also a trade-off between costs and benefits. Differently, ratings of attractiveness seem to be more holistic and based on a more general perception of the stimuli, which relies on a more balanced attendance to the different characteristics of stimuli (in our case the amount of the gain (loss) and the associated probability).
In addition, we manipulated the amount to be won (lost) to assess whether it had any impact on the way subjects process information about the gambles. A first contribution of this manipulation was to extend the com-patibility effect to alternatives entailing a clear loss. Pre-vious findings have shown that task-response compati-bility and preference reversals can be obtained not only when presenting people with pairs of mixed gambles hav-ing positive expected values, but also presenthav-ing them with pairs of mixed gambles having negative expected values (Lichtenstein & Slovic, 1973). However, previ-ous studies have not tested the compatibility effect with simple gambles offering only a loss. As postulated by prospect theory (Kahneman and Tversky, 1979) people react differently to gains and losses and are more sensi-tive to results involving negasensi-tive outcomes than posisensi-tive ones (i.e., loss aversion). It is noteworthy that the greater weight attached to outcomes in WTP-tasks is present not only when people evaluate simple gambles and alterna-tives with sure outcomes offering a monetary gain but also when they evaluate simple gambles and alternatives with sure outcomes offering a monetary loss.
Further, using both alternatives offering gains and al-ternatives offering losses in the specific context of an eye-tracking study we were able to assess whether in-formation processing depended on the amount to be won (or lost). Results demonstrated that the overall number of fixations was higher when the outcome amount de-creased, suggesting that higher losses induce people to scan information more carefully and engage in more de-liberative information processing. These findings are not only consistent with the notion of loss aversion (Kahne-man & Tversky, 1979), but also with work showing that
people’s attention is more sensitive to negative informa-tion and events (Baumeister et al., 2001; Fischer et al., 2007; Rozin & Royzman, 2001).
Our investigation of the different levels of probability was designed to explore whether processing of certain vs. uncertain outcomes also involves qualitatively different processing modes. In doing so, we assessed both ends of the probability continuum. Our findings are consis-tent with previous research on the certainty and reflec-tion effects demonstrating that sure outcomes have a spe-cial status in people’s mind and are usually preferred to an alternative with uncertain outcomes in the gain frame, whereas they are often rejected in the loss frame (Kah-neman & Tversky, 1979). We found that sure outcomes tend to attract less attention since there are fewer fixations when subjects evaluate these alternatives than when they evaluate uncertain ones. Similar results were found for both ends of the probability continuum. A 0% chance to gain (or lose) attracted less attention than a low, almost non-existing chance (2%) to obtain the same outcomes. In the same way, a 100% chance to gain (or lose) attracted less attention than a high, almost certain chance (98%) to obtain the same outcomes. In both cases subjects engaged in fewer fixations on those probabilities that correspond with the end points of the scale (0% and 100%), there-fore hinting that these two pieces of information are in-deed easier to evaluate (e.g., expected-value calculations should be easier).
Finally, after assessing the eye-tracking indexes related to cognitive effort, we looked into the effect that our in-dependent manipulation had on the evaluation of the dif-ferent alternatives. Results revealed a substantial differ-ence between the two tasks. When people had to rate the attractiveness of alternatives they were influenced by the probabilities whereas in the pricing task, outcomes seemed to be more important. These results provide evi-dence of the effect that different processing strategies ac-tivated by variations in contextual factors (i.e., the task used to elicit preferences or the degree of uncertainty) may have on people’s preferences.
Despite this limitation, the present work provides im-portant evidence for the compatibility effect being linked to dual-process theories in an economic context. Consis-tent with this approach, we found that a pricing task is more likely than a rating task to engage people’s atten-tion and to induce them to exert more effort. We also demonstrated that contextual features of the alternatives can selectively activate different information processing strategies. For instance, we found that the uncertainty of the outcome is more likely than certainty to induce people to attend to more information.
Our results extend prior work on the role of attention in the construction of preferences (e.g., Armel, Beaumel, & Rangel, 2008; Ashby, Dickert, & Glöckner, 2012; Dickert & Slovic, 2009; Shimojo, Simion, Shimojo, & Scheier, 2003; Willemsen et al., 2011) and dual infor-mation processing in the classic finding of preference re-versals in the compatibility effect (Schkade & Johnson, 1989). It is quite likely that the influence of deliberative vs. holistic processing is not restricted to preferences re-garding simple gambles. However, future research should critically investigate the role of cognitive processes un-derlying response mode effects in different domains.
References
Anderson, A. K. (2005). Affective influences on the at-tentional dynamics supporting awareness. Journal of Experimental Psychology: General. 134, 258–281. Armel, K. C., Beaumel, A., & Rangel, A. (2008).
Bias-ing simple choices by manipulatBias-ing relative visual at-tention.Judgment and Decision Making, 3, 396–403. Ashby, N., Dickert, S., & Glöckner, A. (2012). Focusing
on what you own: Biased information uptake due to ownership. Judgment and Decision Making, 7, 254– 267.
Bateman, I., Dent, S., Peters, E., Slovic, P. & Starmer, C. (2007). The affect heuristic and the attractiveness of simple gambles.Journal of Behavioral Decision Mak-ing, 20, 365–380.
Baumeister, R. F., Bratslavsky, E., Finkenauer, C. & Vohs, K. D. (2001). Bad is stronger than good. Re-view of General Psychology, 5, 323–370.
Beatty, J. (1982). Task-evoked pupillary responses, pro-cessing load, and the structure of propro-cessing resources.
Psychological Bulletin, 91, 276–292.
Bechara, A., Damasio, H., Trenel, D. & Damasio, A. R. (1997). Deciding advantageously before knowing the advantageous strategy.Science, 275, 1293–1295. Chapman, G. B. & Johnson, E. J. (1995). Preference
re-versals in monetary and life expectancy evaluations.
Organizational Behavior and Human Decision Pro-cesses, 62, 300–317.
Chen, S. & Chaiken, S. (1999). The heuristic-systematic model in its broader context. In S. Chaiken and Y. Trope (Eds.),Dual-process Theories in Social Psychol-ogy, pp. 73–96. New York, NY: The Guilford Press. Dickert, S., & Slovic, P. (2009). Attentional mechanisms
in the generation of sympathy.Judgment and Decision Making, 4, 297–306.
Ditto, P. H., Scepansky, J. A., Munro, G. D., Apanovitch, A. M. & Lockhart, L. K. (1998). Motivated sensitiv-ity to preference-inconsistent information. Journal of Personality and Social Psychology, 75, 53–69. Dunegan, K. J. (1993). Framing, cognitive modes, and
image theory: Toward an understanding of a glass half full.Journal of Applied Psychology, 78, 491–503.
Epstein, S. (1994). Integration of the cognitive and the psychodynamic unconscious. American Psychologist, 49, 709–724.
Evans, J. S. T. B. (2008). Dual-processing accounts of reasoning, judgment, and social cognition.Annual Re-view of Psychology, 59, 255–278.
Fischer, P., Jonas, E., Frey, D. & Kastenmüller, A. (2007). Selective exposure and decision framing: The impact of gain and loss framing on confirmatory information search after decisions.Journal of Experimental Social Psychology, 44, 312–320.
Glöckner, A. & Herbold, A. (2011). An eye-tracking study on information processing in risky decisions: Evidence for compensatory strategies based on auto-matic processes.Journal of Behavioral Decision Mak-ing, 24, 71–98.
Goldstein, W. & Einhorn, H. J. (1987). Expression theory and the preference reversal phenomena.Psychological Review, 94, 236–254.
Grether, D. M. & Plott, C. R. (1979). Economic theory of choice and the preference reversal phenomenon. Amer-ican Economic Review, 69, 623–628.
Hamm, R. M. (1979). The conditions of occurrence of the preference reversal phenomenon.Harvard University: Unpublished Doctoral Dissertation.
Horstmann, N., Ahlgrimm, A. & Glöckner, A. (2009). How distinct are intuition and deliberation? An eye-tracking analysis of instruction-induced decision modes.Judgment and Decision Making, 4, 335–354. Just, M.A., & Carpenter, P.A. (1980). A theory of
read-ing: From eye fixations to comprehension. Psycholog-ical Review, 87, 329–354.
Kahneman, D. & Tversky, A. (1979). Prospect theory: An analysis of decision under risk. Econometrica, 47,
263–292.
the observability of preferences by experimental meth-ods.Econometrica, 55, 675–685.
Knutson, B., Rick, S., Wimmer, G. E., Prelec, D. & Loewenstein, G. (2007). Neural predictors of pur-chases.Neuron, 53, 147–156.
Lichtenstein, S. & Slovic, P. (1971). Reversals of prefer-ence between bids and choices in gambling decisions.
Journal of Experimental Psychology, 89, 46–55. Lichtenstein, S. & Slovic, P. (1973). Response-induced
reversals of preference in gambling: An extended replication in Las Vegas.Journal of Experimental Psy-chology, 101, 16–20.
Lindman, H. R. (1971). Inconsistent preferences among gambles. Journal of Experimental Psychology, 89,
390–397.
Lopes L. L. (1987). Between hope and fear: The psy-chology of risk.Advances in Experimental Social Psy-chology, 20, 255–295.
Öhman, A., Flykt, A. & Esteves, F. (2001). Emotion drives attention: Detecting the snake in the grass. Jour-nal of Experimental Psychology: General, 130, 466– 478.
Polezzi, D., Daum, I., Rubaltelli, E., Lotto, L., Civai, C. et al. (2008). Mentalizing in decision-making. Be-havioural Brain Research, 190, 218–223.
Rogers, W. M. (1993). Sg17: Regression standard errors in cluster samples.Stata Technical Bulletin, 13, 19–23.
Rozin, P. & Royzman, E. B. (2001). Negativity bias, neg-ativity dominance, and contagion.Personality and So-cial Psychology Review, 5, 296–320.
Sanfey, A. G., Rilling, J. K., Aronson, J. A., Nystrom, L. E. & Cohen, J. D. (2003). The neural basis of eco-nomic decision-making in the ultimatum game. Sci-ence, 300, 1755–1758.
Schkade, D. A. & Johnson, E. J. (1989). Cognitive pro-cesses in preference reversals. Organizational Behav-ior and Human Decision Processes, 44, 203–231. Seidl, C. (2002). Preference reversal. Journal of
Eco-nomic Surveys, 16, 621–655.
Shimojo, S., Simion, C., Shimojo, E., & Scheier, C. (2003). Gaze bias both reflects and influences pref-erence.Nature Neuroscience, 6, 1317–1322.
Simon, H. A. (1976). From substantive to procedural rationality. In S. J. Latsis (Ed.), Methodological Ap-praisal in Economics. Cambridge, MA: Cambridge University Press.
Simon, H. A. (1978). Rationality as process and product of thought.American Economic Review, 68, 1–16.
Simon, J. R. (1990). The effect of an irrelevant direc-tional cue on human information processing. In R. W. Proctor & T. G. Reeve (Eds.),Stimulus-response com-patibility: an integrated perspective(pp. 31–38). Am-sterdam, Netherlands: Elsevier.
Slovic, P. & Lichtenstein, S. (1968). Relative importance of probabilities and payoffs in risk taking. Journal of Experimental Psychology Monograph, 78, 1–18.
Slovic, P., Griffin, D., & Tversky, A. (1990). Compatibil-ity effects in judgment and choice. In R. M. Hogarth (ed.),Insights in Decision Making: A Tribute to Hillel J. Einhorn. Chicago: The University of Chicago Press. Tversky, A., Sattath, S., & Slovic, P. (1988). Contingent weighting in judgment and choice. Psychological Re-view, 95, 371–384.
Tversky, A., Slovic, P., & Kahneman, D. (1990). The causes of preference reversal.American Economic Re-view, 80, 204–217.
Velichlovsky, B. M. (1999). From levels of processing to stratification of cognition: Converging evidence from three domains of research. In B. H. Challis and B. M. Velichkovsky (Eds.),Stratification in cognition and consciousness (pp. 203–235). Amsterdam, Nether-lands: John Benjamins Publishing Company.
Von Neumann, J. & Morgenstern, O. (1947). Theory of Games and Economic Behavior. Princeton, N.J.: Princeton University Press.
Vuilleumier, P. (2005). How brains beware: Neutral mechanisms of emotional attention.TRENDS in Cog-nitive Sciences, 9, 585–594.