Licence Creative Commom
CC
RBCDH
1 Centro de Estudos do Labora-tório de Aptidão Física de São Caetano do Sul. São Caetano do Sul, SP. Brasil.
2 Faculdade de Medicina da Universidade de São Paulo. Depar-tamento de Medicina Preventiva. São Paulo, SP. Brasil.
3 Universidade Anhanguera de São Paulo. Programa de Mestrado Proissional em Reabilitação do Equilíbrio Corporal e Inclusão Social. São Paulo, SP. Brasil.
4 Universidade do Oeste Paulista. Faculdade de Medicina. Presidente Prudente, SP. Brasil.
Received: 27 February 2014 Accepted: 21 September 2014
Handgrip strength as a predictor of physical
itness in children and adolescents
Força de preensão manual como preditor de aptidão
física em crianças e adolescentes
Victor Keihan Rodrigues Matsudo1
Sandra Mahecha Matsudo1
Leandro Fórnias Machado de Rezende1,2
Vagner Raso3,4
Abstract – he objective of this study was to examine the association between hangrip strength and physical itness in children and adolescents at diferent stages of sexual maturation. We measured body composition and handgrip strength in 233 children and adolescents (10 - 17 years-old), who varied in terms of pubertal status. he subjects also performed the vertical jump test, standing long jump and sit-ups, as well as tests of lexibility, agility and speed. he level of energy expenditure was assessed with the inter-national physical activity questionnaire. Handgrip strength difered by pubertal status, regardless of gender, whereas other parameters of physical itness difered by gender and in the sample as a whole. Handgrip strength was consistently and independently associated with all other physical itness variables, regardless of gender; some of those were mediated by energy expenditure (i.e., speed in seconds and in meters per second for the sample as a whole). he strength of the association between handgrip strength and physical itness ranged from 20% (vertical jump test: R2=.20; P=.001) to 47% (speed in meters per second: R2=.47; P=.001). Our results support the idea that handgrip strength is consistently associated with several distinct parameters of physical itness, regardless of age, gender or sexual maturation, suggesting that handgrip strength could be a highly accurate, independent predictor of physical itness.
Key words:Energy expenditure; Handgrip strength; Maturation; Physical itness; Pu-bertal status.
Resumo– O objetivo deste estudo foi examinar a associação entre a força de preensão manual e a aptidão física de crianças e adolescentes de diferentes estágios de maturação sexual. Foram medidos a composição corporal e a força de preensão em 233 crianças e adolescentes (10 - 17 anos de idade), de diferentes estágios de maturação biológica. Também foram realizados os testes de impulsão vertical sem auxílio dos membros
supe-riores, teste de abdominal, lexibilidade, agilidade e velocidade. O gasto de energético
foi avaliado através das respostas ao questionário IPAQ. A força de preensão manual diferiu entre os diferentes estágios de maturação sexual. As outras variáveis de aptidão física diferiram entre os sexos. A força de preensão manual esteve associada com to-das as outras variáveis da aptidão física, independentemente do sexo e da maturação sexual. Algumas dessas associações foram mediadas pelo gasto energético. A força da associação entre a força de preensão e de aptidão física variou de 20 % (teste de salto vertical: R2=0,20, P = 0,001) a 47% (velocidade em metros por segundo: R2=0,47, P
Handgrip strength in children Matsudo et al.
INTRODUCTION
Physical itness has been associated with health components1-7 and
physi-cal performance8-10. here are evidences demonstrating that physical
it-ness could predict cardiopulmonary and metabolic disorders4,5, cognitive
function6,7, as well as memory performance7 with important efects on
academic achievement6.
In the last years, muscle strength has been considerate as a signiicant component of health regardless of age2,3,11 and clinical condition13. One
of the most used methods for assessing muscle strength is the handgrip strength14, because has a low cost and may be used in a time-eicient
manner with unsophisticated equipment, mainly in clinical setting13. For
these reasons, many studies have employed handgrip strength as a tool for predicting several health outcomes in adults11 elderly individuals12,16,17
as well as in individuals living with HIV/aids18. In the last years, handgrip
strength has also been used for estimating health outcomes2,3,11,13 and more
recently, physical performance8-10.
For instance, it was reported that handgrip strength was negatively associated with fasting insulin and the HOMA ater controlling for puber-tal status, country and BMI or waist circumference19 and independently
associated with metabolic risk in an important European study (HELENA study)20. Other signiicant evidence involving one million adolescents
followed over 20 years showed that low muscular strength (measured by handgrip, knee extension and elbow lexion) emerged as a factor for major causes of death in young adulthood, such as suicide and cardiovascular diseases11.
On the other hand, there are no studies relating to its potential for predicting overall physical itness. Some available studies demonstrate that handgrip strength is signiicantly correlated with swimming (R=.78)9 and
tennis performance (R=-.67)10, but not necessarily with physical itness.
It is also possible to predict adult handgrip strength from childhood and adolescent data with a high accuracy in Gausian maturity groups, but not in skeweed distributions21. Most possibly, due to the fact that stature and
mass seem to be more important correlates of muscle strength than age, cross-sectional area and maturity22 in individuals displaced from a normal
distribution23. herefore, the purpose of this study was to examine the
association between handgrip strength with physical itness in children and adolescents at diferent stages of sexual maturation.
METHODOLOGICAL PROCEDURES
Subjects
in-cardiovascular, pulmonary or metabolic disease were excluded, as were those using any drugs known to afect the cardiovascular or respiratory system, those with central or peripheral nervous system disorders, those presenting with malnutrition or obesity, those having undergone surgery in the last three months, those for whom bed rest had been prescribed in the last three months and those with any orthopedic disorder that would limit their physical performance.
We included 233 children from 10 to 17 years of age. hose who agreed to participate in the study were informed of the study objectives, procedures and risks. Written informed consent was obtained from the parents or legal guardians of the volunteers. he study was approved by the research ethics committee of the Universidade Federal de São Paulo (UNIFESP) protocol 0056/10.
Body composition
Height and weight were measured with a stadiometer and a digital scale, respectively, while the volunteers were wearing light clothing without shoes. Body mass index was calculated as weight in kilograms divided by height in meters squared24. Waist circumference was measured at the
midpoint between the lower margin of the last palpable rib and the top of the iliac crest25.
Body fat was expressed as the average of three measures of the seven skinfolds (biceps, triceps, subscapular, suprailiac, mid-axillary, abdomen and calf) with a Harpenden skinfold caliper. We calculated the arm muscle area (AMA) by arm circumference − (triceps skinfold × 0.314)26.
Sexual maturation
Sexual maturation was classiied on the basis of Tanner staging (self-reported pubertal status) as: prepubescent, pubescent, and postpubescent27.
Each volunteer entered an isolated room, where, using a set of images ex-emplifying the various stages of sexual maturation, they categorized the development of their own genitalia (for boys), breasts (for girls), armpits (for boys) and public hair (for both genders); the reproducibility of our data reached 71%.
Handgrip strength
Handgrip strength in children Matsudo et al.
Energy expenditure
he International Physical Activity Questionnaire (IPAQ) was used in order to determine the amount of energy expended in various physical activities28.
Volunteers reported the frequency and duration of light, moderate and vigorous physical activity, deined as expending 3.3 metabolic equivalent of task (MET), 4.0 MET and 8.0 MET, respectively, and those data were combined to give an approximate activity score of energy expenditure per week (kJ). he duration of each activity (in minutes per day) was multiplied by the reported frequency (in days per week); the accumulated MET-min values were then multiplied by body weight (in kg) and converted to kJ·min−1 on the assumption that 1 MET was equivalent to 4.18 kJ·kg−1·hr−1;
the reproducibility of our data reached R=0.70.
Aerobic power
Aerobic power was determined by a submaximal exercise capacity test on a cycle ergometer (Ergomedic; Monark AB, Varberg, Sweden). he test began with a 4-min warm-up period at a workload of 0.5 kg, followed by another 4-min period with an increase in workload of 4% of body weigh29;
the reproducibility of our data reached R=0.88.
Lower limb strength
To estimate the muscle strength of the lower limbs, we applied horizontal and vertical jump tests. In the horizontal jump (standing long jump) test, subjects were asked to stand behind a line on the loor, with their feet par-allel to each other and spread to shoulder width, then jump forward as far as possible. he best of three attempts was included in the analysis. In the vertical jump test, subjects were asked to stand facing a wall, extend their arms in front of them, then jump as high as possible while keeping their arms parallel to the loor (i.e., not using their arms to impel themselves upward). he vertical jump height was deined as the diference between the point level with the ingers when standing and highest point reached (also level with the ingers), and the best of three attempts was included in the analysis; the reproducibility of our data reached R=0.97.
Sit-ups
To evaluate the strength of the trunk, we employed the sit-up test. Subjects were asked to lie on their backs, with their hips and knees lexed and their arms crossed over their chests, and do as many sit-ups as possible during a period of 60 s. Only complete sit-ups (those in which the forearms touched the thighs) were counted; the reproducibility of our data reached R=0.72.
Flexibility
Agility
To evaluate agility, we applied a shuttle run test in which subjects attempt to run a 9.14-m course as rapidly as possible, bringing two blocks (one at a time) from the inish line back to the starting line, crossing each line with at least one foot. he best of two attempts was included in the analysis; the reproducibility of our data reached R=0.89.
Speed
We applied a speed test in which the subjects were asked to run 50 m, in a straight line, as quickly as possible in a single attempt. he time and the speed (m·s−1) were included in the analysis; the reproducibility of our data
reached R=0.92.
Statistical analysis
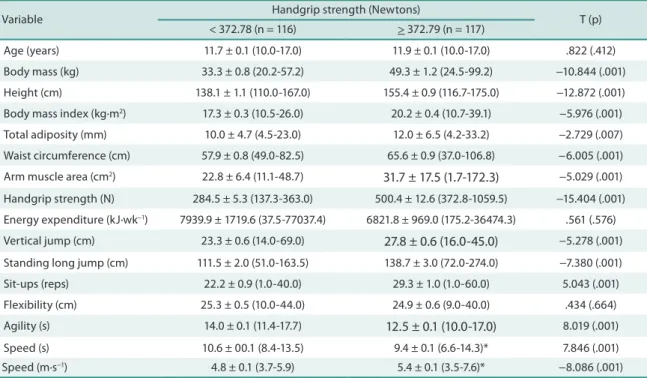
All statistical analyses were performed using the Predictive Analytics Sotware, version 17.0 for Windows (PASW, Inc., Chicago, IL). Data are presented as mean ± standard error of mean. All data presented a nor-mal distribution according to the Kolmogorov-Smirnov test. One-way analysis of variance and the Bonferroni post hoc test were used in order to compare gender groups with pubertal subgroups. Unpaired Student’s t-tests were used in order to compare handgrip strength by percentile (P
0-P50 vs. P50-P100). Using hierarchical multiple regression analysis, we
attempted to determined whether and to what degree physical itness parameters were correlated with age, sexual maturation, arm muscle area, energy expenditure and handgrip strength. Statistical signiicance was set at p < 0.05.
RESULTS
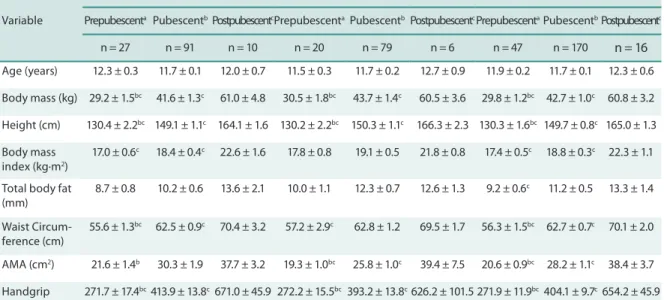
Body mass and body height showed a signiicant diference with pubertal status, by gender and for the sample as a whole. In regard to body compo-sition, we can suggest that waist circumference and arm muscle area are more suitable discriminators of pubertal status than are other parameters (body mass index, total body fat). Handgrip strength difered by pubertal status, regardless of gender. However, physical itness parameters were mainly diferent for boys and for the sample as a whole (Table 1).
Handgrip strength in children Matsudo et al.
We performed pairwise multiple regression for age, sexual maturation, arm muscle area and energy expenditure (Table 3). Regardless of gender, handgrip strength was consistently associated with all physical itness variables, except for lexibility and sit-up capacity (sample as a whole). Some of those associations were mediated by energy expenditure (i.e., speed in seconds and in meters per second for the sample as a whole). Otherwise, the association between handgrip strength and physical itness was in-dependent and ranged in strength from 20% (vertical jump: R2 = 0.20; p
= 0.0005) to 47% (speed in meters per second: R2 = 0.47; p = 0.0005), as
shown in Table 3.
Table 1. Mean and standard error of general characteristics by pubertal status*
Variable
BOYS GIRLS WHOLE SAMPLE
Prepubescenta PubescentbPostpubescentcPrepubescenta PubescentbPostpubescentcPrepubescentaPubescentbPostpubescentc
n = 27 n = 91 n = 10 n = 20 n = 79 n = 6 n = 47 n = 170 n = 16
Age (years) 12.3 ± 0.3 11.7 ± 0.1 12.0 ± 0.7 11.5 ± 0.3 11.7 ± 0.2 12.7 ± 0.9 11.9 ± 0.2 11.7 ± 0.1 12.3 ± 0.6
Body mass (kg) 29.2 ± 1.5bc 41.6 ± 1.3c 61.0 ± 4.8 30.5 ± 1.8bc 43.7 ± 1.4c 60.5 ± 3.6 29.8 ± 1.2bc 42.7 ± 1.0c 60.8 ± 3.2
Height (cm) 130.4 ± 2.2bc 149.1 ± 1.1c 164.1 ± 1.6 130.2 ± 2.2bc 150.3 ± 1.1c 166.3 ± 2.3 130.3 ± 1.6bc 149.7 ± 0.8c 165.0 ± 1.3
Body mass index (kg·m2)
17.0 ± 0.6c 18.4 ± 0.4c 22.6 ± 1.6 17.8 ± 0.8 19.1 ± 0.5 21.8 ± 0.8 17.4 ± 0.5c 18.8 ± 0.3c 22.3 ± 1.1
Total body fat (mm)
8.7 ± 0.8 10.2 ± 0.6 13.6 ± 2.1 10.0 ± 1.1 12.3 ± 0.7 12.6 ± 1.3 9.2 ± 0.6c 11.2 ± 0.5 13.3 ± 1.4
Waist Circum-ference (cm)
55.6 ± 1.3bc 62.5 ± 0.9c 70.4 ± 3.2 57.2 ± 2.9c 62.8 ± 1.2 69.5 ± 1.7 56.3 ± 1.5bc 62.7 ± 0.7c 70.1 ± 2.0
AMA (cm2) 21.6 ± 1.4b 30.3 ± 1.9 37.7 ± 3.2 19.3 ± 1.0bc 25.8 ± 1.0c 39.4 ± 7.5 20.6 ± 0.9bc 28.2 ± 1.1c 38.4 ± 3.7
Handgrip strength (N)
271.7 ± 17.4bc413.9 ± 13.8c 671.0 ± 45.9 272.2 ± 15.5bc 393.2 ± 13.8c626.2 ± 101.5 271.9 ± 11.9bc404.1 ± 9.7c654.2 ± 45.9
Energy expen-diture (kJ·wk−1)
2850 ± 962 7887 ± 2360 ——— 11672 ± 5363 8594 ± 3884 ——— 6564 ± 2462 8208 ± 2158 ———
Vertical jump (cm)
24.6 ± 2.1 26.3 ± 0.6 29.8 ± 2.2 21.5 ± 1.0c 25.0 ± 0.7 31.0 ± 3.7 23.3 ± 1.3c 25.7 ± 0.5c 30.2 ± 1.9
Standing long jump (cm)
108.8 ± 6.2bc 131.5 ± 2.8c 163.6 ± 14.8 106.6 ± 4.7 123.6 ± 3.3 136.2 ± 15.0 108.7 ± 4.0bc 127.6 ± 2.2c 152.6 ± 11.0
Sit-ups (reps) 22.0 ± 2.2bc 28.0 ± 1.0 32.2 ± 4.3 22.5 ± 2.0 24.9 ± 1.3 31.0 ± 5.1 22.2 ± 1.5c 26.4 ± 0.8 31.7 ± 3.2
Flexibility (cm) 25.2 ± 0.8 23.9 ± 0.6 24.7 ± 3.2 26.8 ± 0.9 25.8 ± 0.7 24.8 ± 5.3 25.9 ± 0.6 24.9 ± 0.5 24.7 ± 2.7
Agility (s) 14.3 ± 0.4bc 12.9 ± 0.1 11.9 ± 0.3 14.4 ± 0.3b 13.1 ± 0.1 13.8 ± 0.9 14.3 ± 0.2bc 13.0 ± 0.1 12.6 ± 0.4
Speed (s) 10.8 ± 0.3bc 9.7 ± 0.1c 8.7 ± 0.3 10.6 ± 0.2 10.0 ± 0.1 9.3 ± 0.7 10.7 ± 0.2bc 9.8 ± 0.1c 8.9 ± 0.3
Speed (m∙s−1) 4.7 ± 0.1bc 5.2 ± 0.1c 5.9 ± 0.3 4.7 ± 0.1c 5.1 ± 0.1 5.5 ± 0.5 4.7 ± 0.1bc 5.2 ± 0.1c 5.7 ± 0.2
Variable T (p) < 372.78 (n = 116) > 372.79 (n = 117)
Age (years) 11.7 ± 0.1 (10.0-17.0) 11.9 ± 0.1 (10.0-17.0) .822 (.412)
Body mass (kg) 33.3 ± 0.8 (20.2-57.2) 49.3 ± 1.2 (24.5-99.2) −10.844 (.001)
Height (cm) 138.1 ± 1.1 (110.0-167.0) 155.4 ± 0.9 (116.7-175.0) −12.872 (.001)
Body mass index (kg·m2) 17.3 ± 0.3 (10.5-26.0) 20.2 ± 0.4 (10.7-39.1) −5.976 (.001)
Total adiposity (mm) 10.0 ± 4.7 (4.5-23.0) 12.0 ± 6.5 (4.2-33.2) −2.729 (.007)
Waist circumference (cm) 57.9 ± 0.8 (49.0-82.5) 65.6 ± 0.9 (37.0-106.8) −6.005 (.001)
Arm muscle area (cm2) 22.8 ± 6.4 (11.1-48.7) 31.7 ± 17.5 (1.7-172.3) −5.029 (.001)
Handgrip strength (N) 284.5 ± 5.3 (137.3-363.0) 500.4 ± 12.6 (372.8-1059.5) −15.404 (.001)
Energy expenditure (kJ·wk−1) 7939.9 ± 1719.6 (37.5-77037.4) 6821.8 ± 969.0 (175.2-36474.3) .561 (.576)
Vertical jump (cm) 23.3 ± 0.6 (14.0-69.0) 27.8 ± 0.6 (16.0-45.0) −5.278 (.001)
Standing long jump (cm) 111.5 ± 2.0 (51.0-163.5) 138.7 ± 3.0 (72.0-274.0) −7.380 (.001)
Sit-ups (reps) 22.2 ± 0.9 (1.0-40.0) 29.3 ± 1.0 (1.0-60.0) 5.043 (.001)
Flexibility (cm) 25.3 ± 0.5 (10.0-44.0) 24.9 ± 0.6 (9.0-40.0) .434 (.664)
Agility (s) 14.0 ± 0.1 (11.4-17.7) 12.5 ± 0.1 (10.0-17.0) 8.019 (.001)
Speed (s) 10.6 ± 00.1 (8.4-13.5) 9.4 ± 0.1 (6.6-14.3)* 7.846 (.001)
Speed (m·s−1) 4.8 ± 0.1 (3.7-5.9) 5.4 ± 0.1 (3.5-7.6)* −8.086 (.001)
Shading indicates signiicant associations p<.05
Table 3. Association between handgrip strength and other physical itness variables
β (signiicance level)
Variable Group Model summary Age Sexual
maturation
Arm muscular area
Energy expenditure
Handgrip strength
Vertical jump height
Boys R2=.20; P=.0005 -.118 (.513) -.100 (.705) .076 (.676) -.161 (.384) .505 (.064)
Girls R2=.36; P=.0005 -.065 (.745) .079 (.721) .045 (.832) -.186 (.344) .536 (.024)
Total R2=.29; P=.002 -.081 (.516) -.030 (.851) .074 (.552) -.183 (.144) .511 (.002)
Standing long jump
Boys R2=.46; P=.0005 -.115 (.438) -.054 (.803) .115 (.445) -.126 (.404) .686 (.004)
Girls R2=.44; P=.0005 .074 (.694) -.147 (.487) -.024 (.905) .115 (.533) .744 (.002)
Total R2=.46; P=.0005 -.057 (.600) -.115 (.409) .079 (.472) -.066 (.548) .717 (.001)
Curl up
Boys R2=.25; P=.062 -.084 (.727) -.004 (.989) .055 (.827) -.252 (.289) .362 (.187)
Girls R2=.20; P=.187 .045 (.816) -.164 (.562) .096 (.624) .102 (.604) .547 (.062)
Total R2=.24; P=.010 -.043 (.755) -.083 (.632) .094 (.497) -.212 (.127) .467 (.010)
Flexibility
Boys R2=.01; P=.648 -.153 (.429) -.025 (.930) .009 (.965) -.351 (.082) .057 (.839)
Girls R2=.05; P=.089 -.108 (.664) -.013 (.964) -.185 (.480) -.105 (.664) .214 (.442)
Total R2=.04; P=.655 -.144 (.322) -.001 (.995) -.086 (.557) -.182 (.215) .083 (.655)
Agility
Boys R2=.32; P=.001 .091 (.565) -.060 (.796) -.087 (.590) .080 (.619) -.539 (.026)
Girls R2=.38; P=.0005 -.003 (.988) .092 (.706) -.109 (.638) -.111 (.605) -.481 (.060)
Total R2=.25; P=.0005 .062 (.607) .007 (.964) -.089 (.464) .008 (.944) -.531 (.001)
Speed at sec-onds
Boys R2=.40; P=.0005 .107 (.538) .018 (.944) -.003 (.986) -.003 (.986) -.584 (.028)
Girls R2=.34; P=.0005 .149 (.440) .090 (.672) -.087 (.667) .289 (.131) -.616 (.008)
Total R2=.38; P=.0005 .141 (.229) .063 (.671) -.034 (.773) .237 (.046) -.637 (.001)
Speed at meters per seconds
Boys R2=.41; P=.0005 -.076 (.642) -.062 (.796) .001 (.997) -.002 (.988) .679 (.008)
Girls R2=.46; P=.0005 -.156 (.382) -.083 (.675) .069 (.712) -.274 (.123) .691 (.002)
Total R2=.47; P=.0005 -.124 (.259) -.083 (.547) .026 (.816) -.218 (.050) .716 (.001)
Handgrip strength in children Matsudo et al.
DISCUSSION
Our preliminary results seem to demonstrate an important role of handgrip strength to predict physical itness variables. he strength of the association between handgrip strength and physical itness ranged from 20% (vertical jump test: R2=0.20; P=.001) to 47% (speed in meters per second: R2=.47;
P=.001). hese results support the idea that handgrip strength is consistently
associated with several distinct parameters of physical itness, regardless of age, gender or sexual maturation, suggesting that handgrip strength could be a highly accurate, independent predictor of physical itness.
herefore, handgrip strength should be included as a component of the multidimensional health evaluation of children and adolescents. Most possibly, through population-based reference values of handgrip strength based on physical size and body composition1-3, clinicians could
detect earlier low levels of physical itness in order to prevent future health problems1-7,12,13. However, certainly, handgrip strength should not be used
in isolation, especially in a clinical setting, where other markers (lipid proile, electrocardiography indings, etc.) have considerable predictive power. In this ways, there are some studies corroborating our hypothesis in which handgrip strength could also be used as a predictive factor for health outcomes in a clinical context for children19,20, adults11,13, elderly
individuals12,16,17, as well as for individuals living with HIV/aids18.
Moreover, handgrip strength should also be employed for identifying potentially talented athletes8-10 and our results possibly suggest an
im-portant predictor factor for physical performance. Most recently, it was demonstrated that handgrip strength was signiicantly correlated with swimming performance (R=.78) in national-level Portuguese swimmers in the four competitive swimming strokes9. Other study also showed that
handgrip strength is signiicantly correlated (R=-.67) with tennis perfor-mance in 12 male aged 13.6 ± 1.4 years10. Adult handgrip strength may
also be predicted by an elevated accuracy from childhood and adolescent data in individuals with a normal maturational distribution21. In skeweed
distribution, it is possible that stature and mass could be produce a certain bias level22.23.
muscle strength during childhood or adolescence22,23.
CONCLUSIONS
In conclusion, our results support the idea that handgrip strength is con-sistently associated with several distinct parameters of physical itness, regardless of age, gender or sexual maturation, suggesting that handgrip strength could be a highly accurate, independent predictor of physical itness. herefore, handgrip strength should be included as a component of the multidimensional health evaluation of children and adolescents in school and clinical settings.
REFERENCES
1. Marrodán Serrano MD, Romero Collazos JF, Moreno Romero S, Mesa Santurino MS, Cabañas Armesilla MD, Pacheco Del Cerro JL, et al.. Handgrip strength in children and teenagers aged from 6 to 18 years: references values and relationship with size and body composition. An Pediatr 2009;70(4):340-8.
2. Ara I, Sanchez-Villegas A, Vicente-Rodrigues G, Moreno LA, Leiva MT, Martinez-Gonzalez MA, et al. Physical itness and obesity are associated in a dose-dependent manner in children. Ann Nutr Metab 2010;57(3-4):251-9.
3. Moliner-Urdiales D, Ruiz JR, Vicente-Rodrigues G, Ortega FB, Rey-Lopez JP, Espana-Romero V, et al. Association of muscular and cardiorespiratory itness with total and central body fat in adolescents: the HELENA study. Br J Sports Med 2011;45(2):101-8.
4. Andersen LB, Bugge A, Dencker M, Eiberg S, El-Nannman B. he association be-tween physical activity, physical itness and development of metabolic disorders. Int J Pediatr Obes 2011;6(Suppl 1):29-34.
5. Suriano K, Curran J, Byren SM, Jones TW, Davis EA. Fatness, itness, and increased cardiovascular risk in young children. J Pediatr 2010;157(4):552-8.
6. Fedewa Al, Ahn S. he efects of physical activity and physical itness on chil-dren’s achievement and cognitive outcomes: A meta-analysis. Res Q Exerc Sport 2011;82(3):521-35.
7. Chaddock L, Erickson KI, Prakash RS, Kim JS, Voss MW, VanPatter M, et al. A neuroimaging investigation of the association between aerobic itness, hip-pocampal volume, and memory performance in preadolescent children. Brain Res 2010;28(1358):172-83.
8. Visnapuu M, Jurimue T. Handgrip strength and hand dimension in young handball and basketball players. J Strength Cond Res 2007;21(3):923-9.
9. Garrido ND, Silva AJ, Fernandes RJ, Barbosa TM, Costa AM, Marinho DA, et al. High level swimming performance and its relation to non-speciic parameters: a cross-sectional study on maximum handgrip isometric strength. Percept Mot Skills 2012;114(3):936-48.
10. Girard O, Millet GP. Physical determinants of tennis performance in competitive teenage players. J Strength Cond Res 2009;23(6):1867-72.
11. Ortega FB, Silventoinen K, Tynelius P, RTasmussen F. Muscular strength in male adolescents and premature death. Cohort study of one million participants. BMJ 2012;20(345):e7279.
Handgrip strength in children Matsudo et al.
Corresponding author
Vagner Raso
School of Medicine of the University of Western Sao Paulo
700 José Bongiovani - 19050-900 - Presidente Prudente, SP, Brazil E-mail: [email protected]
13. Mahalakshmi VN, Ananthakrishnan N, Kate V, Sahai A, Trakroo M. Handgrip strength and endurance as a predictor of postoperative morbidity in surgical pa-tients: Can it serve as a simple bedside test? Int Surg 2004;89(2):115-21.
14. Ruiz JR, Castro-Piñero J, España-Romero V, Artero EG, Ortega FB, Cuenca MM, et al.. Field-based itness assessment in young people: the ALPHA health-related itness test battery for children and adolescents. Br J Sports Med 2011;45(6):518-24. 15. Fjortot I, Pedersen AV, Sigmundsson H, Verijken B. Measuring physical itness in
children who are 5 to 12 years old with a test battery that is functional and easy to administer. Phys her 2011;91(7):1087-95.
16. Franke WD, Margrett JA, Martin P. Handgrip strength, positive afect, and per-ceived health are prospectively associated with fewer functional limitations among centenarians. Int J Aging Hum Dev 2012;75(4):351-63.
17. Taekema DG, Ling CH, Kurrle SE, Cameron ID, Meskers CG, Blauw GJ, et al. Temporal relationship between handgrip strength and cognitive performance in oldest old people. Age Ageing 2012;41(4):506-12
18. Raso V, Shephard RJ, Rosário Casseb JS, Silva Duarte AJ, D’Andréa Greve JM. Handgrip force ofers a measure of physical function in individuals living with HIV/AIDS. J Acquir Immune Deic Syndr 2013;63(1):e30-2.
19. Jiménez-Pavón D, Ortega FB, Valtueña J, Castro-Piñero J, Gómez-Martínez S, Zac-caria M, et al. Muscular strength and markers of insulin resistance in European adolescents: the HELENA Study. Eur J Appl Physiol 2012;112(7):2455-65. 20. Artero EG, Ruiz JR, Ortega FB, España-Romero V, Vicente-Rodríguez G, Molnar D,
et al. Muscular and cardiorespiratory itness are independently associated with met-abolic risk in adolescents: the HELENA study. Pediatr Diabetes 2011;12(8):704-12. 21. Taeymans J, Clarys P, Abidi H, Hebbelinck M, Duquet W. Developmental changes
and predictability of static strength in individuals of diferent maturity: a 30-year longitudinal study. J Sports Sci 2009;27(8):833-41.
22. Tonson A, Ratel S, Le Fur Y, Cozzone P, Bendahan D. Efect of maturation on the relationship between muscle size and force production. Med Sci Sports Exerc 2008;40(5):918-25.
23. De Ste Croix MB, Armstrong N, Welsman JR, Sharpe P. Longitudinal changes in isokinetic leg strength in 10-14-year-olds. Ann Hum Biol 2002;29(1):50-62. 24. de Onis M, Onyango AW, Borghi E, Siyam A., Nishida C, Siekmann J. Development
of a WHO growth reference for school-aged children and adolescents. Bull World Health Organ. 2007;85(9):660-7.
25. American Alliance for Health Physical Education and Recreation. Youth Fitness Test Manual. Washington: AAHPER Publications; 1976.
26. Frisancho AR. New norms of upper limb fat and muscle areas for assessment of nutritional status. Am J Clin Nutr. 1981;34(11):2540-5.
27. Matsudo SMM, Matsudo VKR. Self-assessment and physician assessment of sexual-maturation in Brazilian boys and girls – concordance and reproducibility. Am J Hum Biol 1994;6:451-5.
28. Craig CL, Marshall AL, Sjöström M, Bauman AE, Booth ML, Ainsworth BE, et al. International physical activity questionnaire: 12-country reliability and validity. Med Sci Sports Exerc 2003;35(8):1381-95.
29. Astrand PO, Rhyming I. A nomogram for calculation of aerobic capacity (physical itness) from pulses rate during submaximal work. J Appl Physiol 1954;7(2):218-21. 30. Wells KF, Dillon EI. he sit and reach a test of bank and leg flexibility. Res Q Exerc