DOI: http://dx.doi.org/10.5007/1980-0037.2015v17n1p51
original article
Licence Creative Commom CC
RBCDH
1 Opole University of Technology. Faculty of Physical Education and Physiotherapy. Opole, Poland. 2 Academy of Physical Education. Katowice, Poland
Received: 05 November 2013 Accepted: 21 july 2014
Spatio-temporal characteristics of hurdle
runs and ergometric tests during athletic
preparation
Características espaço-temporais de corridas com
obstáculo e testes ergométricos durante a preparação no
atletismo
Janusz Iskra1
Rafał Tataruch1
Zbigniew Borysiuk1
Ewa Sadowska-Krępa2
Anna Walaszczyk2
Abstract– he main goal of this study was to assess the appropriateness of both ergometric and modiied hurdles tests for an annual cycle of hurdlers who were working on mastering the 400 m distance. Nine Polish hurdlers (personal best: 54.46±2.16 s, age: 20.67±1.87 years) were chosen as the research participants. In each of two mastering periods in the research, an ergometric test and a speciic test were implemented during a hurdle run. In February, an interval ergometric test (5×6 s) and an interval hurdle test (IHT) were performed. Additionally, in May, a classic Wingate test and a 200 m hurdle run were in-troduced. With regard to the ergometric tests, we assessed the following measurements: maximum power (Pmax) and mean power (P×) reached in ive repetitions as well as total work (Wtotal) performed in ive attempts. he Mann-Whitney test was used to distinguish between the athletic test results obtained in the preparation period outlined above and those obtained in the irst period. Lactate (LA) concentrations were assessed with the Chi-square test. Moreover, Spearman’s rank correlation coeicients were used in the analysis. he achieved study results indicate the lack of signiicant diferentiation of the ergometric test parameters (p≥ 0.05). he spatial structure of both speciic tests (5×2 H v. 200 m H) was similar given that the irst and the second parts of both hurdle races and the number of steps taken were similar. he basic parameters of the ergometric tests did not exhibit any relationship with the recommended record time achieved for the 400 m hurdle run.
Key words: Athletic training; Ergometric tests; Hurdle run.
INTRODUCTION
he 400 m hurdle race is one of the few athletic events that exclusively takes place in a stadium. Training and competing in a stadium is possible for only half of the training year (from April to September) in the majority of European countries. Autumn and winter training for the 400 m hurdle race takes place indoors.
he climate and speciic nature of this track event force coaches to identify appropriate exercises and organize proper and reliable control systems. he forms and methods of indoor training for 400 m hurdlers
are presented in works including those by McFarlane1 and Iskra and Coh2.
On the basis of proven training concepts, coaches utilize a small num-ber of special test models that employ interval hurdle runs: ‘shuttle runs’
or ‘turnabouts’1.
In the winter, an athlete is oten not prepared to run hurdles at maxi-mum (testing) speed. In this period, ergometric tests are a form of labora-tory test that assesses preparation based on glycolytic changes. Apart from the classic Wingate test, other interval tests using an ergometer are also
pos-sible3-5. he eicacy of their use has been assessed in previous publications6.
he objective of this article was to evaluate the possible uses for er-gometric tests during hurdlers’ annual cycle of preparation for the 400 m race. he following research questions were asked:
1) Is it reasonable to use ergometric tests to assess hurdlers who are
train-ing for the 400 m race?
2) Is it useful to replace interval tests (runs and ergometric tests) with
continuous tests?
3) Which of the tests exhibit the strongest relationship with hurdlers’
athletic abilities?
METHODOLOGICAL PROCEDURES
Material
he research participants were nine Polish hurdlers who specialized in the 400 m hurdle (personal best 54.46±2.16 s, age 20.67±1.78, stature 179.89±3.72 cm, body mass 74.69±5.72 kg). he group included one par-ticipant in the Olympic Games (2012 London) and two representatives of Poland in junior age categories. he study was approved by the Opole Bioethics Committee (Decision/131 November 2005).
Methods
he hurdlers’ exercise capacity was evaluated using speciic tests (2 hurdle runs) and non-speciic tests (two ergometric tests).
In the GPP, interval-based tests (an interval hurdle test [IHT] and an interval ergometric test [5 × 6 s]) were conducted.
In the SPP, a 200 m hurdle run and a classic (Wingate) ergometric test were conducted.
Characteristics of tests
• Interval hurdle run/test (IHT)
For a shuttle run, an athlete covers ive times the distance of 35 m with two hurdles at a height of 91 cm. For this study, the distance from the start line to the irst hurdle and from the second hurdle to the inish line was 8.75 m, and the distance between hurdles was 17.5 m. Each break between repetitions was the diference between 30 s and the time required to run the given distance; on average, the athletes had approximately 24 s of rest. he run times were measured using photocells. he runs took place on an indoor athletic track.
he following parameters were used in the work:
• time of the run (at the end of 5 sections);
• times of the irst and second parts of the run (sections 1 + 2 and 4 +
5, respectively);
• number of steps taken between hurdles;
• number of steps in the irst (distances no. 1 and 2) and second parts
(distances no. 4 and 5) of the run;
• lactate concentration ater the efort (LAIHT).
he run was organized on the basis of previous works1,6-8 and included
the authors’ modiications concerning the aims of the work.
• Interval ergometric test (5 × 6 s)
he test was performed using a Monark 894E ergometer in accordance with
the rules speciied by Fitzsimans et al.4 and accepted by sport authorities5.
Athletes performed for 6 s of maximum efort 5 times with a 24 s interval between repetitions. he following parameters were used in the analysis:
• total work performed for 5 eforts (Wtotal);
• maximum power (mean of ive repetitions, Pmax);
• mean power (mean of ive repetitions, Px);
• lactate concentration ater the efort (LA5x6s; measured 4 min. ater
the efort).
• 200 m hurdle run (200H Run)
period of preparation and the speciic nature of the 400 m hurdle race.
Similar run parameters were presented in previous publications1,8. he
following parameters were used in the work:
• time of the 200H Run (t200H);
• time of the irst (hurdles no. 1–5) and second (hurdles no. 6–10) parts
of the run (t1-5H, t6-10H, respectively);
• number of steps taken between hurdles (n);
• number of steps in the irst and second parts of the run (n1-5H, n6-10H,
respectively)
• lactate concentration in blood (LA200H).
• 30 s ergometric (Wingate) test
he Wingate anaerobic capacity test with a duration of 30 s was performed using a Monark 894E ergometer with MCE v.5.1 sotware. he test was
performed according to the standard procedure9.
he following parameters were used in the analysis:
• total work (Wtotal);
• average and maximum power (Px, Pmax);
• lactate concentration 4 min. ater the efort (LAWingate);
In the inal analysis, we used the personal best results in 400 m hurdle competitions (between July and August).
Analytical procedure
Fasting blood samples were collected 5 minutes ater the efort. Blood plasma was separated according to routine procedures and either processed
immediately or maintained at -80o C until the analysis.
Plasma lactate (LA) concentrations were measured using the methods
of Shimojo et al.10 with commercially available kits (BioMérieux).
Statistical analysis
he data are presented as means, standard deviations (SD), maximums (Max) and minimums (Min). Diferences between the groups were identi-ied using the non-parametric Wilcoxon Z test. Diferences between LA concentrations in the 4 types of efort were assessed using the Friedman ANOVA test. he signiicance level was set at p≤0.05. In addition, Spear-man’s rank order correlation coeicients were computed to demonstrate the relationships between the variables. All statistical analyses were performed using Statistica 6.0 (StatSot, Inc.) sotware.
RESULTS
Selected ergometric test parameters (5 × 6 s and 30 s/Wingate) are
he results of the Wilcoxon Z test demonstrate the lack of statistically important diferences between the total work, average power and maximum power achieved in both tests organized by training period.
Table 1. Primary parameters of the ergometric test.
Test Parameter
± SD Min.-Max. Wilcoxon test (Z) 5 × 6 s W (J/kg) 262.10 ± 15.01 238.2 - 278.7 0.67 (p=0.50) Wingate W (J/kg) 270.00 ± 17.16 245.50 - 290.8
5 × 6 s P (W/kg) 8.74 ± 0.50 7.94 - 9.29 0.67 (p=0.50) Wingate 9.00 ± 0.57 8.18 - 9.69
5 × 6 s Pmax (W/kg) 11.36 ± 0.38 10.64 - 11.89 1.33 (p=0.18) Wingate 11.80 ± 0.77 10.71 – 12.59
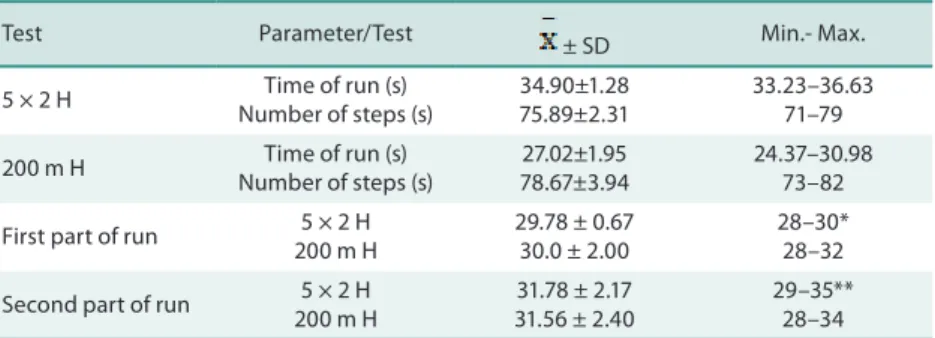
he results of the hurdle run tests and the numbers of steps in the
irst and second parts of the run are presented in Table 2. No signiicant
relationships were observed between the numbers of steps in the two parts of the runs performed in February and in May (p ≥ 0.05).
Table 2. Results of the hurdle run tests and numbers of steps in the two parts of the run tests.
Test Parameter/Test ± SD Min.- Max. 5 × 2 H Time of run (s)
Number of steps (s)
34.90±1.28 75.89±2.31
33.23–36.63 71–79 200 m H Time of run (s)
Number of steps (s)
27.02±1.95 78.67±3.94
24.37–30.98 73–82 First part of run 5 × 2 H
200 m H
29.78 ± 0.67 30.0 ± 2.00
28–30* 28–32 Second part of run 5 × 2 H
200 m H
31.78 ± 2.17 31.56 ± 2.40
29–35** 28–34
Wilcoxon test (Z): * 0.34 (p=0.73); ** 0.42 (p=0.67)
he lactate concentration (LA) levels ater the tests are presented in
Table 3. Statistically signiicant diferences were observed with the Chi-square test (9.66, p=0.0216).
he correlation coeicients between selected parameters of the 4 tests
and the 400 m run are presented in Table 4. he work and power measured
by the ergometric tests had no signiicant association with the hurdlers’ athletic abilities. Statistically important relationships were observed with regard to 3 of the run tests performed in 3 training periods.
he LA values for all the tests are presented in Table 5. Signiicant
Table 3. Lactate concentration results from the 4 tests (in mmol/l).
Test ± SD Min.-Max. Freidman ANOVA 5 × 6 s 13.36 ± 1.26 10.83–14.78
Chi square=9.66, p=0.0216 5 × 2 H 13.10 ± 0.81 11.90–14.45
Wingate (30 s) 13.73 ± 1.19 10.85–14.68 200 m H 13.87 ± 0.92 11.66–14.67
Table 4. Spearman’s rank correlation coeicients between the run tests and selected parameters.
Test Parameter 400 m H (s) 5 x 2 H (s) 200 m H (s) 400 m H Personal best - 0.90* 0.95*
5 × 6 s Total work Average power
- 0.16 - 0.18
- 0.25 - 0.25
- 0.27 - 0.27 Wingate 30 s Total work
Average power
- 0.14 - 0.31
- 0.03 - 0.29
0.03 - 0.25 5 × 2 H Time of run
Number of steps
0.90*
0.55
-0.55
0.88*
0.41 200 m H Time of run
Number of steps
0.95*
0.50
0.88*
0.93*
-0.96*
*p≤0.01
Table 5. Spearman’s rank correlation coeicients of the LA concentrations in various 400 m hurdle run tests.
No. Test 1 2 3 4
1. 5 × 6 s - 0.17 0.18 0.02 2. 30 s Wingate 0.17 - 0.50 0.37 3. 5 × 2 H 0.18 0.50 - 0.85*
4. 200 m H 0.02 0.37 0.85*
-*p≤0.01
DISCUSSION
he efort in the 400 m hurdle race is based on anaerobic lactic acid
changes11. he research performed in sprint runners suggests that
anaero-bic processes range from 55% to 87% during the Wingate ergometric test. Most authors believe there is a relationship between lactate concentration
and the maximum power measured by the Wingate test12. he relevance
of ergometric tests to sport was conirmed in numerous publications13-17.
Previous research performed among top Polish hurdlers at 110 m and 400 m demonstrated a signiicant relationship among maximum power and total work and hurdlers’ athletic abilities. With regard to 400 m hurdlers,
these values were r=-0.49 and -0.61 (p≤0.01), respectively18.
form of special training1,6,19. Together with non-speciic (ergometric) tests, interval hurdle runs can be an important part of the training for 400 m
hurdlers1,8.
he analysis of the ergometric test results (Wingate and 5 × 6 s tests)
did not reveal any diferences with regard to total work (Wtotal) or power
(average power and maximum power; P and Pmax). he results achieved
by the group studied do not difer from the results achieved by the hurdlers who participated in the research, and the results difer only slightly from
the results of research on the Polish 400 m hurdle team 2,18.
he Wingate test yielded the following results: Wtotal: 281.5±17.6 (J/kg)
and 270.0±17.1, and Pmax 11.7±0.8 and 11.8±0.8 W/kg. he hurdlers’ high
anaerobic capacity was conirmed using the results of research performed
by other authors14,15.
he lack of diferences in the basic ergometric test (Wingate and 5 × 6 s) parameters is an important piece of information with regard to the complementary nature of non-speciic hurdler preparation tests.
Run tests that are strictly connected with the preparation period are another example of an attempt to identify speciic (=hurdles) preparation
control tests that are relevant to the event (400 m H)7,8,18,20.
he standardized conditions in which the test was performed make it possible to compare the run times in the irst and second parts of the distance. In both cases, no statistically important diferences were noted (Table 2). his serves to indicate the proper choice of tests and the continuity of annually controlling the preparation of 400 m hurdlers.
However, the most important aim of this research was to evaluate the simultaneous use of speciic (run) and ergometric tests. his concerned both single eforts (200 m H, Wingate test) and interval-based eforts (5 × 2 H run, 5 × 6 s test).
One criterion for evaluating anaerobic efort is evaluating post-efort
concentrations of lactate in the blood (LAmax). Denis et al.21 and Granier
et al.12 reported a signiicant correlation between peak power during the
Wingate test and maximum lactate concentration (0.87 and 0.75, respec-tively). he research conducted among top Polish hurdlers from 1994 to 2000 demonstrated that lactate concentrations during run tests performed
in the preparation period were 14.95±0.59 mmol/l (per 300 m)22.
he maximum lactate concentrations ater sprinters’ and hurdlers’
starting eforts were slightly higher (from 16 to greater than 20 mmol/l)23,24.
However, in the research conducted by Hautier et al.25 using a group of top
Cameroonian sprinters, the post-efort LA concentration ater a 200 m run was only 10.3 mmol/l.
In the research conducted by Hill26 using 400 m runners (university
level), the lactate concentrations obtained were similar to those obtained for the group of runners in this study (14.7±2.2 mmol/l). he study by
Klapcinska et al.22 assessed only Polish 400 m national hurdlers, whereas
the research by Hill26 evaluated only medium-class runners. his may
In this study, the post-efort lactate concentrations were 13.10-13.87 mmol/l and exhibited important signiicant diferences (Chi-square=9.66, p=0.0216). High LA values, which relect the efort exerted in prolonged sprints, and the lack of signiicant diferences suggest that these tests are ideal anaerobic tests for training 400 m hurdlers.
Further analysis concerned the relationships between selected test parameters and the hurdlers’ athletic abilities (personal bests in the year preceding the tests).
Signiicant correlation coeicients (p≤0.01) were noted for only the times of the 200 m hurdle run and the 5 × 2H interval run (r=0.95 and r=0.90, respectively). A direct relationship was lacking between the ergo-metric test parameters and the primary parameters (number of steps and
time of run) of the hurdle run (Table 4). For the training control process, a
signiicant relationship between the times of hurdle runs performed during the general preparation period (5 × 2H) and during the period preceding competitions was noted (200 m H, r=0.88, p≤0.01).
he diferences between the event-speciic (hurdle runs) and non-spe-ciic tests (ergometric tests) were emphasized by the Spearman’s correlation analyses of all of the post-efort LA values. A statistically signiicant
rela-tionship (r=0.85, p≤0.01) was noted only between two hurdle runs (Table 5).
CONCLUSIONS
he simultaneous use of run tests and ergometric tests in the control of 400 m hurdler preparation is reasonable, but some minor limitations should be noted. Ergometric tests and hurdle runs require similar anaerobic efort; however, the non-speciic nature of movement is an obstacle to the clear prediction of 400 m hurdle race results.
Ergometric and run test parameters were assessed using the continu-ous method (the Wingate test and the 200 m hurdle run, respectively) and the interval method (the 5 × 6 s test and the 5 × 2H run, respectively), indicating a high degree of similarity between the aforementioned eforts.
No apparent diferences were noted between the primary test param-eters (total work and maximum power) for both the ergometric tests as well as the run tests (there were similar times for the irst and second parts of the distance in both hurdle runs).
he prediction of 400 m hurdle race results can be based exclusively on hurdle run results.
his study revealed that winter training sessions for the 400 m hurdles are (in typical European conditions) complicated. Coaches must change the typical forms of training (runs on the outdoor tracks) or atypical eforts (interval runs and ergometric tests).
Our analysis revealed that we can compare only both running tests and (separately) both ergometric tests. In the search for correlations between running tests and unspeciic (according to hurdle runs) ergometric eforts, coaches should be careful.
A special preparation process that is typical for the event concerned can be evaluated on the basis of elaborated continuous (200 m H) and interval run tests (5 × 2H). here is a high degree of correlation between 400 m hurdle run times and the results of these tests given that the durations were similar to those in competition conditions in all training periods (winter, spring). Ergometric tests are a useful part of the preparation process with regard to anaerobic capacity.
REFERENCES
1. McFarlane B. he science of hurdling and speed. Toronto: Athletics Canada; 2000. 2. Iskra J, Coh M. Biomechanical studies on running the 400 m hurdles. Hum Mov
2011;12(4):315-23.
3. Dawson BT, Fitzsimons M, Ward D. he relationships of repeated sprint ability to aerobic power and performance measures of anaerobic work capacity and power. Aust J Sci Med Sport 1993;25(4):88-93.
4. Fitzsimons M, Dawson B, Ward D, Wilkinson A. Cycling and running tests of repeated sprint ability. Aust J Sci Med Sport 1993;25(4):82-4.
5. Gore CJ. Physiological tests for elite athletes. Champaign: Human Kinetics Books; 2000.
6. Warburton D. he 400 m hurdles – the development of efective technique. Ath Coach 1985;9:21-25.
7. Röll B. Eine Untersuchung des 400-m-Hürdenlaufes der Frauen. Leistungssport 1976;2:116-24.
8. Reibert W. Introduction of the 300 m hurdles event for girls. In: Jarver J, editor. he hurdles. Contemporary theory, technique and training, 3rd ed. Mountain View: Tafnews Press, 1997; p. 44-47.
9. Inbar O, Bar-Or O, Sinner JS. he Wingate anaerobic test. Champaign, Ill.: Human Kinetics Publishing House Books; 1996.
10. Shimojo N, Naka K, Nakajima C, Yoshikawa C, Okuda K, Okada K. Test-strip method for measuring lactate in whole blood. Clin Chem 1989;35(9):1992-4. 11. Ward-Smith AJ. A mathematical analysis of the bioenergetics of hurdling. J Sports
Sci 1997;15(5):517-26.
12. Granier P, Mercier B, Mercier J, Anselme F, Préfaut C. Aerobic and anaerobic contribution to Wingate test performance in sprint and middle-distance runners. Eur J Appl Physiol Occup Physiol 1995;70(1):58-65.
13. harp GD, Newhouse RK, Ufelman L, horland WG, Johnson GO. Comparison of sprint and run times with performance on the Wingate anaerobic test. Res Q Exerc Sport 1985;56(1):73-6.
14. Bouchard C, Taylor AW, Simoneau J-A, Dulac S. Testing anaerobic power and capacity. In: MacDougall JD, Wenger HA, Green HJ, editors. Physiological testing of the high-performance athlete. Champaign: Human Kinetics Publishing House Books; 1991. p. 175-222.
15. harp GD, Johnson GO, horland WG. Measurement of anaerobic power and capacity in elite young track athletes using the Wingate test. J Sports Med Phys Fitness 1984;24(2):100-6.
16. Borrie A, Bradburn D. A correlation of two anaerobic power tests and three sprint performance tests. J Sports Sci 1995;1:19-21.
30- and a 45-s Wingate test. Eur J Appl Physiol Occup Physiol 1997;76(4):308-13. doi: 10.1007/s004210050253.
18. Iskra J, Zając A, Waśkiewicz Z. Laboratory and ield tests in evaluation of anaerobic itness in elite hurdlers. J Hum Kinetics 2006;16(25):25-38.
19. Iskra J. Athlete typology and training strategy in the 400 m hurdles. New Stud Athlet 2012;1-2:27-40.
20. McFarlane B. An advanced “race medal” for 400 m hurdles. Track Field Q Rev 1993;1:47-8.
21. Denis C, Linossier MT. Power and metabolic responses during supramaximal exercise in 100 m and 800 m runners. Scand J Med Sci Sport 1992;2(2):62-9. 22. Klapcińska B, Iskra J, Poprzecki S, Grzesiok K. he efects of sprint (300 m) running
on plasma lactate, uric acid, creatine kinase and lactate dehydrogenase in com-petitive hurdlers and untrained men. J Sports Med Phys Fitness 2001;41(3):306-11. 23. Ohkuwa T, Saito M, Miyamura M. Plasma LDH and CK activities ater 400
m sprinting by well-trained sprint runners. Eur J Appl Physiol Occup Physiol 1984;52(3):296-9.
24. Locatelli E. he importance of anaerobic glicolysis and stifness in the sprints (60, 100 and 200 metres). New Stud Athlet 1996;2-3:121-5.
25. Hautier CA, Wouassi D, Arsac LM, Bitanga E, hiriet P, Lacour JR. Relationships between postcompetition blood lactate concentration and average running velocity over 100-m and 200-m races. Europ J Appl Physiol 1994;68(6):508-13.
26. Hill DW. Energy system contributions in middle-distance running events. J Sports Sci 1999;17(6):477-83.
27. McFarlane B. he science of hurdling and speed. Toronto: Athletics Canada; 2000. 28. Iskra J, Coh M. Biomechanical studies on running the 400 m hurdles. Hum Mov
2011;12(4):315-23.
29. Dawson BT, Fitzsimons M, Ward D. he relationships of repeated sprint ability to aerobic power and performance measures of anaerobic work capacity and power. Aust J Sci Med Sport 1993;25(4):88-93.
30. Fitzsimons M, Dawson B, Ward D, Wilkinson A. Cycling and running tests of repeated sprint ability. Aust J Sci Med Sport 1993;25(4):82-4.
31. Gore CJ. Physiological tests for elite athletes. Champaign: Human Kinetics Books; 2000.
32. Warburton D. he 400 m hurdles – the development of efective technique. Ath Coach 1985;9:21-25.
33. Röll B. Eine Untersuchung des 400-m-Hürdenlaufes der Frauen. Leistungssport 1976;2:116-24.
34. Reibert W. Introduction of the 300 m hurdles event for girls. In: Jarver J, editor. he hurdles. Contemporary theory, technique and training, 3rd ed. Mountain View: Tafnews Press, 1997; p. 44-47.
35. Inbar O, Bar-Or O, Sinner JS. he Wingate anaerobic test. Champaign, Ill.: Human Kinetics Publishing House Books; 1996.
36. Shimojo N, Naka K, Nakajima C, Yoshikawa C, Okuda K, Okada K. Test-strip method for measuring lactate in whole blood. Clin Chem 1989;35(9):1992-4. 37. Ward-Smith AJ. A mathematical analysis of the bioenergetics of hurdling. J Sports
Sci 1997;15(5):517-26.
38. Granier P, Mercier B, Mercier J, Anselme F, Préfaut C. Aerobic and anaerobic contribution to Wingate test performance in sprint and middle-distance runners. Eur J Appl Physiol Occup Physiol 1995;70(1):58-65.
39. harp GD, Newhouse RK, Ufelman L, horland WG, Johnson GO. Comparison of sprint and run times with performance on the Wingate anaerobic test. Res Q Exerc Sport 1985;56(1):73-6.
Corresponding author
Zbigniew Borysiuk
Faculty of Physical Education and Physiotherapy
Opole University of Technology, st. Proszkowska
76, 45-758 Opole, Poland. E-mail: [email protected]
Books; 1991. p. 175-222.
41. harp GD, Johnson GO, horland WG. Measurement of anaerobic power and capacity in elite young track athletes using the Wingate test. J Sports Med Phys Fitness 1984;24(2):100-6.
42. Borrie A, Bradburn D. A correlation of two anaerobic power tests and three sprint performance tests. J Sports Sci 1995;1:19-21.
43. Calbet JAL, Chavarren J, Dorado C. Fractional use of anaerobic capacity during a 30- and a 45-s Wingate test. Eur J Appl Physiol Occup Physiol 1997;76(4):308-13. doi: 10.1007/s004210050253.
44. Iskra J, Zając A, Waśkiewicz Z. Laboratory and ield tests in evaluation of anaerobic itness in elite hurdlers. J Hum Kinetics 2006;16(25):25-38.
45. Iskra J. Athlete typology and training strategy in the 400 m hurdles. New Stud Athlet 2012;1-2:27-40.
46. McFarlane B. An advanced “race medal” for 400 m hurdles. Track Field Q Rev 1993;1:47-8.
47. Denis C, Linossier MT. Power and metabolic responses during supramaximal exercise in 100 m and 800 m runners. Scand J Med Sci Sport 1992;2(2):62-9. 48. Klapcińska B, Iskra J, Poprzecki S, Grzesiok K. he efects of sprint (300 m) running
on plasma lactate, uric acid, creatine kinase and lactate dehydrogenase in com-petitive hurdlers and untrained men. J Sports Med Phys Fitness 2001;41(3):306-11. 49. Ohkuwa T, Saito M, Miyamura M. Plasma LDH and CK activities ater 400
m sprinting by well-trained sprint runners. Eur J Appl Physiol Occup Physiol 1984;52(3):296-9.
50. Locatelli E. he importance of anaerobic glicolysis and stifness in the sprints (60, 100 and 200 metres). New Stud Athlet 1996;2-3:121-5.
51. Hautier CA, Wouassi D, Arsac LM, Bitanga E, hiriet P, Lacour JR. Relationships between postcompetition blood lactate concentration and average running velocity over 100-m and 200-m races. Europ J Appl Physiol 1994;68(6):508-13.