DOI: http://dx.doi.org/10.5007/1980-0037.2013v15n6p715
original article
RBCDH
Licence Creative Commom
CC
1 Universidade Federal de Mato Grosso do Sul. Laboratório de Pes-quisa em Fisiologia do Exercício. Centro de Ciências Humanas e Sociais. Campo Grande, MS. Brasil.
2 Universidade Estadual Paulista. Departamento de Educação Física. Bauru, SP. Brasil.
Received: 17 December 2012 Accepted: 30 April 2013
Inluence of the selection from incremental
stages on lactate minimum intensity: a
pilot study
Inluência da seleção dos estágios incrementais sobre a
intensidade de lactato mínimo: estudo piloto
Willian Eiji Miyagi1
Jorge Vieira de Mello Leite1
Alessandro Moura Zagatto1,2
Abstract– he purposes of this study were to assess the inluence of stage selection from the incremental phase and the use of peak lactate ater hyperlactatemia induction on the determination of the lactate minimum intensity (iLACmin). Twelve moderately active university students (23±5 years, 78.3±14.1 kg, 175.3±5.1 cm) performed a maximal in-cremental test to determine the respiratory compensation point (RCP) (initial intensity at 70 W and increments of 17.5 W every 2 minutes) and a lactate minimum test (induction with the Wingate test, the incremental test started at 30 W below RCP with increments of 10 W every 3 minutes) on a cycle ergometer. he iLACmin was determined using second order polynomial adjustment applying ive exercise stage selection: 1) using all stages (iL-ACminP); 2) using all stages below and two stages above iLACminP (iLACminA); 3) using two stages below and all stages above iLACminP (iLACminB); 4) using the largest and same possible number of stages below and above the iLACminP (iLACminI); 5) using all stages and peak lactate ater hyperlactatemia induction (iLACminD). No diferences were found between the iLACminP (138.2±30.2 W), iLACminA (139.1±29.1 W), iLACminB (135.3±14.2 W), iLACminI (138.6±20.5 W) and iLACmiD (136.7±28.5 W) protocols, and a high level
of agreement between these intensities and iLACminP was observed. Oxygen uptake,
heart rate, rating of perceived exertion and lactate corresponding to these intensities was not diferent and was strongly correlated. However, the iLACminB presented the lowest success rate (66.7%). In conclusion, stage selection did not inluence the determination of iLACmin but modiied the success rate.
Key words: Aerobic capacity; Lactate-intensity relationship; Lactatemia; Mathematical model.
INTRODUCTION
he lactate minimum (LACmin) test, as well as individual anaerobic
thresh-old1, anaerobic threshold2, respiratory compensation point3 and others4,
have been shown to be reproducible5-7, valid8-10 and reliable11-13 for estimating
maximal lactate steady state intensity (iMLSS), which is considered as the gold standard procedure in the evaluation of aerobic capacity. he LACmin consists of an efort to induce hyperlactatemia followed by an incremental test and it has advantages over other protocols that aim to estimate the
iMLSS, for example by not using ixed lactate values, such as the 4 mmol•L-1
proposed by Heck et al.2. In addition, during the LACmin test, it is possible
to assess aerobic (aerobic capacity) and anaerobic (anaerobic power and
capacity) parameters in only one experimental session14-16.
Blood lactate concentrations ([lac]) measured during the incremental phase of the LACmin test have a U-shaped proile, which is the lactate minimum intensity (iLACmin), corresponding to the lowest lactate value (minimum point); this is considered to be the highest workload, at which
a dynamic balance occurs between lactate production and removal7. he
minimum lactate point in the lactate-exercise intensity relationship for
iLACmin determination can be obtained visually17 or by mathematical
adjustments11,16,18.
he use of mathematical procedures enables better adjustments to the lactate-intensity relationship, increasing the accuracy of determining
iLACmin15. herefore, analysis of the lactate-intensity response can be
performed using a lower number of points (i.e., stages of exercise applied
at incremental phases of the LACmin test), reducing application time9,15,19.
However, in most studies, iLACmin determination is performed without detailed mathematical analysis of the adjustment applied to obtain the U-shaped it, such as the analysis of an accurate polynomial it. One of the few studies that did use this analysis was the study of De Araujo and
colleagues20, which suggested adding a success rate in polynomial model
application, only when considering values that had a determination
coef-icient (R2) greater than 0.80 in second order polynomial adjustment.
However, there is no consensus about the inluence of these distribution points on mathematical adjustments and in determining iLACmin. Sotero
et al.9 investigated the inluence of points selection on mathematical
adjust-ment. he authors determined the iLACmin in standard mode using all the points obtained during the incremental phase and then selecting only three
points (1st, 3rd and 5th points, 1st, 3rd and 6th points and 1st, 4th and 6th points).
they are all composed of the irst point, a point near the iLACmin and a point close to exhaustion.
Pardono et al.15 based the arrangement of points on the rating of
perceived exertion (RPE), determining the iLACmin with all the points obtained in the test and using three arrangements made up of three points each, which corresponded to the irst stage, RPE 13 point, RPE 16 point or RPE associated with the last stage of exercise, and adopting the three stages with the lowest lactate values. he iLACmin determined, using all points and the selection of three points including the last stage of exercise intensity, underestimated the iMLSS. However, the iLACmin determined by selecting three points including the value corresponding to RPE 16 was not statistically diferent from iMLSS.
herefore, the analysis of point arrangement in mathematical adjust-ment indicates that a shit may occur on the lactate-intensity curvature due to the location of these points, resulting in errors in iLACmin determina-tion. In general, six stages have been used at the incremental phase of the LACmin test, with the iLACmin identiied between the third and fourth
stages21. However, is it necessary to use a similar number of stages before
and ater the zero derivative (iLACmin)? What are the efects, on ILACmin determination using mathematical adjustments, of using fewer points (one or two) before or ater the derivative zero? It is believed that the iLACmin will not be dependent on the number of points, considering that the lactate-intensity behavior is adjusted by the mathematical function. However, the selection of diferent arrangements of these points could deface or shit the adjustment curvature, resulting in errors in the iLACmin determination.
herefore, the purposes of this study were to assess the utilization of diferent arrangements and numbers of stages from the incremental phase in second order polynomial adjustment, and to investigate the use of lactate peak value ater hyperlactatemia induction on the
determina-tion of iLACmin. Based on the results of Pardono et al.15, who investigated
the inluence of the number of points standardizing the intensities using RPE, our hypothesis is that point arrangement will not afect iLACmin determination, when applying one test with the intensities and increments selected by means of previously determined aerobic capacity.
METHODS
Participants
he sample was composed of twelve moderately active and healthy male students from the physical education course (recreational practitioners of futsal, volleyball, handball, running, cycling, in addition to physical ac-tivities realized in the undergraduate classes) and their characteristics are presented in Table 1. Highly trained individuals, smokers or people who had a musculoskeletal injury were not included in the study. he sample size was based on sample calculation taking into consideration the similarity
and a test power of 90% that resulted in a minimum sample size of eight participants (sotware G*Power 3.0.10, Franz Faul, Germany). All volunteers were informed about possible risks and beneits of experimental procedures and provided written informed consent prior to their participation in the study. All the procedures applied were approved by the Ethics Committee in Human Research of the Federal University of Mato Grosso do Sul (CAAE 0056.0.049.000-11) and were conducted in accordance with the Declaration of Helsinki. Subjects were instructed to refrain from strenuous exercise and to abstain from alcohol and cafeine for at least 24 hours before each test.
Experimental procedures
According to the experimental design of the study, during the irst visit, a maximal incremental test was applied on a mechanical braking cycle ergometer (Biotec 2100 CEFISE, Brazil) to determine the exercise intensity
associated with the respiratory compensation point (RCP)3,22, followed by
a LACmin test adapted from Tegtbur et al.11 on an electromagnetic cycle
ergometer (ErgoCycle 167, Ergo-Fit, Pirmasens, Germany) which was ap-plied ater approximately 48 hours. In both procedures a warm-up of ive minutes on a cycle ergometer at 70 W was standard, with the tests being started ive minutes ater the warm-up. .
During both tests, the oxygen uptake (VO2), carbon dioxide
produc-tion (VCO2) and pulmonary ventilation (VE) were measured
continu-ously, breath by breath, through a stationary gas analyzer True-One 2400 (ParvoMedics, East Sandy, Utah, USA). he gas analyzer was calibrated
immediately before each test using known sample gas (3.98% CO2 e 16.02%
O2, Air Gas Puritan Medical, USA) and the ventilometer was calibrated
using a three liter syringe (Hans Rudolf, Kansas City, Missouri, USA). Heart rate (HR) was measured by a transmitter belt (T31, Polar Electro, Kempele, Finland) and rating of perceived exertion (RPE) was measured
using the Borg scale 6-2023.
For the determination of [La-], blood samples were collected from the
ear lobe (25 µL) at the end of each stage and also 5 and 7 minutes ater each test, as well as ater the Wingate test, which was applied to induce hyper-lactatemia in the LACmin test. Blood was collected using a heparinized capillary and transferred to Eppendorf tubes containing 50 µL of sodium luoride (NaF) at 1%, being analyzed in an electrochemical lactimeter SPORT YSI 1500 (Yellow Springs Instruments, Ohio, USA)
Maximal incremental test
he test started with an intensity corresponding to 70 W, with increments of 17.5 W at each 2 minute stage of the exercise until voluntary exhaustion or until the inability of the individual to maintain a cadence of 70 revolu-tions per minute (rpm).
he intensity of exercise associated with RCP corresponded to the intensity at which there was a concomitant increase in both ventilatory
Lactate minimum test
he Wingate Test (Biotec 2100 CEFISE, Brazil) was applied to induce hy-perlactatemia with a load corresponding to 7.5% of the body mass. Ater eight minutes of passive recovery, the subjects performed an incremental test with an initial intensity corresponding to 30 W below at RCP intensity and staged increments of 10 W every 3 min until voluntary exhaustion.
he iLACmin corresponded to zero derivative of second order polyno-mial adjust, where only tests that showed a value of a> 0 and a determina-tion coeicient (R²)>0.80 were considered valid, as proposed by De Araujo
et al.20. he success rate was calculated using the relationship between the
tests that showed these criteria and the total sample size.
Five diferent iLACmin were determined which difer according to ar-rangements between intensities and lactate, and these corresponded to: 1) the determination of iLACmin using all stages obtained in the test, which
was considered in this study as the standard iLACmin (iLACminP), 2)
iLAC-min deteriLAC-mined using all stages before and just two stages ater iLACiLAC-minP
(iLACminA); 3) iLACmin determined using only two stages before and all
stages ater LACminP until exhaustion (iLACminB), 4) iLACmin determined
using the same number of points and the highest possible number of stages
before and ater iLACminP (iLACminI); 5) iLACmin determined using all
points and also the value of the peak concentration of lactate obtained ater
hyperlactatemia induction (iLACminD). he iLACminD was determined by
the relationship between lactate and exercise time, where the lowest lactate value corresponded to a particular exercise time, which enabled, through
linear regression between time-intensity, the determination of iLACminD.
Statistical analysis
Data are presented as means, standard deviation (SD) and 95% conidence intervals (95%CI). he Shapiro-Wilk’s test was applied to verify the data normality. he ANOVA one-way with repeated measures was used to compare the iLACmin determined by diferent arrangements of stages and
the values of VO2, HR and RPE corresponding to LACmin intensities. he
sphericity was veriied by the Mauchly’s test, in case of signiicance, the value of the Greenhouse-Geisser adjustment was considered. he efect size (ES) was classiied as negligible (<0.35), small (0.35 to 0.80), moderate (0.80
to 1.5) and large (> 1.5)24. he Pearson correlation test was used to search
for associations between arrangements of stages, where the correlation coeicient was classiied as very weak to negligible (0 to 0.2), weak (0.2 to
0.4), moderate (0.4 to 0.7), strong (0.7 to 0.9), and very strong (0.9 to 1,0)25.
he Bland-Altman plot was used to check the agreement level between the intensities corresponding to the mathematical adjustments. In all cases a signiicance level of p <0.05 was assumed.
RESULTS
Table 1. Age, total body mass, height, body fat percentage and maximal oxygen uptake (VO2MAX) of study participants. N=12 Age (years) Body mass (kg) height (cm) Body fat (%)
VO2max (ml·kg-1·min-1)
Mean±SD 23±5 78.3±14.1 175.3±5.1 21.6±6.5 40.2±5.6
he intensity corresponding to RCP was 112.9±26.9 W (95%CI=
95.7-129.9 W). he [La-] ater Wingate test was 11.1±1.6 mmol·L-1 (95%CI=
10.1-12.1 mmol·L-1).
In the LACmin determination using polynomial adjustment, the
suc-cess rate for iLACminP, iLACminA and iLACminD was 100%, whereas it
was 66,7% for iLACminB and 83,3% for iLACminI. he R2 values and the
number of points used in mathematical adjustment were, respectively,
0.91±0.06 (95%CI=0.87-0.95) and 9.7±2.1 (95%CI=8.4-11.0) for iLACminP,
0.95±0.03 (95%CI=0.93-0.97) and 7.8±1.8 (95%CI=6.6-8.9) for iLACminA,
0.92±0.06 (95%CI=0.88-0.97) and 5.9±1.6 (95%CI=4.6-7.2) for iLACminB,
0.92±0.05 (95%CI=0.88-0.95) and 7.4±2.5 (95%CI=5.6-9.2) for iLACminI,
0.93±0.05 (95%CI=0.90-0.96) and 10.3±2.4 (95%CI=8.7-11.8) for iLACminD.
Table 2 demonstrates the iLACmin determined using diferent
ar-rangements, as well as the [La-], VO
2, HR and RPE corresponding to these
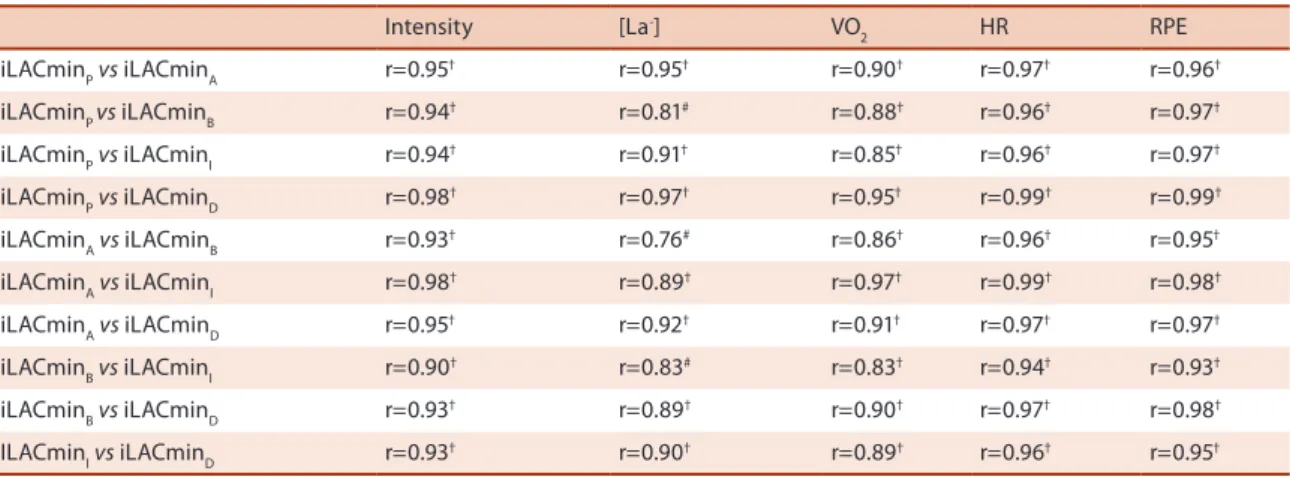
intensities. here was not a statistical diference (p>0.05) between these parameters, and a very low efect size was observed (Table 2). Strong and signiicant correlations were also found between the parameters analyzed (Table 3).
he Bland-Altman plot shows good agreement between the iLACmin, with a mean close to zero for the comparison of intensities determined
using diferent arrangements, and iLACminP (Figure 1). However, the
comparison between iLACminP and iLACminD showed the best level of
agreement with the smallest individual errors identiied by upper and lower limits (Figure 1D).
Table 2. Mean±standard deviation (95%CI) corresponding to intensity, [La-], VO2, HR e RPE determined by diferent arrangements of stages, as well as the efect size (ES).
iLACminP (n=12) iLACminA (n=12) iLACminB
(n=8) iLACminI (n=10) iLACminD (n=12) ES
Intensity (Watts) 138.2±30.3 (119.0-157.4) 139.1±29.1 (120.6-157.5) 135.3±14.2 (123.4-147.2) 138.6±20.5 (123.9-153.2) 136.7±28.5 (118.6-154.7) 0.227 [La-] (mmol·L-1) 5.3±1.7
(4.2-6.4) 5.1±1.7 (4.0-6.2) 5.1±1.6 (3.7-6.4) 5.0±1.4 (4.0-6.0) 5.3±1.7 (4.3-6.4) 0.108 VO2
(ml·kg-1·min-1)
28.8±3.8 (26.4-31.2) 29.2±4.2 (26.5-31.9) 28.7±3.1 (26.1-31.2) 29.3±4.2 (26.3-32.3) 28.5±3.3 (26.3-30.6) 0.238 HR (bpm) 152.7±16.9 (142.0-163.4) 153.2±15.4 (143.5-163.0) 144.6±14.1 (132.8-156.4) 148.0±12.6 (139.0-157.0) 152.2±16.2 (141.9-162.5) 0.231 RPE 12.8±2.8 (11.0-14.6) 13.0±2.8 (11.2-14.8) 13.1±3,1 (10.5-15.7) 13.1±2.9 (11.0-15.2) 12.9±2.8 (11.1-14.6) 0.153
*p<0.05. iLACminP = lactate minimum intensity (iLACmin) determined using all stages; iLACminA = iLACmin determined using all stages below and two stages above iLACminP; iLACminB = iLACmin determined using two stages below and all stages above iLACminP; iLACminI = iLACmin determined using largest and same possible number of stages below and above the iLACminP; iLACminD = iLACmin determined using all stages and peak lactate after hyperlactatemia induction;[La-]: blood lactate concentration, VO
DISCUSSION
he main inding of this study was that both the iLACmin and the physi-ological variables corresponding to this intensity were not inluenced by the number and arrangement of points used in the application of second order polynomial adjustment, but the success rate in the determination of iLACmin was modiied. hese results meet the initial assumptions of the study and are consistent with other studies that used the same polynomial adjustment in diferent arrangements of points and found no diferences
in the determination of iLACmin9,26.
Previous studies have reported aspects that can inluence the lactate-intensity mathematical relationship, such as the type of exercise adopted
Table 3. Coeicients of correlation (r) between intensity, lactate, VO2, HR and RPE corresponding to iLACminP, iLACminA, iLACminB, iLACminC and iLACminD.
Intensity [La-] VO
2 HR RPE
iLACminPvs iLACminA r=0.95† r=0.95† r=0.90† r=0.97† r=0.96†
iLACminP vs iLACminB r=0.94† r=0.81# r=0.88† r=0.96† r=0.97†
iLACminPvs iLACminI r=0.94† r=0.91† r=0.85† r=0.96† r=0.97†
iLACminPvs iLACminD r=0.98† r=0.97† r=0.95† r=0.99† r=0.99†
iLACminAvs iLACminB r=0.93† r=0.76# r=0.86† r=0.96† r=0.95†
iLACminAvs iLACminI r=0.98† r=0.89† r=0.97† r=0.99† r=0.98†
iLACminAvs iLACminD r=0.95† r=0.92† r=0.91† r=0.97† r=0.97†
iLACminBvs iLACminI r=0.90† r=0.83# r=0.83† r=0.94† r=0.93†
iLACminBvs iLACminD r=0.93† r=0.89† r=0.90† r=0.97† r=0.98†
ILACminIvs iLACminD r=0.93† r=0.90† r=0.89† r=0.96† r=0.95† #p<0.05; †p<0.001. iLACmin
P = lactate minimum intensity (iLACmin) determined using all stages; iLACminA = iLACmin determined using all stages below
and two stages above iLACminP; iLACminB = iLACmin determined using two stages below and all stages above iLACminP; iLACminI = iLACmin determined using largest and same possible number of stages below and above the iLACminP; iLACminD = iLACmin determined using all stages and peak lactate after hyperlactatemia induction;[La-]: blood lactate concentration, VO
2: oxygen uptake, HR: heart rate; RPE: rating of perceived exertion.
to induce hyperlactatemia10,12, the type of recovery ater induction16, the
use of diferent initial intensities in the incremental phase18,27 and the time
interval between stages27, but have not investigated the inluence of the
arrangement of points of the incremental phase on the determination of iLACmin. Furthermore, none of these studies adopted a criterion for it
analysis, as used by De Araújo et al.20, which considered disabled all the
tests that were veriied R2 lower than 0.80 and a< 0 of the polynomial it,
considering these as criteria for the success rate. he inclusion of this success rate strengthens iLACmin determination, excluding values that possibly lead to mistakes.
Although this study did not ind diferences in the determination of the iLACmin through polynomial it with diferent arrangements of stages, studies show controversial indings. With the aim of reducing the number
of incremental stages during LMT, Sotero et al.9 did not ind signiicant
diferences between iLACmin determined on race track running, by means of selecting diferent incremental stages, and iMLSS, and strong
correla-tions were observed between all these intensities. However, Pardono et al.15
found diferences between iLACmin and iMLSS on the cycle ergometer where in the irst arrangement all stages of the test were used, in the second the irst stage, the stage of RPE 13 and the stage of exhaustion were used, the third was composed of three stages corresponding to the lower lactate values obtained in the test and the fourth consisted of the irst stage and the stages corresponding to RPE 13 and 16. hese authors found that the iLACmin determined by the irst two arrangements were statistically dif-ferent to iMLSS, while the other two did not difer. hus, the present study
corroborates the indings of Sotero et al.9, although the selection criteria
of the stages was diferent between the studies.
In the present study, the total number of points in the arrangements used does not seem to inluence the success rate, considering that the
lowest average for the total number of points used (iLACminB) (table 2)
was similar to that usually observed in LACmin protocol tests (about 6
points)21. However, selecting more points before the nadir seems to have
been a determining factor in achieving high success rates, as observed in
iLACminA, iLACminP and iLACminD. hus, assuming that the number
of points before the derivative zero is related to the initial intensity and the overload adopted ater each stage during the incremental phase, our results seem to indicate that a greater number of stages before the zero derived allow a better characterization of the lactate-intensity curvature and greater reliability of mathematical it.
In cases in which it was not possible to determine the iLACminB, the
incremental phase point resulted in a proile in [La-] diferent to U-shaped.
Carter, Jones and Doust18 found that when the initial intensity of the
incre-mental phase corresponded to the lactate threshold (LT) or 1 km·h-1 above
the LT, it was not possible to determine the iLACmin. Furthermore, when
the incremental phase was initiated with an intensity of 0.5 km·h-1 below
initial intensities very close to the iLACmin represent a state very close to the balance between production and removal of lactate and, the point at which the accumulation of this metabolite is achieved rapidly occurs,
resulting in an [La-] which is apparently linear.
Voltarelli, Mello and Gobatto26 proposed the use of lactate peak value
of induction through the relationship between lactate vs. time of exercise and diferences in the iLACmin determined with and without the addition of lactate peak value of induction in swimming with rats were not found. Our study is consistent with the work of these authors, considering that
the iLACminD was not diferent from iLACmin determined using diferent
arrangements and showed the highest level of agreement with iLACminP
(Figure 1D) and the smaller individual errors identiied by the lower and upper limits (UL: -6.55 W; LL: 9.65 W).
Another important point to investigate in the mathematical adjustment of lactate-intensity behavior is that the [lac] during the incremental phase in the LACmin test represents not only the metabolic demands of exercise
intensity27, considering that some factors involved in the transport of blood
lactate and muscle can also cause changes in lactate-intensity. Among these factors, the participation of monocarboxylic transporters (MCT’s) is quite relevant, considering that studies have shown that high intensity
training increases the content of MCT1 in human skeletal muscle28, so
that individuals who are more trained aerobically have a greater capacity to remove blood lactate during rest and exercise compared to untrained
individuals29. hus, it is believed that the adjustment in the lactate-intensity
relationship could be inluenced by the training status of the individual, especially the removal rate of lactate ater induction to hyperlactatemia.
Accordingly, the [lac] at intensities below the iLACmin during the incremental phase could be inluenced by several factors related to meth-odological variations. However, at intensities above iLACmin, the [lac] are basically dependent on the intensity and duration of the exercise stage, considering that ater iLACmin greater production than removal of lactate occurs. However, aspects related to the points obtained ater iLACmin which may perhaps inluence the mathematical adjustment have not been investigated. Some authors have used, as a criterion to indicate the end
of the test, the observation of three consecutive increases in [lac]7, always
being obtained ater iLACmin.
herefore, several factors may have been responsible for the lowest coeicient determination values in the mathematical adjustment in cases
where it was not possible to determine the iLACminI. In other studies
prior evaluations have been used to select the exercise intensities of the incremental phase, where it is possible to apply approximately the same number of stages before and ater iLACmin. However, in this study this
arrangement (iLACminI) presented a success rate of 83.3%.
Limitations of the study
variables of intensity, VO2, HR or RPE from diferent intensities of lactate minimum with the iMLSS. Another limitation of the study was the sole application of a LACmin test and performing arrangements of points ob-tained only from this test. In addition, because the study sample consisted of moderately active students and not cyclists, the indings of this study are limited to this population, and its extrapolation to the population of cyclists should be performed with caution.
Practical applications
he results of this study indicate that a greater number of exercise stages before the derivate zero allows a better it in the behavior of the lactate-intensity response, and consequently, has higher success in the determina-tion of iLACmin. Furthermore, one should be cautious when using only a few exercise stages before the iLACmin, such as when applying very high initial intensities, considering that there is a high probability of error in the determination of iLACmin.
CONCLUSION
In sum, according to our indings, iLACmin determination through second order polynomial adjustment in this study was not inluenced by diferent numbers and arrangements of stages or by the use of the peak lactate value ater hyperlactatemia induction. However, the success rate was dependent on the arrangement of stages used in the mathematical model.
REFERENCES
1. Stegmann H, Kindermann W, Schnabel A. Lactate kinetics and individual anaerobic
threshold. Int J Sports Med. 1981;2(3):160-5.
2. Heck H, Mader A, Hess G, Mucke S, Muller R, Hollmann W. Justiication of the 4
mmol/L lactate threshold. Int J Sports Med 1985;6(3):117-30.
3. Wasserman K, Whipp BJ, Koyl SN, Beaver WL. Anaerobic threshold and respiratory
gas exchange during exercise. J Appl Physiol 1973;35(2):236-43.
4. Laplaud D, Guinot M, Favre-Juvin A, Flore P. Maximal lactate steady state determi-nation with a single incremental test exercise. Eur J Appl Physiol 2006;96(4):446-52.
5. MacIntosh BR, Esau S, Svedahl K. he lactate minimum test for cycling: Estimation
of the maximal lactate steady state. Can J Appl Physiol 2002;27(3):232-49.
6. Morel ÉA, Zagatto AM. Adaptação dos testes de lactato mínimo, potência crítica
e limiar anaeróbio para avaliação da transição anaeróbia-anaeróbia em protocolo especíico para o tênis de mesa. Rev Bras Med Esporte 2008;14:518-522.
7. Dotan R, Zigel L, Rotstein A, Greenberg T, Benyamini Y, Falk B. Reliability
and validity of the lactate-minimum test. A revisit. J Sports Med Phys Fitness 2011;51(1):42-9.
8. Bacon L, Kern M. Evaluating a test protocol for predicting maximum lactate steady state. J Sports Med Phys Fitness 1999;39(4):300-8.
9. Sotero RC, Campbell CSG, Pardono E, Puga GM, Simoes HG. Polynomial
adjust-ment as a new technique for determination of lactate minimum velocity with reduced blood sampling. Rev Bras Cineantropom Desempenho Hum 2007;4:321-6.
10. Johnson MA, Sharpe GR, Brown PI. Investigations of the Lactate Minimum Test.
Corresponding author
Alessandro Moura Zagatto Universidade Estadual Paulista (UNESP)
Campus de Bauru. Departamento de Educação Física
Av. Luiz Edmundo Carrijo Coube, 14-01, Vargem Limpa, CEP 17033-360 – Bauru, SP. Brasil E-mail: [email protected]
11. Tegtbur U, Busse MW, Braumann KM. Estimation of an individual equilibrium
between lactate production and catabolism during exercise. Med Sci Sports Exerc 1993;25(5):620-7.
12. Smith MF, Balmer J, Coleman DA, Bird SR, Davison RC. Method of lactate
eleva-tion does not afect the determinaeleva-tion of the lactate minimum. Med Sci Sports Exerc 2002;34(11):1744-1749.
13. Ribeiro L, Balikian P, Malachias P, Baldissera V. Stage length, spline function and lactate minimum swimming speed. J Sports Med Phys Fitness 2003;43(3):312-8.
14. Zagatto AM, Papoti M, Gobatto CA. Comparação entre ergômetros especíico e
convencionais na determinação da capacidade aeróbia de mesatenistas. Rev Bras Med Esporte 2009;15(3):204-208.
15. Pardono E, Sotero Rda C, Hiyane W, Mota MR, Campbell CS, Nakamura FY, et al.
Maximal lactate steady-state prediction through quadratic modeling of selected stages of the lactate minimum test. J Strength Cond Res 2008;22(4):1073-80.
16. Ribeiro LF, Gonçalves CG, Kater DP, Lima MC, Gobatto CA. Inluence of recovery
manipulation ater hyperlactemia induction on the lactate minimum intensity. Eur J Appl Physiol 2009;105(2):159-65.
17. Simões HG, Campbell CSG, Kokubun E, Denadai BS, Baldissera V. Blood glucose
responses for individual anaerobic threshold and for lactate minimum in trac tests. Eur J Appl Physiol 1999;80:34-40.
18. Carter H, Jones AM, Doust JH. Efect of incremental test protocol on the lactate
minimum speed. Med Sci Sports Exerc 1999;31(6):837-45.
19. Sotero RC, Cunha VNC, Madrid B, Sales MM, Moreira SR, Simões HG. Identiicação
do lactato mínimo de corredores adolescentes em teste de pista de três estágios incrementais Rev Bras Med Esporte 2011;17(2):119-122.
20. De Araujo GG, Papoti M, Manchado FB, de Mello MA, Gobatto CA. Protocols for
hyperlactatemia induction in the lactate minimum test adapted to swimming rats. Comp Biochem Physiol A Mol Integr Physiol 2007;148(4):888-92.
21. Puga GM, Kokubun E, Simões HG, Nakamura FY, Campbell CSG. Aerobic itness
evaluation during walking tests identiies the maximal lactate steady state. Sci World J 2012;2012:769431.
22. Meyer T, Lucía A, Earnest CP, Kindermann W. A conceptual framework for
performance diagnosis and training prescription from submaximal gas exchange parameters--theory and application. Int J Sports Med 2005;26 Suppl 1:S38-48.
23. Borg GAV. Psychophysical bases of perceived exertion. Med Sci Sports Exer
1982;14:377-381.
24. Rhea MR. Determining the magnitude of treatment efects in strength training
research through the use of the efect size. J Strength Cond Res 2004;18(4):918-920.
25. Rowntree D. Statistics Without Tears. London: Penguin; 1991.
26. Voltarelli FA., Mello MAR, Gobatto CA. Transição metabólica e teste de
lac-tato mínimo em ratos: nova proposta de quantiicação de esforço. Rev Educ Fis 2005;16:73-78.
27. Johnson MA, Sharpe GR. Efects of Protocol Design on Lactate Minimum Power.
Int J Sports Med 2011:32(3):199-204.
28. Pilegaard H, Domino K, Noland T, Juel C, Hellsten Y, Halestrap AP, et al. Efect of high-intensity exercise training on lactate/H1 transport capacity in human skeletal muscle. Am J Physiol 1999;276(2 Pt 1):E255-61.
29. homas C, Perrey S, Lambert K, Hugon G, Mornet D, Mercier J. Monocarboxylate
![Table 2 demonstrates the iLACmin determined using diferent ar- ar-rangements, as well as the [La - ], VO 2 , HR and RPE corresponding to these intensities](https://thumb-eu.123doks.com/thumbv2/123dok_br/14948295.504665/6.850.106.758.770.974/table-demonstrates-ilacmin-determined-diferent-rangements-corresponding-intensities.webp)