RBCDH
Licence Creative Commom CC
1 Pontifícia Universidade Católica do Paraná. Escola de Saúde e Biociências. Grupo de Pesquisa em Atividade Física e Qualidade de Vida. Curitiba, PR. Brasil.
2 Universidade Federal do Paraná. Programa de Pós Graduação em Educação Física. Curitiba, PR. Brasil.
3 Universidade Estadual de Ponta Grossa. Departamento de Educa-ção Física. Ponta Grossa, PR. Brasil. Bolsista Fundação Araucária.
Received: 28 September 2011 Accepted: 14 June 2012
Validity and reliability of an instrument to
measure barriers to bike use in adults
Validade e idedignidade de um instrumento para
avaliar as barreiras para o uso de bicicleta em adultos
Marilson Kienteka1,2
Cassiano Ricardo Rech1,2,3
Rogério César Fermino1,2
Rodrigo Siqueira Reis1,2
Abstract– he purpose of this study was to analyze the validity and reliability of an instrument to assess the perception of barriers related to bicycling for leisure and transportation in adults. he items composing the instrument were selected from the literature review on the subject. Content validity was analyzed by consulting experts in physical activity ield. he reliability was assessed through internal consistency (Cronbach’s alpha) and agree-ment (intraclass correlation coeicient (ICC), kappa coeicient and relative agreeagree-ment in a sample of 66 adults (18-79 years old) selected from three census tracts in Curitiba-PR. Data were analyzed using SPSS 17.0, with a signiicance level of 5%. Most of the sample consisted of women (60%), aged ≥40 years old (47%) and intermediate socioeconomic level (68%). he frequency of bicycling in leisure time was higher than for transportation means (15.2 vs 7.6%). he internal consistency (Cronbach’s alpha) was signiicant, both in leisure time (α=0.77) and transportation (α=0.82). he agreement was higher for leisure (80.3 to 93.9%) than compared to commuting (76.9 to 90.8%). Kappa values were moder-ate to high (leisure: 0.41 to 0.82: commuting: 0.53 to 0.82). he ICC sub-scores were 0.93 (CI95%: 0.88 to 0.96) and 0.89 (CI95%: 0.82 to 0.94) for leisure and transport, respectively. It follows that the instrument has psychometric quality suitable for measuring the barriers to bicycle use in adults.
Key words: Bicycling; Commuting; Facilities access; Leisure activity.
INTRODUCTION
Brazil is estimated to have the sixth largest leet of bicycles in the world, with nearly 75 million units, behind countries like China, India, the United
States, Japan and Germany1. Evidence points out that bicycling is
associ-ated with a lower risk of mortality due to cardiovascular disease and with
a reduction in overall morbidity2.
Despite this evidence, few studies investigated leisure and
transporta-tion bicycling in Brazil3,4. Population-based studies conducted in
Pelotas-RS, Brazil, observed that 17% of workers use the bicycle to commute to
work5 and 13% of adults use it in their leisure time4. By contrast, bicycling
is substantially higher in high-income countries, between 22 and 32% to
commute to work6,7, 41% to commute to college8, and 26% in leisure time.
his visible diference in comparison with Brazil takes on a special meaning when one considers the potential of active commuting, such as bicycling,
to increase overall physical activity (PA) levels3.
here are several aspects, both personal and environmental, associ-ated with leisure and transportation bicycling, such as higher bicycle lane
connectivity, personal satisfaction, safety perception, and social support6-9.
Identifying the factors associated with bicycling may contribute to the
promotion of more efective interventions aimed at utilitarian bicycling10.
However, identifying the aspects that are perceived as obstacles for bi-cycling is an important issue, since they are capable of being changed. Studies point out that lack of time and interest, distance to destination, physical discomfort, and low practicality as a mode of transportation are
among the most reported barriers to bicycling in adults7-9. Brazilian
stud-ies demonstrated that individual aspects (male sex, lower education and socioeconomic status - SES) are associated with bicycling to commute to
work4,5. In leisure time, living with a partner was associated with bicycling4.
Despite this evidence, there were no studies investigating the perception of barriers to bicycling in Brazil. Although instruments that can identify
barriers to PA in adults11 and adolescents have been developed, this was
not observed with regard to bicycling12. he absence of studies on barriers
to bicycling in Brazil can be partially explained by the lack of instruments adapted to the Brazilian context. herefore, the aim of the present study was to analyze the validity and reliability of an instrument to assess the perception of barriers related to bicycling in adults.
METHODOLOGY
For the development and subsequent validity and reliability analysis of the
instrument, two stages implemented in a similar study13 were performed,
Construction of the instrument
In the PA ield, the term “barrier” is conceptually deined as the reasons that may reduce the possibility or hamper the engagement of an individual in
a speciic activity14. Concerning bicycling, these barriers can be related to
intrinsic (individual’s characteristics, motivation, etc.) and extrinsic aspects (lack of time, family support, street facilities, etc.), which can change
indi-viduals’ perception on their motivation or willingness to use the bicycle15.
To develop the instrument, a literature review on the barriers to bicy-cling among adults was performed in health databases (PubMed, SciElo and Lilacs). Combinations of the following Health Science Descriptors (De-scritores em Ciências da Saúde - DeCS) were used: “barriers”, “bicycling”, “commuting”, “active transport”, “transportation”, “motor activity”, “PA”,
“exercise” and “recreation”,and their corresponding terms in Portuguese.
he selected studies should meet the following inclusion criteria: a) being empirical, b) quantitative, c) with outcomes for barriers to bicycling, d) with individuals between 18 and 65 years old, e) indexed in periodicals published in Portuguese or English.
Eleven studies met search criteria. Next, the authors categorized the barriers reported in the studies into three sets of barriers: individual (demographic-biological and psychological, cognitive and emotional), social, and environmental (physical and natural environment), as seen in box 1. Physical environmental factors were categorized into three subsets: a) functionality - representing items related to access to bicycling, and conditions to commute around the city; b) safety – representing traic safety conditions for bicycling; c) esthetics – or those attractive elements for bicycling. As for natural environment, rain and cold were also included
because they represent potential barriers to bicycling20.
Box 1. Individual, social and environmental factors associated with bicycling among adults6-9,16-22
Leisure and transportation factors associated with bicycling
Physical environment Social
environ-ment
Natural envi-ronment
Psychological, cogni-tive and emotional
Functionality Safety Esthetics
Lack of cycling paths Intense traic Dirty and aban-doned place
Lack of social support
Unfavorable
climate Physical discomfort
Lack of dressing rooms Unsafe places Few green areas Ownership of a
vehicle Lack of interest
Lack of parking safely Unsafe parking
spaces Lack of maintenance Low fuel cost Lack of time
Low walkability Busy crossroads Little to see Lack of social
cohesion Low self-eicacy
Low demographic
density High car speed Pollution Low satisfaction
Sloped streets (uphill) Lack of lighting
Low connectivity
(cycling paths) Lack of public safety
Distance to
Based on the items listed, and on the assumptions of the ecological
approach23, the items of the instrument were developed considering a
conceptual framework. he framework was used to organize the con-ceptual basis so as to ensure the visualization of the concerned construct (barriers to bicycling), as well as ensuring that the instrument items were
appropriately represented24.
Content validity
he items were discussed by a group of experts comprising two PhD profes-sors from the physical activity and health ield and six Physical Education graduate students, all of them researchers from the environmental and PA ield. his stage was developed with the purpose of adapting the aspects reported in international studies to the Brazilian context and helped in the agreement on and deinition of the items selected to compose the
instru-ment24. Finally, the experts identiied 13 barriers to bicycling, 11 of which
were common to leisure and transportation bicycling (igure 1) (appendix).
Barries to bicycling
Ambientais
Physical
– Climate (rain, cold) – Pollution
– Lack of social support (family/friends)
Psychological, cognitive and emotional Individual
– Lack of willingness – Fear of accidents (fails and collisions)
Figure 1. Items included in the instrument of perceived barriers to bicycling.
To assess clarity, adequacy of items, and way of implementing the instrument, a preliminary version was applied to eight undergraduate students (20-32 years). Subsequently, researchers gathered to make correc-tions and adapt the items for a better understanding by the study subjects. We chose to apply the instrument using a scale with dichotomous answers
indicating the presence (“yes”) or the absence (“no”) of the barrier, based on
previous studies25,26. he total instrument score was obtained by the sum
Reliability analysis
Reliability was assessed through internal consistency analysis (Cronbach’s alpha) and temporal stability (agreement between two tests). In order to test the discriminatory power of the instrument to evaluate diferent individuals and ensuring diferent SES characteristics (considering the mean income of heads of household in each census tract according to the Brazilian Institute of Geography and Statistics - IBGE) and environmental conditions for PA (using the classiication of walkability, obtained by the presence of attributes of the built environment: street intersections, diversi-ied land use, and commercial and population density), three census tracts of the city of Curitiba, state of Paraná, Brazil, were intentionally selected. Ater this selection, the households in the tracts were listed (n=1,043). From the list of households, with the aid of Epi Info sotware, a table of random numbers was generated to draw the households to be visited. he
number of households (n=120) was determined based on a similar study25.
In each drawn household, based on the number of eligible dwellers, an
individual was randomly selected27. Adult individuals (≥18 years) of both
sexes who were living for at least one year at that home were considered eligible. Individuals who did not live at the household (e.g.: house servants and visitors), those with some physical limitation that prevented PA or those with cognitive limitations that prevented them from understanding the questions were excluded from the study. If the drawn individual was not at home at the moment of the visit or could not answer the survey at that moment, the interviewers were instructed to schedule a second meet-ing with the dweller. In case of refusal, the next household on the right was automatically selected. Before it was considered a refusal, researchers should have made three unsuccessful attempts of contacting the drawn individual.
Data were collected through a face-to-face interview including tions on barriers to leisure and commuter bicycling. Besides these ques-tions, socio-demographic information (sex, age, SES) and data on leisure and transportation bicycling were obtained. SES was evaluated based on the Brazilian Economic Classiication Criteria and categorized into three
strata: high (A1+A2), intermediate (B1+B2) and low (C1+C2+D+E)28. he
frequency of bicycling was assessed by a dichotomous answer (“yes”, “no”) to the following questions: a) Do you use a bicycle in your free time? b) Do you use a bicycle to commute from some place to another, as a mode of transportation?
Data collection was performed in two stages: a) face-to-face interviews (n=84) to assess internal consistency; and b) re-interviews (n=66), ater an interval between seven and 10 days, to assess reproducibility. In the re-interview, 18 subjects refused to participate. herefore, we chose to analyze only the cases with complete data (n=66). he inal sample had a power ≥0.80 for the performed analyses.
Data were analyzed using absolute and relative frequency distribution. Internal consistency was analyzed by Cronbach’s α scores. Temporal sta-bility was assessed by the test-retest method (interval between seven and 10 days), and tested by intraclass correlation coeicient (ICC), relative agreement, and kappa index. Values for α and ICC ≥0.70, relative agree-ment ≥70.0% and kappa index with p<0.05 were considered as appropriate
reliability values13. Analyses were performed with SPSS 17.0 sotware and
the signiicance level was set at 5%.
Ethical aspects
he study was approved by the Research Ethics Committee of Pontifícia Universidade Católica do Paraná (protocol no. 3034/2009) and subjects voluntarily participated signing a free and informed consent.
RESULTS
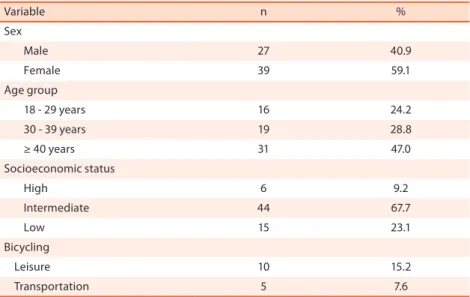
A total of 120 households were visited; however, 30% (n=36) of them did not have eligible individuals or refused to participate in the study. he number of participants in the irst interview was 84 individuals in the three census tracts (test). In the second interview (retest), 18 individuals (21.4%) refused to participate. herefore, the number of participants in the second stage was 66 individuals (78% of the eligible subjects from the irst phase).
Most participants were female (59.1%), were aged ≥40 years (47%) and belonged to the intermediate SES (67.7%), as seen in table 1. Nearly 15%
of participants (CI95%: 6.5-24.0) used the bicycle in leisure time and 7%
(CI95%: 1.2-14.0) for transportation means. Commuting bicycling was more
frequent among men (11.1 vs. 5.1%; p<0.05).
Table 1. Socio-demographic characteristics and data on bicycling among adults from Curitiba-PR, Brazil, 2010 (n=66).
Variable n %
Sex
Male 27 40.9
Female 39 59.1
Age group
18 - 29 years 16 24.2
30 - 39 years 19 28.8
≥ 40 years 31 47.0
Socioeconomic status
High 6 9.2
Intermediate 44 67.7
Low 15 23.1
Bicycling
Leisure 10 15.2
Transportation 5 7.6
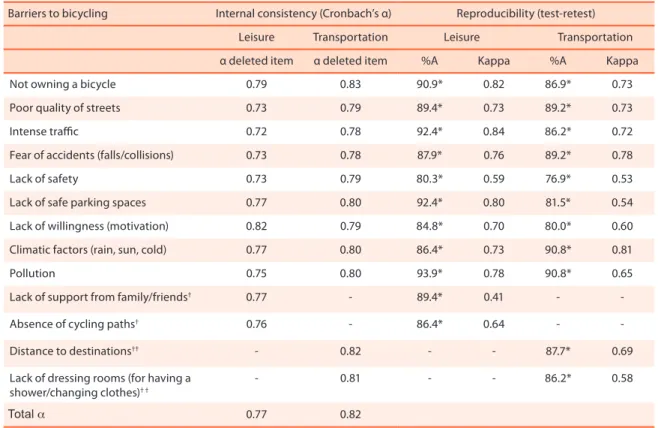
val-ues (≥0.70) for all items of the instrument, both for leisure (α=0.77) and transportation (α=0.82). he items had equal importance in the calculation of the total value of the scale and were maintained in the inal structure (table 2).
he items of the scale showed high agreement both for leisure (80.3 to 93.9%) and transportation (76.9 to 90.8%) (table 2). Similarly, kappa agree-ment values were moderate to high for both domains (leisure: 0.41-0.82;
transportation: 0.53-0.82). ICC values of the sub-scores were 0.93 (CI95%:
0.88-0.96) and 0.89 (CI95%: 0.82-0.94) for leisure and transportation, respectively.
Table 2. Cronbach’s alpha values for (α), agreement percentage and kappa index for the barriers to leisure and transportation bicycling in adults, Curitiba-PR, Brazil, 2010.
Barriers to bicycling Internal consistency (Cronbach’s α) Reproducibility (test-retest)
Leisure Transportation Leisure Transportation
α deleted item α deleted item %A Kappa %A Kappa
Not owning a bicycle 0.79 0.83 90.9* 0.82 86.9* 0.73
Poor quality of streets 0.73 0.79 89.4* 0.73 89.2* 0.73
Intense traic 0.72 0.78 92.4* 0.84 86.2* 0.72
Fear of accidents (falls/collisions) 0.73 0.78 87.9* 0.76 89.2* 0.78
Lack of safety 0.73 0.79 80.3* 0.59 76.9* 0.53
Lack of safe parking spaces 0.77 0.80 92.4* 0.80 81.5* 0.54
Lack of willingness (motivation) 0.82 0.79 84.8* 0.70 80.0* 0.60
Climatic factors (rain, sun, cold) 0.77 0.80 86.4* 0.73 90.8* 0.81
Pollution 0.75 0.80 93.9* 0.78 90.8* 0.65
Lack of support from family/friends† 0.77 - 89.4* 0.41 -
-Absence of cycling paths† 0.76 - 86.4* 0.64 -
-Distance to destinations†† - 0.82 - - 87.7* 0.69
Lack of dressing rooms (for having a shower/changing clothes)† †
- 0.81 - - 86.2* 0.58
Total a 0.77 0.82
†speciic barriers for leisure; †† speciic barriers for transportation; %A: relative agreement. *p<0.05. Sub-scores: ICC for leisure: 0.93 (CI
95%: 0.88-0.96); ICC for
transportation: 0.89 (CI95%: 0.82-0.94).
DISCUSSION
he present study aimed to analyze the validity and reliability of an instru-ment to assess barriers to leisure and transportation bicycling in adults, including items related to individual, social and environmental factors. his reinforces the assumption that the study on the barriers to bicycling needs to include a broader contextual approach, such as, for example, a
socio-ecological approach23. he literature review also pointed out that
individual and environmental aspects are associated with bicycling in
diferent regions of the world6,16-18,20; therefore, the instrument included
As to content validity, there was a consensus among experts that the barriers should be analyzed speciically regarding the type of bicycling (leisure vs. transportation). hus, we chose to use two sub-scales, each of them comprising 11 items. Internal consistency results showed adequate values. All items contributed signiicantly to explain overall variance in
the instrument. In general, α values ≥0.70 are good for internal consistency
analysis13. A study conducted with focus groups to analyze the barriers to
PA in adolescents reported similar internal consistency values (>0.85)12.
However, the lack of similar measures in adults hampers the comparison with the indings from the present study.
he items included as barriers to bicycling are supported by studies indicating that these factors are also associated with bicycling. Studies
con-ducted in three European countries6,7,9, where bicycling is more frequent,
point out that socio-cultural aspects are related to this behavior, which
directly inluences public policies to stimulate its use29. On the other hand,
items that indicate convenience (such as access to dressing rooms) are also reported as important facilitators of bicycling, especially for transportation
means17. Climatic factors are also reported as barriers to bicycling, since in
countries with severe winters a decrease in bicycling was observed during
rainy days20. he distance to destination has been associated with bicycling
in Brazil21 and in Europe6. herefore, to some extent it is possible that the
associated aspects may be common in diferent countries and thus compose instruments applying to the Brazilian context.
Indeed, this possibility was reinforced by the results of the temporal consistency analysis (reproducibility). For example, a high agreement was found, both for leisure (80%-94%) and transportation (77%-91%). Despite
this high agreement, kappa indexwas moderate to high among items
re-lated to leisure (k=0.41 to k=0.82) and transportation (k=0.53 to k=0.81; p<0.05). In spite of being considered adequate, kappa values are similar to those reported in another study that tested instruments assessing barriers
to PA (k=0.55 to k=0.88)11.
his study presents an important contribution to investigations focused on leisure and transportation bicycling. So far there were no instruments allowing assessing the barriers to bicycling in the Brazilian context. In addition, the use of diferent strategies and analyses ensured that validity and reliability were appropriately assessed. Finally, the application of rigor-ous methods to obtain data allowed that response biases were minimized, which contributed to improve the quality of the instrument.
from those of other localities, not representing the Brazilian population. Moreover, the city has important urban characteristics that may afect the perception of barriers to bicycling (green areas, parks, cycling paths, and special lanes for public transportation). he limited evidence on fac-tors associated with bicycling in the Brazilian population, especially per-ceived barriers, limits the comparison of our indings with those from the literature. Finally, the clarity of the instrument was assessed in a sample of undergraduate students; therefore, we suggest further tests in other population groups.
CONCLUSION
It follows that the instrument has adequate psychometric quality and can be used to investigate perceived barriers to bicycling in Brazilian adults. he application of this instrument in surveys to identify factors associ-ated with bicycling in the population will help in increasing the amount of evidence on the subject. hese data are important for the efective implementation of this form of PA in the country, which takes on great importance in promoting health and sustainable transportation. Further additional studies should test the psychometric attributes of the instrument in diferent population groups.
REFERENCES
1. Brasil. Programa Brasileiro de Mobilidade por Bicicleta. Brasília: Ministério das
Cidades; 2010: Available from: <http://www.cidades.gov.br [2011 jun 2012].
2. Hamer M, Chida Y. Active commuting and cardiovascular risk: A meta-analytic
review. Prev Med 2008;46(1):9-13.
3. Santos CM, Barbosa JMV, Cheng LA, Wanderley Jr. RSW, Barros MVG. Atividade
física no contexto dos deslocamentos: Revisão sistemática dos estudos
epidemi-ológicos realizados no Brasil. Rev Bras Ativ Fís Saúde 2009;14(1):15-22.
4. Dumith SC, Domingues MR, Gigante DP. Epidemiologia das atividades físicas
praticadas no tempo de lazer por adultos do Sul do Brasil. Rev Bras Epidemiol
2009;12(4):646-58.
5. Bacchieri G, Gigante DP, Assunção MC. Determinantes e padrões de utilização da
bicicleta e acidentes de trânsito sofridos por ciclistas trabalhadores da cidade de Pelotas, Rio Grande do Sul, Brasil. Cad Saúde Pública 2005;21(5):1499-508.
6. Engbers LH, Hendriksen IJ. Characteristics of a population of commuter cyclists
in the Netherlands: perceived barriers and facilitators in the personal, social and
physical environment. Int J Behav Nutr Phys Act 2010;7:89.
7. Titze S, Stronegger WJ, Janschitz S, Oja P. Association of built-environment,
social-environment and personal factors with bicycling as a mode of transportation among
Austrian city dwellers. Prev Med 2008;47(3):252-9.
8. Titze S, Stronegger WJ, Janschitz S, Oja P. Environmental, social, and personal correlates of cycling for transportation in a student population. J Phys Act Health
9. De Geus B, De Bourdeaudhuij I, Jannes C, Meeusen R. Psychosocial and environ-mental factors associated with cycling for transport among a working population. Health Educ Res 2008;23(4):697-708.
10. Dishman RK, Sallis JF, Orenstein DR. he determinants of physical activity and exercise. Public Health Rep 1985;100(2):158-71.
11. Martins MO, Petroski EL. Mensuração da percepção de barreiras para a prática de atividades físicas: uma proposta de instrumento. Rev Bras Cineantropom De-sempenho Hum 2000;2(1):58-65.
12. Santos MS, Reis RS, Rodriguez-Añez CR, Fermino RC. Desenvolvimento de um
instrumento para avaliar barreiras para a prática de atividade física em adolescentes. Rev Bras Ativ Fis Saude 2009;14(2):76-85.
13. Terwee CB, Bot SDM, de Boer MR, van der Windt DAWM, Knol DL, Dekker J,
et al. Quality criteria were proposed for measurement properties of health status questionnaires. J Clin Epidemiol 2007;60(1):34-42.
14. Sallis JF, Owen N. Physical activity & behavioral medicine; Califonia; Sage Publica-tions. Behaviors Medicine and Health Psychology Series; 1999.
15. Pikora T, Giles-Corti B, Bull F, Jamrozik K, Donovan R. Developing a framework for assessment of the environmental determinants of walking and cycling. Soc Sci Med 2003;56(8):1693-703.
16. Heesch KC, Han JL. Associations between demographic, perceptual, and behavioral factors and support for policies encouraging active transport. J Phys Act Health 2007;4(3):261-77.
17. Tin Tin S, Woodward A, hornley S, Langley J, Rodgers A, Ameratunga S. Cyclists’ attitudes toward policies encouraging bicycle travel: indings from the Taupo Bicycle Study in New Zealand. Health Promot Int 2009;25(1):54-62.
18. Butler GP, Orpana HM, Wiens AJ. By your own two feet: factors associated with active transportation in Canada. Can J Public Health 2007;98(4):259-64.
19. Cervero R, Sarmiento O, Jacoby E, Gomez LF, Neiman A. Inluences of built
environments on walking and cycling: lessons from Bogotá. Int J Sust Transp 2009;3(4):203-26.
20. Winters M, Friesen MC, Koehoorn M, Teschke K. Utilitarian Bicycling: A Multi-level Analysis of Climate and Personal Inluences. Am J Prev Med 2007;32(1):52-8.
21. Parra DC, Hoehner CM, Hallal PC, Ribeiro IC, Reis SR, Brownson RC, et al. Per-ceived environmental correlates of physical activity for leisure and transportation in Curitiba, Brazil. Prev Med 2011;52(3-4):234-38.
22. Owen N, De Bourdeaudhuij I, Sugiyama T, Leslie E, Cerin E, Van Van Dyck D, et al. Bicycle use for transport in an Australian and a Belgian city: associations with built-environment attributes. J Urban Health 2010;87(2):189-98.
23. Sallis JF, Owen N, Fisher EB. Ecological models of health behavior. In: Glanz K, Rimer BK, Viswanath K. Health Behavior and Health Education. 4th ed. Jossey-Bass; 2008 p. 465-482.
24. Terwee CB, Mokkink LB, Van Poppel MNM, Chinapaw MJM, Van Mechelen W, De
Vet HCW. Qualitative attributes and measurement properties of physical activity questionnaires: a checklist. Sports Med 2010;40(7):525-37.
25. Rech CR, Fermino RC, Hallal PC, Reis RS. Validade e fidedignidade da
es-cala de satisfação com a prática de atividade física em adultos. Rev Saúde Pública 2010;45(2):286-93.
26. Rech CR, Sarabia TT, Fermino RC, Hallal PC, Reis RS. Propriedades psicométricas de uma escala de autoeicácia para a prática de atividade física em adultos brasileiros. Rev Panam Salud Publica 2011;29(4):259-66.
27. Kish L. Sampling organizations and groups of unequal sizes. Am Sociol Rev
28. ABEP. Associação Brasileira de Estudos Populacionais (2008). Critério de Classii-cação Econômica do Brasil. Available from: <http://www.abep. org/codigosguias/ ABEP_CCEB.pdf> [2010 jul 18]
29. Pucher J, Dill J, Handy S. Infrastructure, programs, and policies to increase bicy-cling: An international review. Prev Med 2010;50:S106-S125.
Corresponding author
Marilson Kienteka
Pontifícia Universidade Católica do Paraná – PUCPR
Escola de Saúde e Biociências - ESB Curso de Educação Física - Grupo de Pesquisa em Atividade Física e Qualidade de Vida
R. Imaculada Conceição, 1155 - Prado Velho
APPENDIX
INSTRUMENT TO EVALUATE PERCEPTION OF BARRIERS TO BICYCLING
Bicycling in leisure time
Please indicate which one of the above listed items represent reasons why you do not use the bicycle in your leisure time. Consider as leisure the free time, it means, the moments when you are not at work, school/college or doing household tasks.
Which are the reasons for you to avoid using the bicycle in leisure time?
1. Lack of safety 0[ ] No 1[ ] Yes
2. Poor quality of streets 0[ ] No 1[ ] Yes
3. Fear of accidents (falls and collisions) 0[ ] No 1[ ] Yes
4. Lack of support from family and friends 0[ ] No 1[ ] Yes
5. Lack of a safe parking space for the bicycle 0[ ] No 1[ ] Yes
6. Intense traic 0[ ] No 1[ ] Yes
7. Too much pollution 0[ ] No 1[ ] Yes
8. Lack of willingness (motivation) 0[ ] No 1[ ] Yes
9. Unfavorable climate (sun, rain, cold) 0[ ] No 1[ ] Yes
10. Not owning a bicycle 0[ ] No 1[ ] Yes
11. Absence of cycling paths 0[ ] No 1[ ] Yes
12. Other reasons: ___________________________
Bicycling for transportation (commuting)
Please indicate which ones of the above listed items represent reasons why you do not use the bicycle as a mode of transportation (commuting from some place to another).
Which are the reasons for you to avoid using the bicycle for transportation?
1. Lack of safety 0[ ] No 1[ ] Yes
2. Poor quality of streets 0[ ] No 1[ ] Yes
3. Lack of dressing rooms (changing clothes/having a shower) 0[ ] No 1[ ] Yes
4. Lack of a safe parking space for the bicycle 0[ ] No 1[ ] Yes
5. Intense traic 0[ ] No 1[ ] Yes
6. Too much pollution 0[ ] No 1[ ] Yes
7. Lack of willingness (motivation) 0[ ] No 1[ ] Yes
8. Unfavorable climate (sun, rain, cold) 0[ ] No 1[ ] Yes
9. Not owning a bicycle 0[ ] No 1[ ] Yes
10. Distance to destinations 0[ ] No 1[ ] Yes
11. Fear of accidents (falls and collisions) 0[ ] No 1[ ] Yes