Artigo
DOI: 10.14295/2238-6416.v72i4.647STUDY OF LACTOSE CRYSTALLIZATION
IN CONCENTRATED WHEY
Monitoramento da cristalização da lactose em soro concentrado
Ítalo Tuler Perrone1*, João Pablo Fortes Pereira2, Isis Rodrigues Toledo Renhe3, Júlia d’Almeida Francisquini2, Rodrigo Stephani4, Antônio Fernandes de Carvalho2ABSTRACT
The kinetics of lactose crystal growth in concentrated whey were studied in two stages. The first took place in a bench-top crystallizer and the second in an industrial crystallizer using concentrated whey obtained by vacuum evaporation, consisting of 3 treatments: crystallization by primary nucleation, by secondary nucleation with the addition of 0.05% and with the addition of 0.1% microcrystalline lactose. The average size of the crystals remained between 60.7 m and 63.8 m. The percentage of crystallization was greater in the secondary nucleation process than in the primary nucleation, where crystallization stabilized first. Mathematical equations which independently related crystallization times of the concentrated whey to the concentrations of soluble solids, crystallization percentage and mass of lactose in water were established, that can be used in the industrial setting to process whey. The kinetics of lactose crystal growth was not well described by models of first or second order reactions.
Keywords: lactose; whey; solubility; concentration; nucleation. RESUMO
Neste trabalho a cinética da cristalização da lactose em soro concentrado foi estudada em duas fases. A primeira fase foi conduzida em cristalizador de bancada empregando-se soro com respectivamente 43%, 48% e 53% de sólidos. A segunda fase
1 Universidade Federal de Juiz de Fora, Departamento de Ciências Farmacêuticas, Juiz de Fora, MG, Brasil. E-mail: italotulerperrone@gmail.com
2 Universidade Federal de Viçosa, Departamento de Tecnologia de Alimentos, Viçosa, MG, Brasil. 3 EPAMIG, Instituto de Laticínios Cândido Tostes, Juiz de Fora, MG, Brasil.
4 Universidade Federal de Juiz de Fora, Departamento de Química, Juiz de Fora, MG, Brasil. * Autor para correspondência.
Recebido / Received: 13/03/2018 Aprovado / Approved: 16/04/2018
foi conduzida em cristalizador industrial a partir de soro integral concentrado obtido por evaporação a vácuo, constando de 3 tratamentos: cristalização por nucleação primária, cristalização por nucleação secundária a partir da adição de 0,05% m/m de lactose microcristalina e cristalização por nucleação secundária a partir da adição de 0,1% m/m de lactose microcristalina. O percentual de cristalização foi maior no processo de nucleação secundária quando comparada a nucleação primária, tendo este estabilizado antes. Equações matemáticas que descrevem a cristalização foram determinadas. A média do tamanho dos cristais ficou entre 60,7 m e 63,8 m, estan do em consonância com valores encontrados na literatura. A cinética de cristalização do soro integral concentrado não é bem descrita pelos modelos de reações de primeira e segunda ordem.
Palavras-chave: lactose; soro; solubilidade; concentração; nucleação. INTRODUCTION
Crystallization of lactose for the pro-duction of non-hygroscopic whey powder should be performed by the mechanism of spontaneous nucleation in the evaporator or finisher, accompanied by cooling in a vacuum flash cooler and crystallizers to produce tiny crystals. According to Hynd (1980), whey powder has the tendency to absorb water from ambient air, resulting in aggregation of colloidal particles of the product during storage, caused by the replacement of part of the crystalline lactose by amorphous lac-tose. Fox; McSweeney (1998) found that the acidity, crystallization of lactose in the whey concentrate and the temperature of the exhaust air from the drying chamber should be controlled in order to increase the shelf life of whey powder. When obtained without previous crystallization, whey pow der is a very fine, hygroscopic powder, with a tendency for aggregation of colloidal par ti cles due to the presence of lactose in an amorphous or glassy state (MASTERS, 2002). Several scientific papers have been publis hed on the effects of lactose crystalli-zation on dairy powders properties (DAS et al., 2010; CHIOU et al., 2008; LANGRISH, 2009; DAS; LANGRISH, 2012). Primary nu cleation is characterized by mechanisms in which crys tals form in the absence of
pre-existing crystals. If the solution is absolu tely pure, nucleation is homogeneous, while nu-cleation is heterogeneous in the presence of foreign solid substances. If crystallization occurs in a crystalline suspension, as normally encountered in crystallization equipment, it is referred to as secondary nucleation (NÝVLT et al., 2001).
The development of operational and technological attributes for the processing of whey powder is necessary for effective sizing of equipment in the industrial production of concentrated and dehydrated products. Properly projected equipment and process lines contribute to greater competitiveness for industries in national and international markets, as well as better utilization of whey. The aim of the present study was to determi-ne the kidetermi-netics of lactose crystal growth in skimmed and whole whey.
MATERIAL AND METHODS
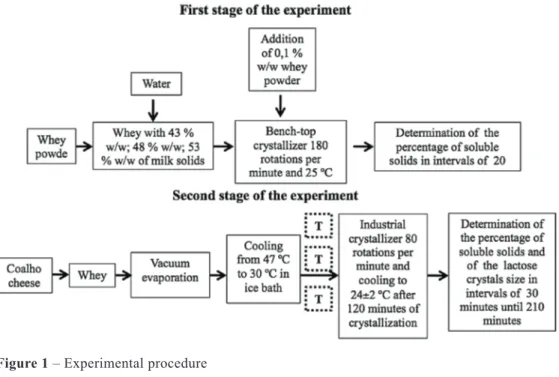
Studies of laboratory-scale crystalliza-tion, concentration in a vacuum evaporator and industrial crystallization, were underta-ken at the Laboratories of Physico-Chemi-cal Analyses and Laboratory of Technology of the EPAMIG/CândidoTostes Dairy Insti-tute, Juiz de Fora, MG, Brazil. The kinetics study of lactose crystallization in concenrated whey was performed in two stages (Figure 1).
The first stage was conducted using a bench--scale whey crystallizer with dry matter concentrations of 43 % w/w, 48 % w/w and 53 % w/w respectively. These concentra-tions were obtained from the dilution of non-demineralized skimmed whey powder and each treatment was repeated three times. Concentrations of dry matter in the whey powder were determined by gravimetric me-thods and the lactose level by the Cloramina T method (WOLFSCHOON-POMBO et al., 1982). Whey at the determined concentration of dry matter was transferred to a beaker and placed in a digital water bath (Sieger® mo del
“stern 6”) adjusted to 25 ºC coupled to the bench-top crystallizer, which consisted of a stainless steel agitator with rotation con-trol. After temperature stabilization at 25 ºC, 0.1% w/w whey powder was added un der con trolled agitation of 180 rotations per mi nu te (rpm). The concentration of soluble solids (ºBrix) was determined using a digi-tal refractometer (Reichert® model AR200,
New York, United States of America) after completing dilution and during the crystalli-zation process at 20 minute intervals until a total crystallization time of 280 minutes was reached. An overview of the methodology employed is presented in Figure 1. At this stage equations were determined relating the percentage of lactose crystallization to time, and variations in concentration of soluble solids during crystallization.
The second stage was undertaken in an industrial crystallizer using concentrated whole whey resulting from the production of coalho cheese without addition of starter. The industrial crystallizer consisted of a double jacketed stainless steel pan operating with agitation at 80 rpm. Concentration was performed in a single effect plate evaporator (Junior model, APV, São Bernardo do Cam-po, Brazil). Three treatments each repea-ted three times were studied during this stage: crystallization by primary nucleation, crystallization by secondary nucleation from
the addition of 0.05% w/w microcrystalline lactose and crystallization by secondary nu-cleation from the addition of 0.1% w/w mi-cro crystalline lactose.
The concentrated whey was removed from the vacuum evaporator at a temperature of 47 ºC and then cooled in an ice bath to 30 ºC with the intent of allowing natural nucleation.
After cooling, the whey was transferred to the industrial crystallizer under mechani-cal agitation (80 rotations per minute). After 120 minutes of crystallization the whey was slightly cooled until a the temperature of 24 ºC ± 2 ºC was reached. The total time es-ti mated for residence in the crystallizer was 210 minutes.
To determine the percentage of crys-tallization, equation 1 was used as suggested by Westergaard (2001).
%crystallization = (B1 - B2) x 9500 x 100
L x TDM x (95 - B2) (Eq. 1) B1 = initial Brix (time zero); B2 = final ºBrix
(after crystallization); L = % lactose in the Total Dry Extract; TDM = % Total Dry Matter
The concentrations of soluble solids (ºBrix) were determined after evaporation under vacuum, during cooling and crys talli-zation, at 30 minute intervals in the in dustrial crystallizer from time zero until 210 minutes, using a digital refractometer. The average size of the lactose crystals was determined by means of optical microscopy using an optical microscope (Nova® model 107, São Paulo,
Brazil) and the MSI Ima Win program image analysis while the whey remained in the in-dustrial crystallizer, employing the technique reported by Martinez et al. (1990). The fit of the first order reaction model was evaluated by linear regression of the natural logarithm of the ratio between the final concentration
of the lactose in water and the initial concen-tration, as a function of time. The fit of the second order reaction model was evaluated by the linear regression of the inverse of the final concentration of lactose in water with time. The correlation coeffi cients of the fitted models (R2), Pearson correlation coefficients
for parametric analysis of correlation between variables (PCC) and the coe ffi cients of sta-tistical significance of the proposed models (P) were determined in order to evaluate the proposed equations in the experiment. The correlation coefficients whose significance level was equal to or greater than 0.05 were taken into account. The MICROCAL 5.0 software (1997) was used for the statistical analysis of the results. The kinetics study of the crystalliza tion process was performed at this stage. Data were analyzed using descripti-ve statistics, analysis of variance with the Tukey test to compare means “a posteriori” and Student’s t-test to compare means of paired data.
RESULTS AND DISCUSSION
The physico-chemical composition of the whey powder used in the first phase of the experiment was 93.6% w/w of water and 71.4% w/w of lactose. The average variation in soluble solids during crystallization were fitted to a second degree polynomial model and equations 2, 3 4 were obtained:
ºBrix43% = - 0.0001 (T)2 + 0.013 (T) + 41.858 (Eq. 2) (R2 = 0.9875, PCC = - 0.893 and P < 0.0001) ºBrix48% = 0.0001 (T)2 - 0.0721 (T) + 47.752 (Eq. 3) (R2 = 0.9852, PCC = - 0.973 and P < 0.0001)
ºBrix53% = 0.0002 (T)2 - 0.1056 (T) + 50.955
(Eq. 4) (R2 = 0.9800, PCC = - 0.893 and P < 0.0001)
where ºBrixX% = concentration of soluble
so lids during crystallization of whey with X% of dry matter, T = time of crystallization in minutes, R2 = correlation coefficient of
the fitted model, PCC = Pearson correla-tion coefficient for parametric analysis of correlation between variables, and P = coeffi-cient of statistical significance.
It can be seen in equations 2, 3 and 4 that for the soluble solid concentrations tested that there was a negative correlation between ºBrix and time during crystallization in the whey that could be described by a second degree polynomial model. This result is important for the whey concentration and crystalliza-tion since measurement of soluble solids is a simple tool for industrial monitoring of crystallization as a function of time, and application of the equations can predict the time required for a desired reduction in this solids content at 25 ºC. According to equations 2, 3 and 4, at time zero the average content of soluble solids in the whey was 41.9 ºBrix
(whey with 43% of dry matter), 47.5 ºBrix (whey with 48% of dry matter) and 51.0 ºBrix (whey with 53% of dry matter).
The percentages of lactose crystalliza-tion during crystallizacrystalliza-tion of the whey at 25 ºC were fitted to a second degree polynomial model and equations 5, 6 and 7 were obtained: %CRL 43% = 0.0006 (T)2 - 0.0672 (T) - 1.3726 (Eq. 5) (R2 = 0.9848, PCC = 0.872 and P < 0.0001) %CRL 48% = - 0.0006 (T)2 + 0.3579 (T) - 4.7824 (Eq. 6) (R2 = 0.9853, PCC = 0.966 and P < 0.0001) %CRL 53% = - 0.0011 (T)2 + 0.483 (T) + 3.4382 (Eq. 7) (R2 = 0.9673, PCC = 0.897 and P < 0.0001)
where CRL X% = percentage of lactose crys-tallization during whey cryscrys-tallization with X% of dry matter, T = time of crystalliza tion in minutes.
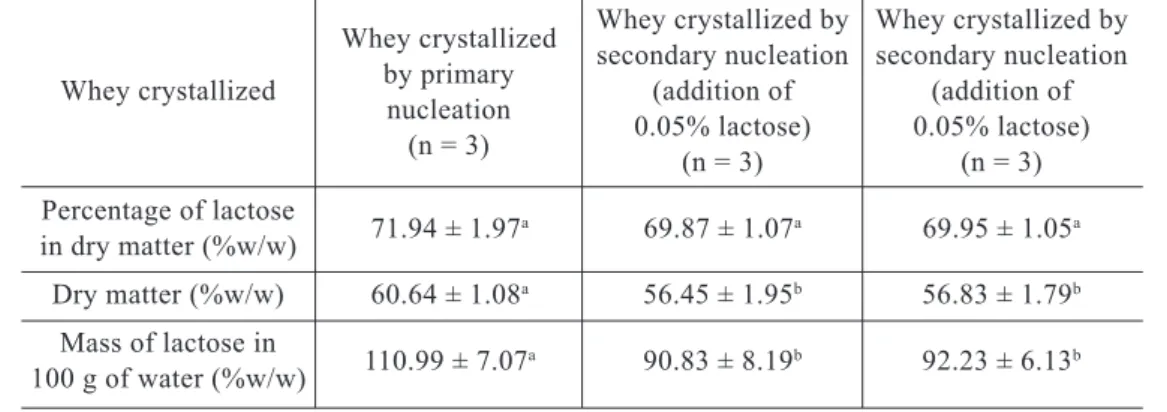
Table 1 – Composition of whole concentrated whey obtained by vacuum evaporation1
Whey crystallized by Whey crystallized by secondary nucleation secondary nucleation Whey crystallized (addition of (addition of
0.05% lactose) 0.05% lactose) (n = 3) (n = 3) Percentage of lactose 71.94 ± 1.97a 69.87 ± 1.07a 69.95 ± 1.05a in dry matter (%w/w) Dry matter (%w/w) 60.64 ± 1.08a 56.45 ± 1.95b 56.83 ± 1.79b Mass of lactose in 110.99 ± 7.07a 90.83 ± 8.19b 92.23 ± 6.13b 100 g of water (%w/w)
1 Means followed by the same letter do not differ significantly by Tukey test at 5% probability.
Whey crystallized by primary nucleation (n = 3)
Analysis of the equations 5, 6 and 7 shows that the higher the concentration of soluble whey solids, the faster and greater in magnitude the crystallization of lactose. These equations may be used to predict the time required for a desired percentage of crystallization at 25 ºC in skimmed whey. The average composition of whole concentrated whey by vacuum evaporation obtained in the second phase of the experiment is shown in Table 1.
The Tukey test applied to the percenta-ge of lactose in dry matter indicated that the means did not differ between treatments at the level of 5% probability. As with lactose mass levels in 100 g of water, the con cen-trations of dry matter presented means which varied significantly. The concentration of soluble whey solids was determined as the con centration of 57 ± 2 ºBrix, however the wide variations in concentrations of dry matter indicated that this control was not suffi cient to standardize product composi tion. Discon tinuous evaporation complicated stan-dardization of product composition and was responsible for the differences en coun tered in the average concentrations of dry matter and level of lactose in 100 grams of water. The average sizes of the lactose crystals at the end of crystallization are 62.2 ± 1.6 m for primary nucleation, 60.7 ± 5.9 m for se-condary nucleation with addition of 0.05% lactose and 63.8 ± 1.8 m for secondary nu -cleation with addition of 0.1% lac tose. Ave-rage size of lactose crystals did not vary sig-ni ficantly between treatments.
Mean crystal sizes did not differ at 5% probability, indicating that, independently of the type of nucleation applied and quantity of lactose added, the crystals always appeared to be the same size. The average sizes of the lactose crystals encountered in the concen tra-ted whey in the present experiment (between 60.7 m and 63.8 m) were in accordance with Schuck et al. (2010), who reported that
crystallization of concentrated whey by me-ans of intense spontaneous nucleation, accele-rated by the use of a flash cooler, produced lacto se crystals smaller than 100 m. After exiting the evaporator at 47 ºC, the concentra-ted whey was cooled in an ice bath to 30 ºC, in order to generate spontaneous and intense lactose nucleation. Average cooling time was 20 ± 2 minutes.
The crystallization process continued in the industrial crystallizer, and variation in the concentrations of soluble solids after exi ting the evaporator and finishing crystallization was determinate. Decreases in the concen-trations of solids during the entire crystalliza tion process were fitted to the second degree polynomial models presented by equations 8, 9 and 10 as: ºBrixPN = 0.0006 (T)2 - 0.1819 (T) + 58.5 (Eq. 8) (R2 = 0.9704, PCC = - 0.836 and P < 0.0001) ºBrix SN0.05 = 0.0005 (T)2 - 0.1884 (T) + 59.1 (Eq. 9) (R2 = 0.9738, PCC = - 0.894 and P < 0.0001) ºBrix SN0.1 = 0.0005 (T)2 - 0.1854 (T) + 59.2 (Eq. 10) (R2 = 0.9538, PCC = - 0.863 and P < 0.0001)
where ºBrixX = concentration of dry matter during crystallization of whey by treatment X (PN = primary nucleation, SN0.05 = secondary nucleation by the addition of 0.05% lactose and SN0.1 = secondary nu-cleation by the addition of 0.1% lactose), T = crystallization time in minutes.
The results indicated that, as for the crys tallization process studied in the first
phase of the experiment, there was a high negative correlation between soluble solid content with time of crystallization for the whole serum crystallized in the second phase. This is important technical information, since it is possible to utilize equations 8, 9 and 10 to estimate and control this stage in the indus-trial setting using the attributes established in this study.
The percentages of crystallization were fitted to the second order polynomial models and the resulting equations 11, 12 and 13 are as follows: %CRLPN = - 0.0024 (T)2 + 0.7821 (T) + 4.4952 (Eq. 11) (R2 = 0.9549; PCC = 0.814 and P < 0.0001) %CRLSN0.05 = - 0.0026 (T)2 + 0.8999 (T) + 2.0335 (Eq. 12) (R2 = 0.9651; PCC = 0.865 and P < 0.0001) %CRLSN0.1 = - 0.0025 (T)2 + 0.8567 (T) + 5.3786 (Eq. 13) (R2 = 0.9557; PCC = 0.845 and P < 0.0001)
where CRL X% = percentage of lactose crys tallization during whey crystallization by treat ment X (PN = primary nucleation, SN0.05 = secondary nucleation through the addition of 0.05% lactose and SN0.1 = se-condary nu cleation through the addition of 0.1% lac tose), T = crystallization time in minutes.
The average values of total crystalli-za tion per treatment are 61.9 ± 7.5% for pri-mary nucleation, 74.1 ± 4.0% for secondary nucleation with addition of 0.05% lactose and 73.8 ± 2.2% for secondary nucleation with addition of 0.1% lactose. It can be seen from
this results and by equations 11 to 13 that the treatments in which the addition of lactose nuclei resulted in greater crystallization than in the process using primary nucleation, there was stabilization of the process between 150 and 200 minutes of crystallization regardless of the treatment used, i.e., the percentage of crystallization tended to remain constant. The crystallization percentages encountered for whole whey were in accordance with those reported in the literature for the pro-cessing of skimmed whey with crystallization after vacuum evaporation (SCHUCK et al., 2004; WESTERGAARD 2001). According to Písecký (1997), whey must present 70% lac to se crys tallization in order to achieve high qua lity dried whey, and this can be only be achieved in experimental in conditions em ploying secondary nucleation. According to the results of the T-test relating the per-centage of crystallization and the quantity of added lactose, it is possible that there is no significant difference regarding the percenta-ge of crystallization (T-test = 0.904609).
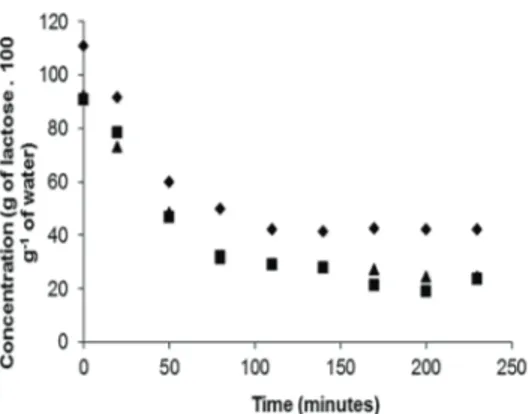
Equations 11, 12 and 13 which esta-blish the relationship between the percentage of crystallization and crystallization time for the concentrated whole whey should be of high practical value, since they provide for estimation and control of the industrial process, in accordance with the attributes established in the experiment. When applying equations 12 and 13 for the whey crystallized by secondary nucleation in order to estimate the minimum time necessary to crystalli-ze 70% of the lactose, a minimum time of 234.8 minutes after exiting the evaporator was revealed. Based on the physico-chemical composition of the whey and awareness of the percentage of lactose crystallization during the crystallization period, it is possible to de-termine lactose mass per 100 grams of water during the entire process, (Figure 2).
Figure 2 – Relationship between crystallization
time and lactose mass in 100 grams of water in concentrated whey
where: triangle = whey with 53% of dry matter, square = whey with 48% of dry matter and diamond = whey with 43% of dry matter.
From Figure 2 it can be seen that, al-though whey crystallized by primary nuclea-tion possesses a greater initial concentranuclea-tion of lactose in water, crystallization is not as effective as that produced by secondary nu-cleation. This shows that a greater quantity of lactose remains in solution without the presence of crystallization nuclei, demons-trating super-saturation.
The findings presented in Figure 2 were fitted to the second order polynomial model and equations 14, 15 and 16 were obtained as follows: CLPN = 0.0027 T 2 - 0.868 T + 106.01 (Eq. 14) (R2 = 0.9549, PCC = 0.814 and P < 0.0001) CLSN0.05 = 0.0024 T 2 - 0.8174 T + 88.97 (Eq. 15) (R2 = 0.9651, PCC = 0.865 and P < 0.0001) CLSN0.1 = 0.0023 T 2 - 0.7902 T + 87.259 (Eq. 16) (R2 = 0.9557, PCC = 0.845 and P < 0.0001)
where CL X% = lactose concentration (g.100 g-1 of water) in the concentrated whole whey
during crystallization X, PN = primary nu-cleation, SN0.05 = secondary nucleation through the addition of 0.05% lactose and SN0.1 = secondary nucleation through the addition of 0.1% lactose, T = crystallization time in minutes.
The second order polynomials repre-sented by equations 14, 15 and 16, which describe how the lactose concentration de-creases in water during crystallization, may be used for determination of the infinitesimal variation in rate of concentration with time, i.e., the instantaneous rate by which the crys-tallization process occurs, and thus primary derivation of the polynomials was performed and equations 17, 18 and 19 were obtained: (dclPN/dT) = 0.0054 T – 0.868 (Eq. 17) (dclSN0.05/dT) = 0.0048 T – 0.8174 (Eq. 18) (dclSN0.1/dT) = 0.0046 T – 0.7902 (Eq. 19) where (dCLX/dT) = is the first order derivative in relation to time (T) of the function which describes how lactose concentration decreases with time during crystallization when using treatment X.
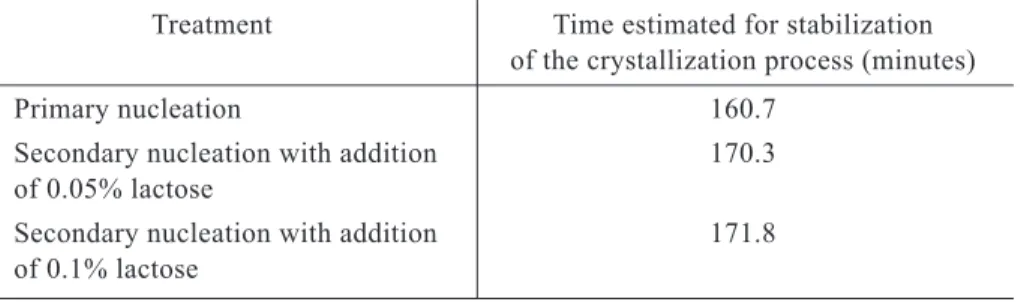
When attributing a value of zero to the time derivative of lactose concentration in water, equations 17, 18 and 19 are obtained at the moment at which the crystallization process tends to stabilize, where values are presented in Table 2. Table 2 shows that crys tallization of whole whey by primary
nu cleation stabilizes faster than that achieved by means of secondary nucleation. The infi-nitesimal rate of change in lactose in water for the PN treatment at time zero was - 0.868 g lactose. 100 g-1 of water. For the SN0.05 and
SN0.1 treatments, it was - 0.817 g lactose. 100 g-1 of water and -0.790 g lactose. 100 g-1
of water, respectively. Therefore, the PN treat ment began a more intense crystallization pro cess, but it stabilized more rapidly due to the absence of secondary nuclei. This result was reinforced in the case of the experiment presented here, since the treatment emplo-ying primary nucleation utilized whey with a greater concentration of lactose in water, and nevertheless the percentage of lactose crystallized was lower and the process stabi-lized first.
During the bench-scale experiment it was concluded that crystallization was most effective when employing higher
concen-trations of soluble solids, but all the whey samples studied received the same addition of crystallization nuclei.
The experimental data were fitted to the first order reaction and second order reaction models. The first order reaction model was evaluated by linear regression between the natural logarithm of the relationship of final concentration of lactose in water and the initial concentration over time, presented by equations 20, 21 and 22. LNPN = - 0.0059 T - 0.1680 (Eq. 20) (R2 = 0.8382, PCC = - 0.916 and P = 0.0038) LNSN0.05 = - 0.0085 T - 0.1147 (Eq. 21) (R2 = 0.9207, PCC = - 0.960 and P = 0.0006)
Table 2 – Estimated time for stabilization of the crystallization process of whole whey under
the experimental conditions
Treatment Time estimated for stabilization of the crystallization process (minutes) Primary nucleation 160.7
Secondary nucleation with addition 170.3 of 0.05% lactose
Secondary nucleation with addition 171.8 of 0.1% lactose
Table 3 – Real half-lives for crystallization calculated by the first order model
Treatment Calculated half-life (min) Real half-life (min) Error (%)
PN1 117.5 76.3 53.9
SN 0.052 81.5 66.1 23.3
SN 0.13 92.4 64.0 44.4
1,2,3 PN = primary nucleation; SN 0.05 = secondary nucleation through addition of 0.05% w/w lactose to the
concentrated whey; SN 0.1 = secondary nucleation through addition of 0.1% w/w lactose to the tra ted whey.
LNSN0.1 = - 0.0075 T - 0.1853
(Eq. 22) (R2 = 0.8550, PCC = - 0.960 and P = 0.0029)
where LNx = natural logarithm of the ratio between the final concentration of lactose in water and the initial concentration of treat-ment X, PN = primary nucleation, SN0.05 = secondary nucleation through the addition of 0.05% lactose and SN0.1 = secondary nucleation through the addition of 0.1% lac-tose, T = time.
The calculated lives and real half-lives obtained in the experiment are presented in Table 3.
If lactose crystallization in whole whey is considered as a first order reaction, the half-life of crystallization can be calcula ted through the ratio between - 0.693 and the respective angular coefficients of equations 20, 21 and 22.
On the basis of the results presented in Table 3, the prediction capacity of the first order reactions for the crystallization process of concentrated whole whey is poor, as shown by the high percentages of error encountered.
Crystallization thus does not fit the mo-del of first order reactions. Evaluation of the second order reactions model was evaluated by linear regression of the inverse of final lactose concentration in water over time,
presented by equations 23, 24 and 25.
(Cf) -1 PN = 0.00009 T + 0.0106 (Eq. 23) (R2 = 0.8786, PCC = 0.870 and P = 0.00183) (Cf) -1 SN0.05 = 0.0002 T + 0.0108 (Eq. 24) (R2 = 0.9624, PCC = 0.981 and P < 0.0001) (Cf) -1 SN0.1 = 0.0002 T + 0.0128 (Eq. 25) (R2 = 0.8969, PCC = 0.947 and P = 0.0012)
where (Cf) -1x =inverse of the final lactose
concentration in water for treatment X, T = crystallization time in minutes.
If lactose crystallization in whole whey is considered as a second order reaction, then the crystallization half-life can be calcula-ted by the inverse of the product of the initial lactose concentration in water and the respective angular coefficients of equa tions 23, 24 and 25. The calculated and real half-life times obtained in the experiment are presen-ted in Table 4.
On the basis of the results presented in Table 4 the prediction capacity of the model
Table 4 – Real half-lives for crystallization and those calculated by the second order model
Treatment Calculated half-life (min) Real half-life (min) Error (%)
PN1 100.1 76.3 31.2
SN 0.052 55.0 66.1 16.7
SN 0.13 54.2 64.0 14.8
1,2,3 PN = primary nucleation; SN 0.05 = secondary nucleation through addition of 0.05% w/w lactose to the
concentrated whey; SN 0.1 = secondary nucleation through addition of 0.1% w/w lactose to the tra ted whey.
of second order reactions for crystallization of concentrated whole whey is also poor, as indicated by the high percentages of error encountered. Crystallization thus does not fit the second order reaction models.
CONCLUSIONS
Crystallization of skimmed whey at 25 ºC in a bench scale crystallizer through addition of whey powder as crystallization nuclei showed that the higher the concen-tra tion of soluble solids in the whey, the faster and more intense the occurrence of crys tallization. Mathematical relationships were established between the crystallization time of the skimmed milk at 25 ºC and the concentration of soluble solids and percenta-ge of lactose crystallization as variables.
The type of nucleation used for crystalli-zation of whey concentrated by vacuum evaporation in an industrial crystallizer had no significant effect on lactose crystal size. The average size of the crystals remained between 60.7 m and 63.8 m, in agreement with values encountered in literature.
Crystallization of concentrated whole whey by vacuum evaporation in an indus trial crystallizer by cooling from 47 ºC to 24 ºC was greater in the secondary nucleation pro-cess than in primary nucleation, the propro-cess in which crystallization stabilized first. Only by the addition of lactose nuclei was it possi-ble to obtain crystallization greater than 70%. Mathematical equations which inde-pendently relate the crystallization time of concentrated whole whey to levels of solu-ble solids, percentage of crystallization and mass of lactose in water were established so that they could be used industrially for pro-cessing of whey, according to the condi tions established in the experiment.
The kinetics of crystallization of con-centrated whole whey are not adequately described by the models of first and second order reactions.
ACKNOWLEDGMENTS
This work was financially supported by The State of Minas Gerais Foundation of Support to Research (FAPEMIG), CNPq and CAPES.
REFERENCES
FOX, P. F.; McSWEENEY, P. L. H. Dairy Chemistry and Biochemistry. 1ª ed. London:
Blackie Academic Professional, 1998. 478 p. HYND. J. Drying of whey. Journal of thhe Society of Dairy Technology, v. 33, n. 2, p.
52-55, 1980.
DAS, D., HUSNI, H. A., LANGRISH, T. A. G. The effects of operating conditions on lactose crystallization in a pilot-scale spray dryer. Journal of Food Engineering, v. 100,
p. 551-556, 2010.
CHIOU, D.; LANGRISH, T. A. G.; BRAHAM, R. The effect of temperature on the crystalli-nity of lactose powders produced by spray drying. Journal of Food Engineering, v. 86,
p. 288-293, 2008.
LANGRISH, T. A. G. Assessing the relative tendency of different materials to crystallize in spray drying: A comparison between sodium chloride and lactose. Journal of Food Engineering, v. 91, p. 521-525, 2009.
DAS, D., LANGRISH, T. A. G. An activated-state model for the prediction of solid-phase crystallization growth kinetics in dried lacto-se particles. Journal of Food Engineering,
v. 109, p. 691-700, 2012.
INTERNATIONAL DAIRY FEDERATION (IDF) Dried milk and dried milk products: Determination of total solids content.
KELLER, K. A.; CHEMMINIAN, R. Prati-cal considerations for profitable production of lactose and permeate powders. In: PRO-CEEDINGS OF THE INTERNATIO NAL DAIRY FEDERATION SYMPO SIUM: LACTOSE AND ITS DERIVATES, 2007, Moscou, Russia. Anais... Moscou: IDF, 2007.
1 CD-ROM.
MARTINEZ, E., HOUGH, G., CONTARINI, A. Sandiness prevention in dulce de leche by seeding with lactose. Journal of Dairy Science, v. 73, n. 3, p. 612-616, 1990.
MASTERS, K. Spray drying in practices.
Denmark: Spray Dry Consult International ApS, 2002. 464p.
MICROCAL ORIGIN 5.0, 1.0.0.1 (1997). Microgal Software, Inc. United States. NÝVLT, J.; HOSTOMSKÝ, J.; GIULIETTI,
M. Cristalização. São Carlos: UFSCar/IPT,
2001. 160 p.
PÍSECKÝ, I. J. (1997). Handbook of milk powder manufacture. 1ª ed. Compenhagen:
Niro, 1997. 261 p.
SCHUCK, P. et al. Séchage des lactosérums et dérives: rôle du lactose et de la dynamique de l’eau. Le Lait, v. 84, p. 243-268, 2004.
SCHUCK, P.; JEANTET, R.; CARVALHO, A. F. (2010). Lactose Crystallization and drying of whey. Notas de classe do curso
de ciência e tecnologia de leite ministrado na Universida-de Federal de Viçosa. Viçosa: UFV, 2010.
WESTERGAARD, V. Milk powder Tech no-logy Evaporation and Spray Drying. 5ª ed.
Copenhagen, Niro, 2004. 337 p.
WOLFSCHOON-POMBO, A., CASA-GRANDE, M. Determinação simultânea de lactose e sacarose em doce de leite. Revista do Instituto de Laticínios Cândido Tostes,