Diverse Geno- and Phenotypes of Persistent Listeria monocytogenes Isolates
from Fermented Meat Sausage Production Facilities in Portugal
䌤
V. Ferreira,
1,2J. Barbosa,
1M. Stasiewicz,
2K. Vongkamjan,
2A. Moreno Switt,
2T. Hogg,
1P. Gibbs,
1P. Teixeira,
1and M. Wiedmann
2*
CBQF/Escola Superior de Biotecnologia, Universidade Cato
´lica Portuguesa, Porto, Portugal,
1and
Department of Food Science, Cornell University, Ithaca, New York
2The persistence of Listeria monocytogenes in food-associated environments represents a key factor in
trans-mission of this pathogen. To identify persistent and transient strains associated with production of fermented
meat sausages in northern Portugal, 1,723 L. monocytogenes isolates from raw material and finished products
from 11 processors were initially characterized by random amplification of polymorphic DNA (RAPD),
PCR-based molecular serotyping, and epidemic clone characterization, as well as cadmium, arsenic, and
tetracycline resistance typing. Pulsed-field gel electrophoresis (PFGE) typing of 240 representative isolates
provided evidence for persistence of L. monocytogenes for periods of time ranging from 10 to 32 months for all
seven processors for which isolates from different production dates were available. Among 50 L. monocytogenes
isolates that included one representative for each PFGE pattern obtained from a given sample, 12 isolates
showed reduced invasion efficiency in Caco-2 cells, including 8 isolates with premature stop codons in inlA.
Among 41 isolates representing sporadic and persistent PFGE types, 22 isolates represented lysogens. Neither
strains with reduced invasion nor lysogens were overrepresented among persistent isolates. While the
suscep-tibility of isolates to lysogenic phages also did not correlate with persistence, it appeared to be associated with
molecular serotype. Our data show the following. (i) RAPD may not be suitable for analysis of large sets of L.
monocytogenes isolates. (ii) While a large diversity of L. monocytogenes subtypes is found in Portuguese
fermented meat sausages, persistence of L. monocytogenes in this food chain is common. (iii) Persistent L.
monocytogenes strains are diverse and do not appear to be characterized by unique genetic or phenotypic
characteristics.
Listeria monocytogenes is a facultative intracellular
food-borne pathogen capable of causing a disease known as
listeri-osis in humans and a wide range of animals (10, 60, 62). L.
monocytogenes is not only present in a variety of different
environments, but it also has the ability to grow at refrigeration
temperatures (70), in a wide pH range (approximately 4 to 9.6)
(53, 54), and at high salt concentrations (up to 10%) (41).
Despite the implementation of intensive control measures,
eradication and control of L. monocytogenes in food processing
environments remain considerable challenges. Several studies
indicate that the most important source of food contamination
with L. monocytogenes is via cross-contamination from the
equipment and general environment of the processing plants,
where some L. monocytogenes strains can persist over extended
periods, while others are recovered only sporadically (30, 33,
37, 38, 44, 47). While several authors attempted to identify
specific characteristics, e.g., biofilm formation or sanitizer
re-sistance capabilities, that may be associated with L.
monocyto-genes persistence in processing plants (1, 6, 39, 49), little
at-tention has been given to the potential contributions of
prophages to the ability of L. monocytogenes to establish
per-sistence. In many pathogens, these bacterial viruses are
recog-nized as important contributors to virulence, in the form of
bacterial lysogens, or as vectors in horizontal gene transfer; in
addition, the presence of prophages may also confer resistance
to certain phages (7, 8).
Meat preserved in the form of fermented sausages is typical
in the rural areas of Portugal and can have a positive economic
impact in these areas. Previous studies of different traditional
fermented meat sausages produced in northern Portugal (i.e.,
alheira, salpica
˜o de Vinhais, and chouric
¸a de Vinhais) showed
that these products are often contaminated with L.
monocyto-genes. Frequent contamination and high counts of L.
monocy-togenes have been reported in the finished products for alheira
(17, 19), and in the production stages of salpica
˜o de Vinhais
and chouric
¸a de Vinhais, but not in the finished products.
These differences are probably due to differences in
process-ing, including the fact that the production of salpica
˜o de
Vin-hais and chouric
¸a de Vinhais involves a longer smoking process
(3 to 4 weeks) and entails less handling and manual labor than
the production of alheira does (18). Briefly, for production of
alheira, various meats are boiled in water with salt and spices,
and thinly sliced bread, soaked in the broth formed during
boiling the meat, is added to the mixture of small meat pieces,
spices, and olive oil and/or fat drippings. The resulting paste is
stuffed into the intestinal casings of cattle and submitted to a
smoking process, usually for no longer than 8 days. Alheira
must be cooked before consumption. The essential ingredients
of chouric
¸a de Vinhais and salpic
¸a
˜o de Vinhais include raw
pork meat from Bísaro, an autochthonous pig breed, salt,
spices, and regional wine. The process for making these
sau-* Corresponding author. Mailing address: Department of Food
Sci-ence, Cornell University, Ithaca, NY 14853. Phone: (607) 254-2838.
Fax: (607) 254-4868. E-mail: [email protected].
sages includes an initial seasoning stage (48 h at 4°C), stuffing
the mixture into natural pork casings, and a final stage of
curing by traditional smoking at 20 to 30°C for approximately
3 weeks for chouric
¸a and 4 weeks for salpica
˜o. In the
produc-tion of salpica
˜o, only pork loin meat is used and stuffed into
large intestines, while in chouric
¸a, meat and pork fat are used
and stuffed into small intestines. These products are typically
consumed without further cooking. The aim of this study was
to characterize a collection of 1,723 L. monocytogenes isolates
recovered from traditional northern Portuguese fermented
meat sausages in order to (i) assess genetic diversity of L.
monocytogenes found in these types of products, (ii) evaluate L.
monocytogenes contamination patterns in the production of
these products, and (iii) investigate selected genetic and
phe-notypic characteristics of L. monocytogenes strains identified as
persistent.
MATERIALS AND METHODS
Isolate information. Overall, a total of 1,723 L. monocytogenes isolates
obtained from either (i) traditional fermented meat sausages (final products) from northern Portugal or (ii) raw products and products at different stages of processing were included in this study. Samples of traditional fermented meat sausages (finished products), representing products from 11 processors (processors A to K; Tables 1 and 2), were collected either at retail establish-ments or at processing plants. For 7 processors, only isolates from finished product samples were tested (Table 1), including four processors where isolates were obtained from samples collected on two different dates (be-tween 14 and 32 months apart). Some of these sampling data have previously been reported in a study by Ferreira et al. (19), which did not include any isolate characterization (Table 1).
For four processors (processors B, C, G, and I; Table 2), L. monocytogenes isolates recovered at different processing stages of alheira production (3 proces-sors) and at different processing stages of alheira, salpica˜o de Vinhais, and chouric¸a de Vinhais production (one processor) were used. For two of these processors, isolates from samples collected on three sampling dates were avail-able, while for two processors, isolates from samples collected on two sampling
TABLE 1. Subtype patterns for L. monocytogenes isolates from processors where only final products were tested
Processor and producta Sampling date (mo-yr)b No. of isolates with a specific subtype Molecular serotype group EC marker(s)c Resistance
patternd RAPD type(s) (no. of isolates) No. of isolates for further PFGE characterization PFGE profile(s) of isolates further characterized Processor A
Alheira (P; n⫽ 130)** May-04 127 D ECI⫺, ECII⫺ Cds
Asr Tets a (79), b (14), c (12), d (7), e (3), f (3), g (3), h (3), i (1), j (1), k (1) 16 358, 383 2 B NT CdrAssTets b (2) 1 346
1 D ECI⫺, ECII⫺ CdrArrTets m (1) 1 362
Alheira (P; n⫽ 40)** Jul-05 21 D ECI⫺, ECII⫺ Cds
Ass Tets a (9), b (7), g (4), n (1) 4 358 15 B NT Cdr Ass Tets l (11), o (4) 2 346
3 D ECI⫺, ECII⫺ CdrAsrTets l (2), o (1) 3 358
1 B CdsAssTets p (1) 1 346
Processor D
Alheira (P; n⫽ 38)** May-04 28 A ECIII⫺ CdrAssTets a (13), b (1), c (14) 5 356
8 B NT Cdr Ass Tets d (7), e (1) 3 372, 346 2 D ECI⫺, ECII⫺ Cds Asr Tets f (2) 2 358
Alheira (P; n⫽ 13)** Jul-05 12 A ECIII⫺ CdrAssTets a (12) 2 356
1 D ECI⫺, ECII⫺ CdsAsrTets g (1) 1 384
Processor E
Alheira (R; n⫽ 8)* Sep-03 7 B NT CdrAssTets a (7) 2 344, 380
1 D ECI⫺, ECII⫺ Cds Ass Tets b (1) 1 379 Alheira (R; n⫽ 12)** Mar-05 12 B NT Cdr Ass Tets c (12) 2 344 Processor F
Alheira (R; n⫽ 61)** May-04 53 D ECI⫹ Cdr
Ass Tets a (53) 2 360 4 A ECIII⫺ CdrAssTets e (2), f (1), g (1) 4 342 3 D ECI⫹ CdsAssTets a (1), b (1), c (1) 3 367, 360 1 D ECI⫹ Cdr Asr Tets d (1) 1 360 Alheira (P; n⫽ 7)** Jan-07 6 B NT Cdr Ass Tets h (4), i (2) 3 373 1 D ECI⫹ CdrAssTets a (1) 1 360 Processor H
Alheira (P; n⫽ 19)* Sep-03 16 B NT CdrAssTetr a (15), b (1) 5 352, 371, 378
2 D ECI⫺, ECII⫺ CdrAssTetr b (1), c (1) 2 377
1 A ECIII⫺ Cdr Ass Tets d (1) 1 376 Processor J Alheira (P; n⫽ 136)** May-04 129 C NT Cdr Ass Tets a (127), b (2) 6 361 7 C NT Cds Ass Tets a (4), c (1), d (1), e (1) 6 361 Processor K
Alheira (P; n⫽ 3)* May-04 3 D ECI⫺, ECII⫺ Cdr
Ass Tetr
a (2), b (1) 3 362
aL. monocytogenes prevalence data for some samples (processor A, 2005; processor D, 2005; processor E, 2005; processor K) have been reported previously by Ferreira et al. (19); in addition, characterization of a subset of isolates from some samplings (processor A, 2004; processor D, 2004; processor E, 2003; and processor H and processor J) have been reported previously by Felı´cio et al. (17). Samples were collected either at processing plants (P) or retail stores (R) as indicated at the beginning of the parentheses (the number of samples is shown by n). For each processor and each time point, two composite samples were tested for L. monocytogenes, and isolates from all positive samples were further characterized; the number of the two composite samples that were positive for L. monocytogenes is indicated by the number of asterisks.
bThe sampling dates are shown in an abbreviated month-year form (e.g., May-04 stands for May 2004).
cIsolates with molecular serotypes B and C were not tested (NT) for epidemic clone (EC) markers, as these groups do not contain EC strains. ECI⫺, epidemic clone I negative; ECI⫹, epidemic clone I positive.
dates were available (Table 2); some of these sampling data have previously been reported in a study by Ferreira et al. (18, 19).
While sample collection and L. monocytogenes isolation for some samplings that provided isolates for this study have previously been reported (Tables 1 and 2), isolates from additional sample collections conducted as part of the study reported here were also used (Tables 1 and 2). L. monocytogenes isolation for these samples was performed essentially as described previously (17) using an approach that included selective enrichment in Fraser broth as well as enumer-ation of L. monocytogenes by 5-tube most-probable-number (MPN) and direct plating (see reference 17 for details on the methodology). For all products (e.g., finished product and product at different stages of processing), two samples were tested (except for some samples from processor I [see Table 4]); for finished products, each sample tested represented aliquots from 6 different sausages. For each testing procedure (i.e., MPN, direct plating, and enrichment) that yielded
presumptive Listeria colonies on PALCAM medium (17), five presumptive
Lis-teria colonies were used to determine whether they actually were L. monocyto-genes; for MPN, up to 5 colonies from each tube that yielded presumptive Listeria
colonies were tested. All confirmed L. monocytogenes isolates obtained by this approach (i.e., 1,723 isolates) were used here for initial subtype characterization by random amplification of polymorphic DNA (RAPD), PCR-based molecular serotyping, epidemic clone characterization, and cadmium, arsenic, and tetracy-cline resistance typing (as detailed below). For some samplings (indicated in Tables 1 and 2), a small number of isolates (i.e., approximately 10% of isolates obtained from a given sample) have previously been characterized by selected molecular subtyping methods (see reference 17); these isolates were not included among the isolates characterized here.
RAPD-PCR.Bacterial lysates for random amplification of polymorphic DNA
were prepared by growing bacteria for 12 to 16 h in brain heart infusion (BHI)
TABLE 2. Subtype patterns for L. monocytogenes isolates from processors where final products and samples from
different processing stages were tested
Processor and producta
Sampling date (mo-yr) No. of isolates with a specific subtype Molecular serotype group EC markerb Resistance pattern RAPD type(s) (no. of isolates) No. of isolates for further PFGE characterization PFGE profile(s) of isolates further characterized
Processor B
Alheira (R; n
⫽ 96)**
Nov-03
92
B
NT
Cd
rAs
sTet
sa (80), b (8), c (2), d (2)
6
349
4
B
NT
Cd
sAs
sTet
sc (2), d (1), e (1)
3
369, 370, 374
Alheira production
(P; n
⫽ 151)
Mar-05
66
B
NT
Cd
rAs
sTet
sa (46), b (11), c (3), d (2),
e (2), f (1), g (1)
11
349, 370
63
A
ECIII
⫺ Cd
rAs
sTet
si (45), j (10), k (3), l (2),
m (2), n (1)
9
365
11
D
ECI
⫹
Cd
rAs
rTet
sb (3), q (3), g (2), r (1),
s (1), t (1)
6
368
6
D
ECII
⫹
Cd
sAs
sTet
sa (4), o (1), p (1)
3
385
2
A
ECIII
⫺ Cd
rAs
rTet
si (2)
2
365
1
B
NT
Cd
sAs
sTet
sh (1)
1
349
1
B
NT
Cd
rAs
rTet
sh (1)
1
349
1
D
ECI
⫹
Cd
rAs
sTet
sb (1)
1
368
Processor C
Alheira (P; n
⫽ 151)** May-04
47
D
ECII
⫹
Cd
sAs
sTet
sa (20), b (11), c (6), d (3),
e (2), f (3), g (2)
10
130
14
B
NT
Cd
rAs
sTet
sa (3), h (5), i (4), j (2)
6
359, 382
Alheira production
Apr-05
42
D
ECII
⫹
Cd
sAs
sTet
sm (34), n (5), o (2), p (1)
7
130
(P; n
⫽ 62)
20
D
ECI
⫹
Cd
rAs
sTet
sq (20)
2
381
Alheira production
Jan-07
489
D
ECII
⫹
Cd
sAs
sTet
s33 unique patterns
53
130
(P; n
⫽ 522)
31
B
NT
Cd
rAs
sTet
s2 unique patterns
3
344
2
B
NT
Cd
sAs
sTet
s1 unique pattern
2
373
Processor G
Alheira (R; n
⫽ 47)**
Dec-04
24
D
ECI
⫹
Cd
sAs
sTet
sa (22), b (1), c (1)
3
360
23
D
ECI
⫹
Cd
rAs
sTet
sa (21), e(1), d (1)
3
360
Alheira production
Dec-06
84
D
ECI
⫹
Cd
rAs
sTet
sf (83), g (1)
5
360
(P; n
⫽ 107)
13
D
ECI
⫹
Cd
sAs
sTet
sf (13)
3
360
10
B
NT
Cd
rAs
sTet
sf (10)
2
373
Processor I
Alheira production
(P; n
⫽ 149)
Jul-05
149
A
ECIII
⫺ Cd
rAs
sTet
sa (146), b (3)
7
356
Chouric
¸a de Vinhais
Jul-05
25
C
NT
Cd
rAs
sTet
sc (25)
production
5
C
NT
Cd
sAs
sTet
sc (5)
2
375
(P; n
⫽ 30)
Salpica
˜o de Vinhais
Jul-05
13
C
NT
Cd
rAs
rTet
sc (13)
2
375
production
12
C
NT
Cd
rAs
sTet
sc (11), e (1)
2
375
(P; n
⫽ 31)
4
A
ECIII
⫺ Cd
rAs
sTet
sd (4)
1
356
2
C
NT
Cd
sAs
sTet
sc (2)
1
375
aSamples represented either finished products (labeled “alheira”), collected at processing plants (P) or retail stores (R), or samples from various stages of processing, collected at processing plants (P); these samples are indicated by the word “production” after the product name. For finished products, two composite samples were tested for L. monocytogenes for each processor and each time point, and isolates from all positive samples were further characterized. The number of the two composite samples that were positive for L. monocytogenes is indicated by the number of asterisks. For samples from various stages of processing, detailed descriptions are provided in Table 4. L.
monocytogenes prevalence data for some samples (processor G, 2004; processor I, samples of salpica˜o de Vinhais and chouric¸a de Vinhais, 2005) have been reported previously by Ferreira et al. (18); in addition, characterization of isolates from some samplings (processor B, 2003; processor C, 2004) have been reported previously by Felı´cio et al. (17).
broth at 37°C, followed by centrifugation of a 1-ml aliquot of the resulting culture at 16,250⫻ g for 5 min. The resulting cell pellet was washed two times in 0.9% (wt/vol) saline solution and resuspended in 500l of sterile distilled water. After the suspensions were boiled at 100°C for 15 min, they were diluted with water to an A600of 0.75. RAPD-PCR was performed with 1l of the cell lysate in a 25-l reaction mixture containing 1⫻ Taq buffer (MBI Fermentas, Mundolsheim, France), 2.5 mM MgCl2(MBI Fermentas), 0.2 mM (each) deoxynucleotides (ABGene, Surrey, United Kingdom), and 1 U of Taq polymerase (MBI Fermen-tas). For each isolate, separate RAPD-PCRs were performed with either primer UBC 155 (5⬘-CTG GCG GCT G-3⬘) (16) or primer OPM-01 (5⬘-GTT GGT GGC T-3⬘) (34); these primers were used at final concentrations of 1.4 M and 1.96M, respectively. Amplification reactions were performed in a Thermocy-cler (Bio-Rad MyCyThermocy-cler and thermocyThermocy-cler firmware; both from Bio-Rad, Rich-mond, CA) using the following steps: (i) one cycle of 94°C for 2 min; (ii) 39 cycles, with 1 cycle consisting of 94°C for 1 min, 35.5°C for 2 min, and 72°C for 2 min; and (iii) a final cycle of 72°C for 10 min. The amplified products were resolved by electrophoresis on 1.5% agarose gels; a 100-bp PCR molecular ruler (Bio-Rad Laboratories) was used as a molecular size standard. The gels were photographed under UV transillumination. Initial clustering of RAPD patterns was performed with GelCompar II version 4.0 (Applied Maths, Sint-Martens-Latem, Belgium) using the unweighted-pair group matching algorithm and the Dice correlation coefficient. Using visual refinement, unique RAPD patterns for each primer were designated with a number; UBC 155 and OPM-01 patterns were also combined to yield a single RAPD profile, which was designated with a letter. The reproducibility of RAPD assays was assessed by preparing two inde-pendent cell lysates and performing RAPD-PCR (performed on different days) for approximately 10% of L. monocytogenes isolates, which were selected con-veniently to represent isolates from all processors; for both primers, RAPD profiles were found to consistently yield patterns with comparable main bands. There was variation in the minor bands, including differences in relative intensity and appearance or disappearance of bands; therefore, these low-intensity bands were not taken into consideration when the RAPD patterns were compared. RAPD typing of the L. monocytogenes positive-control strain NCTC 11994, which was included in every RAPD-PCR run, was consistently reproducible for both primers.
Molecular serotyping. Detection of serotype-specific marker genes for L.
monocytogenes strains was performed using a multiplex PCR assay previously
reported by Doumith et al. (13). This assay differentiates isolates into five major subtypes, each of which represents more than one serotype, including (i) subtype A (which includes serotypes 1/2a and 3a); (ii) subtype B (serotypes 1/2b, 3b, and 7); (iii) subtype C (serotypes 1/2c and 3c); (iv) subtype D (serotypes 4b, 4d, and 4e); and (v) subtype E (serotypes 4a and 4c).
Resistance to cadmium, arsenic, and tetracycline.Isolates were screened for resistance to cadmium (Cd), arsenic (As), and tetracycline (Tet) at concentra-tions of 75g ml⫺1, 500g ml⫺1, and 8g ml⫺1, as previously described (42, 69). Isolates were classified as resistant (r superscript) or sensitive (s superscript) to each compound, and results were combined to generate a unique resistance profile (e.g., if one isolate was resistant to cadmium and sensitive to arsenic and tetracycline, the results were expressed as CdrAssTets).
PCR screen for EC-associated genetic markers.A previously described
mul-tiplex PCR assay (9) was used to test all isolates for genetic markers for the three previously reported L. monocytogenes major epidemic clones (ECs). Only mo-lecular serotype D isolates were screened for epidemic clone I (ECI) and ECII genetic markers (as these two ECs represent serotype 4b strains), while only molecular serotype A isolates were screened for the ECIII genetic marker (as this EC represents a serotype 1/2a strain).
PFGE.A subset of 240 L. monocytogenes isolates, representing at least one
representative of each combined subtype pattern for each sample (Tables 1 and
2), was selected for further characterization by pulsed-field gel electrophoresis (PFGE); “combined subtype patterns” were based on RAPD, resistance typing, molecular serotyping, and EC determination. PFGE was performed according to the standard CDC PulseNet protocol (22) using restriction enzymes ApaI (Roche Molecular Biochemicals, Indianapolis, IN) and AscI (New England BioLabs, Ipswich, MA) and a CHEF Mapper XA (Bio-Rad Laboratories, Her-cules, CA). PFGE images for individual isolates were processed to enhance contrast and reduce background. Similarity clustering was performed with the Applied Maths BioNumerics version 3.5 software package (Applied Maths, Sint-Martens-Latem, Belgium), using the unweighted-pair group matching algorithm and the Dice correlation coefficient with a tolerance of 1.5% and an optimization of 1.5%. Classification of isolates into different ApaI and AscI patterns was visually validated. ApaI and AscI PFGE pattern data were used to assign a combined PFGE profile to each isolate; PFGE profiles were designated by numbers (e.g., 130). Isolate information and subtyping data are freely available through the Pathogen Tracker 2.0 database (http://www.pathogentracker.net).
Caco-2 cell invasion assays.Caco-2 cell invasion assays were performed as
previously described (46) with minor adjustments. A standard laboratory control strain of L. monocytogenes (10403S) and an isogenic⌬inlA strain were included as controls in each invasion assay (Table 3). At least two independent invasion assays were performed for each isolate. Results were reported as percent inva-sion efficiency (i.e., number of bacteria recovered/number of bacteria inocu-lated), normalized to the values obtained for the control strain 10403S (set at 100%).
inlA sequencing.L. monocytogenes isolates that showed Caco-2 cell invasion
efficiencies of⬍20% (relative to the control strain 10403S) were screened for the presence of premature stop codons (PMSCs) in the inlA gene, which encodes a protein critical for invasion of Caco-2 cells. Primer sequences, PCR conditions, and sequencing strategies have previously been detailed (46). Initially, an ap-proximately 800-bp fragment in the 3⬘ end of inlA fragment was sequenced; if no PMSCs were detected in this fragment, DNA sequencing of the remaining inlA open reading frame was performed.
Motility assays.Swarming on semisoft agar was evaluated for four isolates
showing reduced invasiveness in Caco-2 cells but no PMSC in inlA. One indi-vidual colony of each L. monocytogenes isolate to be tested was used to needle inoculate tryptic soy broth plates containing 0.4% agar, followed by incubation for 48 h at either 24, 30, or 37°C. L. monocytogenes 10403S and 10403S⌬flaA strains were included as controls (Table 3). The plates were scanned with an Epson Perfection 1650 photo scanner (Epson America, Inc., Long Beach, CA), and the area of the swarming halo around the point of inoculation was measured using the image analysis program SigmaScan Pro 5.0 (Systat Software Inc., San Jose, CA). Results are reported as the mean of the swarming area observed in four independent experiments.
Quantitative reverse transcription-PCR (qRT-PCR) analysis of inlA tran-script levels.inlA transcript levels were evaluated for the four isolates that
showed reduced invasiveness in Caco-2 cells but did not have a PMSC in inlA (i.e., isolates FSL F8-110, FSL F8-131, FSL F8-132, and FSL F8-151) and three control strains representing two different lineages and three different serotypes (1/2a, 1/2b, and 4b; Table 3). For RNA extraction, the bacteria were grown as described above for the Caco-2 cell invasion assays. RNA Protect bacterial reagent (Qiagen, Valencia, CA) was added to the cultures according to the manufacturer’s instructions to stabilize the mRNA. After centrifugation at 4°C for 5 min at 4,200⫻ g, the supernatant was removed and cells were resuspended in 1 ml of TRI reagent (Applied Biosystems). The cell suspension was mixed with 0.1-mm acid-washed zirconium beads, and cells were disrupted in a minibead-beater (Biospec Products, Bartlesville, OK) for 4 min. After centrifugation for 5 min at 9.3⫻ g at 4°C, the supernatant was added to 100 l of 1-bromo-3-cyclopropane (Sigma). The aqueous phase was subsequently collected into a new
TABLE 3. L. monocytogenes control and host strains
L. monocytogenes strain Serotype Lineage Purpose(s) Reference
10403S
1/2a
II
Control included in invasion, swarming, and inlA qRT-PCR assays
4
FSL W3-084
1/2a
II
10403S
⌬inlA mutant, control for invasion assay
46
FSL H6-199
1/2a
II
10403S
⌬flaA mutant, control for swarming assay
50
FSL J1-123
4b
I
Control for inlA qRT-PCR assays
58
FSL R2-503
1/2b
I
Control for inlA qRT-PCR assays
58
Mack
1/2a
II
Host strain for phage isolation
26
FSL F2-695
4a
IIIA
Host strain for phage isolation
57
centrifuge tube, and nucleic acids were precipitated with isopropanol and then washed with ethanol. The pellet was resuspended in 100l of nuclease-free water (Qiagen). After treatment with RQ1 DNase (Promega) in the presence of RNasin (Promega, Madison, WI), total RNA was purified using the RNeasy minikit (Qiagen) according to the manufacturer’s protocol. RNA was eluted from the column using RNase-free water, and UV spectrophotometry (Nanodrop, Wilmington, DE) was used to quantify RNA and assess the purity of the RNA.
qRT-PCR was used to quantify transcript levels for the target gene (inlA) and the housekeeping gene (rpoB), using previously reported primers and probes (49). qRT-PCR was performed on an ABI Prism 7000 sequence detection system (Applied Biosystems) essentially as previously described (63). Two RNA extrac-tions were performed, and transcript levels for inlA were expressed as mean of log cDNA copy numbers, which were normalized by subtracting the log cDNA copy numbers observed for the rpoB housekeeping gene.
Prophage induction and phage propagation.A subset of 41 L. monocytogenes
isolates representing both sporadic (n⫽ 22) and persistent (n ⫽ 19) L.
mono-cytogenes strains associated with 7 processors (processors A to G; Fig. 1 shows
isolates and their PFGE patterns) was used to test for lysogen induction after UV treatment. Briefly, single colonies of isolates were inoculated in 5 ml of Luria-Bertani broth with 50 mM morpholinepropanesulfonic acid (MOPS), 1% (wt/ vol) glucose, 10 mM CaCl2, and 10 mM MgCl2(LB-MOPS-Glu-salts). After overnight incubation at 30°C with shaking (220 rpm), followed by exposure of 1 ml of culture to UV light for 2 min and subsequent incubation at room temper-ature in the dark for 3 h, 100-l aliquots of the culture were mixed with 100 l of one of three propagating strains in separate tubes (i.e., strains F2365, Mack, and FSL F2-695 [Table 3] grown in LB-MOPS-Glu-salts at 30°C as described above) and subsequently incubated with 2 ml of LB-MOPS-Glu-salts. After overnight incubation at 30°C with shaking (220 rpm), the cultures were filtered using a 0.22-m syringe membrane filter (Nalgene Labware, Rochester, NY), and 5l of the filtrate was spotted onto soft-agar layer lawns prepared with a 1:10 dilution of the propagating strain. The plates were incubated overnight at room temperature and evaluated for growth inhibition zones.
For each filtrate that yielded zones of inhibition, phage isolation was at-tempted on the same propagating strain that yielded the zone of inhibition. Briefly, a sterile glass pipette was used to remove an agar plug from the zone of inhibition (which would contain a phage if inhibition was caused by phage-mediated lysis). After the plug was dissolved in phosphate-buffered saline (PBS) and serial dilutions were prepared, different dilutions were plated for phage isolation using the soft-agar layer method. For this procedure, 0.1 ml of the PBS with the dissolved agar plug was mixed with 0.3 ml of its propagating strain (i.e., an overnight culture that was diluted in 1:10) and 4 ml of soft agar (0.75%) containing LB-MOPS-Glu-salts, which was laid over a base of 1.5% agar con-taining LB-MOPS (in 100-mm-diameter petri dishes). The plates were incubated overnight at room temperature, and phages were further purified, from single plaques, by two consecutive passages.
For each purified phage, lysates were prepared from plates that were inocu-lated with phage, using the soft-agar layer method. Four plates that showed confluent lysis after overnight incubation at room temperature were used for phage harvest with 10 ml of sterile PBS (per plate). With the help of a cell scraper, the top agar layer was removed into PBS and transferred to a centrifuge tube, followed by the addition of chloroform (to a final concentration of 2% [vol/vol]) and centrifugation at 4°C with 4,200⫻ g for 15 min. The supernatant was then filtered with a 0.22-l syringe membrane filter (Nalgene Labware), and stock preparations were maintained at 4°C.
Phage host range and L. monocytogenes phage susceptibility determinations.
The 41 L. monocytogenes isolates used for phage isolation (as well as the three propagating strains) were used along with the 26 lysogenic phages isolated to determine (i) the host ranges for the 26 phages and (ii) phage susceptibility patterns for the 44 L. monocytogenes isolates. For these experiments, L.
mono-cytogenes isolates were grown at 30°C with shaking in LB-MOPS, and mixtures of
300l of 1:10 dilutions of cultures and 4 ml of melted soft agar (0.75%) containing LB-MOPS were then laid on 1.5% agar containing LB-MOPS. After this overlay was solidified, 3l of each prophage lysate was spotted onto the plate, and the plates were incubated at room temperature for 12 to 16 h. Lysis patterns for each phage were classified on a scale ranging from 0 to 3 as follows: (i) 0 indicates that no plaques or zone of clearance was observed; (ii) 1 indicates a turbid zone of clearance; (iii) 2 indicates semiconfluent lysis; and (iv) 3 indi-cates confluent lysis. Two independent experiments were performed, and the scores were averaged and represented as a heat map (see Fig. 5) using the R software environment for statistical computing and graphics (version 2.9.1; R Development Core Team, Foundation for Statistical Computing, Vienna, Aus-tria [http://www.R-project.org]).
Statistical analysis.To compare differences in normalized inlA transcript
levels and swarming ability among L. monocytogenes isolates, a one-way analysis of variance (ANOVA), including a comparison of least-squares means and Tukey’s Studentized residuals to correct for multiple comparisons was per-formed. ANOVA was also used to determine if there was a statistically significant association between isolate invasion efficiency and (i) persistence, (ii) molecular serotype, or (iii) lineage. Chi-square tests were run to determine whether there was a relationship between L. monocytogenes persistence and (i) presence of an inducible prophage, (ii) molecular serogroup, and (iii) lineage. ANOVA and chi-square tests were performed using Statistical Analysis System JMP software (SAS Institute, Cary, NC). The nonparametric Wilcoxon test (R software envi-ronment for statistical computing and graphics) was used to determine whether persistent and nonpersistent strains differed in phage susceptibility. The statis-tical significance was set at P⬍ 0.05.
RESULTS
Characterization of 1,723 L. monocytogenes isolates by
PCR-based molecular serotyping and epidemic clone (EC) marker
identification, resistance profiling, and RAPD-PCR.
Among a
total of 1,723 L. monocytogenes isolates from 11 processors
(processors A to K; Tables 1 and 2), molecular serotyping
identified group D, which is typically serotype 4b (979 isolates
representing 9 of the 11 processors), group B, which is typically
serotype 1/2b (288 isolates representing 8 processors), group
A, which is typically serotype 1/2a (263 isolates representing 5
processors), and group C, which is typically serotype 1/2c (193
isolates representing 2 processors). While all group A isolates
were negative for the epidemic clone III (ECIII) genetic
marker, the ECI and ECII markers were found in 234 and 584
group D isolates, respectively (isolates from four processors
and two processors, respectively); for two processors, both
isolates with ECI and isolates with ECII markers were
identi-fied (processors B and C; Table 2). Interestingly, ECI
marker-positive isolates with the same PFGE type were obtained from
processors F and G.
Cadmium, arsenic, and tetracycline resistance profiling
iden-tified Cd
rAs
sTet
s(875 isolates from 10 processors) and Cd
sAs
sTet
s(645 isolates from eight processors) as the most
fre-quent profiles; additional profiles included Cd
rAs
rTet
s(32
isolates from four processors), Cd
sAs
rTet
s(154 isolates from
three processors), and Cd
rAs
sTet
r(18 isolates from one
processor). The combination of resistance profiles and
molec-ular serotyping allowed for differentiation of isolates in 14
groups (Tables 1 and 2).
As the need for extensive visual analyses did not permit for
reliable analysis of all 1,723 RAPD patterns in a single
den-drogram, analysis of RAPD patterns was performed using
in-dividual dendrograms for isolates from each processor.
Be-tween two (processor K; Table 2) and 53 (processor C; Table
2) combined RAPD profiles (based on patterns for both
prim-ers UBC 155 and OPM-01) were obtained for isolates from a
given processor. Results obtained with the four typing
tech-niques were combined to generate a single typing profile for
each isolate from a given processor. One to five isolates from
each typing profile were then conveniently selected for further
characterization by PFGE, for a total of 240 isolates.
Characterization of 240 representative isolates by PFGE.
ApaI and AscI PFGE analyses yielded 27 and 22 patterns
(Fig. 1), respectively, yielding a total of 32 PFGE profiles
(based on combined analysis of ApaI and AscI patterns).
Two to seven different PFGE profiles were obtained among
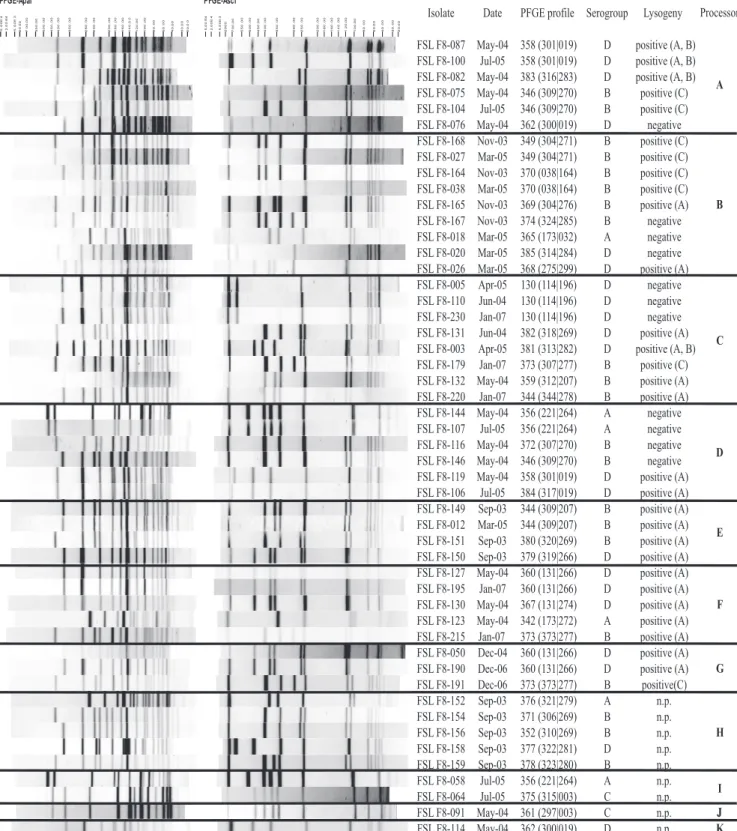
FIG. 1. ApaI and AscI PFGE restriction patterns for selected L. monocytogenes isolates obtained from processors A to K. Isolates were selected to
include one isolate for each PFGE profile obtained from a given sample at a given processor (Tables 2 and 3). ApaI and AscI restriction patterns are
shown on the left side of the figure, followed by (i) the isolate identification (ID) number, (ii) sampling date, (iii) PFGE profile designation, (iv) molecular
serogroup, (v) results for prophage induction, (vi) processor. The sampling dates are shown in the month-year form and abbreviated (e.g., May-04 stands
for May 2004). For PFGE profiles, the ApaI and AscI PFGE profile designations are shown in the parentheses, with the ApaI and AscI PFGE profile
designations shown before and after the vertical line, respectively. Molecular serogroup A includes serotypes 1/2a and 3a, molecular serogroup B includes
serotypes 1/2b, 3b, and 7, molecular serogroup C includes serotypes 1/2c and 3c, and molecular serogroup D includes serotypes 4b, 4d, and 4e. For
prophage induction results, first the result (positive or negative) is shown. For isolates that contained lysogenic phages, the propagating strain that yielded
a prophage is shown as follows: A, strain F2365; B, strain FSL F2-695; and C, Mack strain. For some isolates, prophage induction was not performed
(n.p.). The processor from which isolates were obtained is indicated on the right-hand side in boldface letters (A to K).
isolates from a given processor, with the exception of
pro-cessors J and K, where only one PFGE profile was found
(Tables 1 and 2). Overall, characterization of isolates by
PFGE showed lower diversity compared to RAPD, and in
many cases, isolates with different RAPD profiles exhibited
the same PFGE profile. For example, for processor C, 70
isolates representing 46 different RAPD profiles were all
classified into PFGE profile 130 (Table 1).
For all seven processors (processors A to G) where isolates
were obtained on multiple sample collection dates, at least
some L. monocytogenes isolates collected on different sampling
dates showed the same PFGE profile, suggesting persistence of
a given strain. Times between the sampling dates that yielded
isolates with the same PFGE profile ranged from 14 months
(processors A and D) to 32 months (processors C and F). The
patterns of persistence included the following: (i) three
cessors that showed persistence of a single strain (PFGE
pro-files 130, 356, and 344 in isolates from processors C, D, and E,
respectively), which was not found to persist in another
pro-cessor; (ii) two processors that each showed evidence for
per-sistence of two strains (PFGE profiles 358 and 346 for
proces-sor A and profiles 349 and 370 for procesproces-sor B); and (iii) two
processors where the same strain persisted (PFGE profile 360
was isolated over multiple sampling dates from products of
processors F and G with a time between sampling dates of 32
and 24 months, respectively). While we thus found that strains
with 8 different PFGE profiles showed evidence for persistence
in association with different processors, only one PFGE profile
was associated with strains that persisted in more than one
processor. In addition, we found that four PFGE profiles
(pro-files 344, 346, 358, and 356) that were associated with
persis-tent strains were also isolated from samples associated with
another processor (where they did not persist) on a single date.
For example, PFGE profile 344 was isolated from processor C
samples collected on a single date, while a strain with this
PFGE type appears to also have persisted in processor E.
Interestingly, for 6 processors (processors A though F; Fig.
1) some L. monocytogenes isolates recovered in different years
were found to have closely related PFGE types, which differed
by less than 3 bands in their patterns with a given enzyme. For
example, PFGE profile 383, which was isolated from processor
A samples collected in May 2004, and profile 358, which was
isolated from processor A samples collected in May 2004 and
July 2005, differed by 3 bands each in the AscI pattern and
ApaI pattern. Also, PFGE profile 132, representing isolates
from processor C samples collected in May 2004, and profile
220, representing isolates from processor C samples in January
2007, showed the same AscI pattern and differed by 1 band in
the ApaI pattern. PFGE profiles 367 and 360, both
represent-ing isolates from processor F (Table 1), differed by 1 band in
their AscI patterns and had the same ApaI patterns.
Use of PFGE data to track L. monocytogenes in different
production stages.
For four processors, isolates were obtained
from products in different processing stages of alheira,
chou-ric
¸a de Vinhais, and salpica
˜o de Vinhais (Table 4). Isolates
from alheira production in plant B showed five different PFGE
profiles, including the following: (i) profile 349, represented by
isolates from cooked meat mixture and paste; (ii) profile 365,
represented by isolates from casings, paste, and final product;
and (iii) profiles 368 and 370, represented by isolates from the
paste and final product. As isolates with PFGE profiles 349 and
370 were recovered over multiple samplings (Table 4), our
data indicate that contamination from environmental sites of
persistence may occur early in production and be carried
through the processing steps.
Sampling different stages of alheira production in processor
C showed that isolates with PFGE profile 130 were recovered
from all stages of production, from casing samples and cooked
meats to final products, in January 2007. As isolates with this
PFGE profile were also recovered from alheira samples in May
2004 and April 2005 (Table 2), these data may also indicate
that, in January of 2007, contamination from environmental
sites of persistence occurred early in production and was
car-ried through the processing steps. Sampling at different stages
of alheira production in processor G plant showed that isolates
with PFGE profile 360 were recovered from all stages of
pro-duction in December 2004, again suggesting that
contamina-tion occurred early in produccontamina-tion and persisted.
Sampling at different stages of production of alheira,
sal-pica
˜o de Vinhais, and chouric
¸a de Vinhais in the processor I
plant showed that isolates with a single PFGE profile (profile
356) were recovered throughout alheira production (Table 4).
An isolate with the same PFGE profile was also recovered
from salpica
˜o de Vinhais (before smoking), which is produced
in the same area and with the same equipment as alheira.
Isolates with a second PFGE profile (profile 375) were
ob-tained from the seasoned raw pork for chouric
¸a de Vinhais and
salpica
˜o de Vinhais (both right after seasoning and 2 days after
seasoning), suggesting a common source of contamination
(likely the raw meats used for these products).
Identification and characterization of isolates with reduced
invasion efficiency in Caco-2 cells.
Fifty L. monocytogenes
iso-lates were characterized for invasion efficiency in Caco-2 cells;
these isolates were selected to include one isolate for each
PFGE profile obtained from a given sample (the isolates and
their PFGE patterns are shown in Fig. 1). The average invasion
efficiencies (relative to the laboratory control strain 10403S)
for these 50 isolates ranged from 0.49 to 402.6% (Fig. 2).
Twelve isolates representing 10 different PFGE types showed
reduced invasion phenotype, defined as a relative invasion
efficiency of
⬍20% (Table 5); this cutoff was used, because
previous data (17) suggested that only isolates with
⬍20%
invasion efficiency show premature stop codons (PMSCs) in
the inlA gene, which encodes a key protein responsible for
invasion of intestinal epithelial cells.
Premature stop codon mutations in inlA were identified in 8
of the 12 isolates that showed invasion efficiencies of
⬍20%
(Table 5). Three isolates with PFGE type 356 (two from
pro-cessor D and one from propro-cessor I) carried inlA PMSC type 4,
which has been previously observed in isolates from the United
States (52, 68) and Portugal, namely, in one isolate with the
same PFGE type collected from processor D on another
sam-pling date (17). Three isolates representing 3 different PFGE
profiles (profiles 365, 342, and 376) carried inlA PMSC
muta-tion type 6 (Table 4); Felício et al. (17) reported this mutamuta-tion
in 2 L. monocytogenes isolates with PFGE type 342 recovered
from two different processors (not included in this study) and
in one isolate with PFGE type 365 obtained from processor G
in October 2003. Two isolates (with PFGE profiles 375 and
361) carried inlA PMSC mutation type 12 (Table 5); this
mu-tation was also previously identified by Felício et al. (17) in two
isolates with PFGE profile 361 obtained from the same
pro-cessor J samples that yielded one of the two isolates with this
PMSC here.
The four isolates that showed no inlA PMSC mutations,
despite their reduced invasion efficiency, included isolate FSL
F8-110, which showed an in-frame deletion of InlA amino
acids (aa) 738, 739, and 749, located in the membrane anchor
domain. This 3-aa deletion is unlikely to be responsible for the
reduced invasion efficiency, as Lecuit et al. (36) showed that a
mutant strain with a deletion in the preanchor region (between
aa 714 and aa 766) presented an invasiveness level comparable
to that of a strain with full-length internalin. Importantly
though, both this isolate (FSL F8-110) and isolate FSL F8-132
showed reduced inlA transcript levels, while isolates FSL
F8-131 and FSL F8-151 demonstrated inlA transcript levels
com-parable to those observed for control strains 10403S, FSL
R2-503, and FSL J1-123 (Fig. 3).
Isolate FSL F8-132 showed reduced motility at 24, 30 and
37°C, with values comparable to that obtained for the
⌬flaA
control strain. Two other invasion-attenuated isolates (FSL
F8-131 and FSL F8-151) showed significantly higher motility at
24 and 30°C compared to the
⌬flaA control strain but lower
motility compared to strain 10403S at 24 and 37°C. At 37°C,
the invasion efficiency values for these strains were similar to
the value for the
⌬flaA control strain (Fig. 4). The
invasion-deficient isolate FSL F8-110, which showed reduced inlA
tran-script levels, showed motility levels comparable to that
ob-tained for control strain 10403S, at the three temperatures
tested (Fig. 4).
Association between invasion efficiency and genetic lineage
and persistence.
While ANOVA showed no significant
associ-ation between invasion efficiency and persistence (i.e., whether
an isolate presented a persistent or nonpersistent isolate),
ANOVA analyses also showed significant effects on invasion
efficiency of either molecular serogroup or lineage (with
mo-lecular serotypes 1/2b and 4b classified into lineage I and
molecular serotypes 1/2a and 1/2c classified into lineage II).
Specifically, lineage I isolates were significantly more invasive
than lineage II isolates (P
⬍ 0.0001); serogroup A strains were
significant less invasive than either serogroup B or D strains
(this analysis did not include serogroup C, as there were no
serogroup C isolates among plants with multiple samplings).
Chi-square tests also showed that there was no significant
as-sociation (P
⬎ 0.05) between persistence and either molecular
serogroup or lineage.
TABLE 4. L. monocytogenes PFGE profiles for isolates obtained from different production stages of fermented sausages for four processors
Processor and producta
Sampling date (mo-yr) Sampleb
PFGE profile(s) (no. of isolates)
Processor B
Alheira
Mar-05
Casing*
365 (1)
Cooked meat mixture*
349 (1)
Paste**
349 (5), 365 (4), 368 (3), 370 (1), 385 (3)
Alheira (final product)**
365(6), 368 (4), 370 (6)
Processor C
Alheira
Apr-05
Alheira before smoking*
381 (2)
Alheira after 3 days of smoking**
130 (7)
Jan-07
Casing**
130 (5)
Cooked beef meat**
130 (5)
Cooked pork meat**
130 (1)
Cooked meat mixture*
130 (2)
Paste**
130 (10), 344 (2)
Alheira before smoking**
130 (7)
Alheira after 1 day of smoking**
130 (11), 373 (1)
Alheira (final product)**
130 (12), 344 (1), 373 (1)
Processor G
Alheira
Dec-06
Casing**
360 (2), 374 (1)
Cooked meat mixture**
360 (4), 374 (1)
Paste*
360 (1)
Alheira before smoking*
360 (1)
Processor I
Alheira
Dec-06
Paste
356 (3)
Alheira before smoking
356 (2)
Alheira after 2 days of smoking
356 (1)
Allheira (final product)**
356 (1)
Salpica
˜o de Vinhais
Dec-06
Seasoned raw pork
375 (1)
Seasoned raw pork (2nd day)
375 (4)
Salpica
˜o (before smoking)
356 (1)
Chouric
¸a de Vinhais
Dec-06
Seasoned raw pork
375 (1)
Seasoned raw pork (2nd day)
375 (1)
a
For three processors, only samples from alheira production were tested; for processor I, samples for three product types (alheira, salpica˜o de Vinhais, and chouric¸a de Vinhais) from the production chain were tested.
b
For processors B, C, and G, two samples were tested for L. monocytogenes at each sampling date, and isolates from all positive samples were further characterized. The number of asterisks indicates whether one or two of the two samples were positive for L. monocytogenes; for processor I, only one sample for each processing stage was tested (except for finished product).
Isolation and characterization of lysogenic phages among
persistent and nonpersistent strains.
A total of 41 isolates,
including 19 isolates representing strains that persisted in a
given processor and 22 isolates representing strains that did
not show evidence for persistence, were tested for lysogen
induction. Filtrates of UV-treated cultures from 30 isolates
had the ability to inhibit the growth of a host strain. Inhibition
caused by filtrates of eight isolates (FSL F8-012, FSL F8-123,
FSL 131, FSL 132, FSL 149, FSL 151, FSL
F8-165, and FSL F8-220) appears to be caused by listeriocidal
substances (e.g., a monococin, which represents a defective
phage particle [74]), rather than lysogenic phages, as the
fil-trates from these eight isolates (i) did not form plaques (they
showed only a zone of inhibition) and (ii) did not allow for
propagation of an inhibitory agent (while the other 22 isolates
allowed for phage propagation). The 22 isolates that yielded
FIG. 2. Caco-2 cell invasion efficiencies for 50 selected L. monocytogenes isolates (representing one representative for each PFGE pattern
obtained from a given sample). Values represent average invasion efficiencies (normalized to that of the control strain 10403S) for 2 or 3
independent replicates; the error bars indicate standard deviations or ranges. A
⌬inlA strain (Table 3) was included as an invasion-attenuated
control.
TABLE 5. Characteristics of L. monocytogenes isolates that showed reduced invasion efficiencies in Caco-2 cells
Isolate Invasion efficiency (%)a PFGE profile Processor Molecular serotype Description of mutation found in inlAb PMSC mutation typec Length of predicted protein (aa) References for PMSCs
FSL F8-151
0.49
380
E
B
No mutation found
dNA
e800
NA
FSL F8-132
0.57
359
C
B
No mutation found
fNA
800
NA
FSL F8-091
2.05
361
J
C
Deletion of A (nt 1637)
12
576
17, 29, 56, 67, 68
FSL F8-144
2.49
356
D
A
Deletion of A (nt 12)
4
9
17, 52, 67, 68
FSL F8-064
3.32
375
I
C
Deletion of A (nt 1637)
12
576
17, 29, 56, 67, 68
FSL F8-018
3.64
365
B
A
C3T substitution (nt 1474)
6
492
17, 48, 56, 67, 68
FSL F8-123
4.07
342
F
A
C3T substitution (nt 1474)
6
492
17, 48, 56, 67, 68
FSL F8-107
4.09
356
D
A
Deletion of A (nt 12)
4
9
17, 52, 67, 68
FSL F8-152
4.62
376
H
A
C3T substitution (nt 1474)
6
492
17, 48, 56, 67, 68
FSL F8-058
5.33
356
I
A
Deletion of A (nt 12)
4
9
17, 52, 67, 68
FSL F8-110
10.23
130
C
D
Deletion of 3 aa (nt 2212 to 2220)
gNA
797
NA
FSL F8-131
16.17
382
C
B
No mutation found
hNA
800
NA
aValues represent average invasion efficiencies (normalized to that of the control strain 10403S) from 2 or 3 independent replicates. b
nt, nucleotide; aa, amino acids. c
Premature stop codon (PMSC) mutations were classified by the method of Van Stelten et al. (67). d
Strain FSL F8-151 showed reduced swarming compared to strain 10403S at 37°C; swarming at this temperature was similar to that for a⌬flaA control strain (Fig. 3).
e
NA, not applicable. f
Strain FSL F8-132 showed reduced swarming compared to strain 10403S at 24, 30, and 37°C; swarming at these temperatures was similar to that for a⌬flaA control strain (Fig. 3). This strain also showed reduced inlA transcript levels (Fig. 4).
g
Strain FSL F8-110 showed reduced inlA transcript levels (Fig. 4). h