436
http://dx.doi.org/10.5935/2526-5393.20190042
1. Hospital de Santa Maria - Centro Hospitalar Universitário Lisboa Norte, Serviço de Imunoalergologia – Lisboa, Lisboa, Portugal.
2. Faculdade de Medicina/Instituto de Medicina Molecular, Universidade de Lisboa, Laboratório de Imunologia Clínica – Lisboa, Lisboa, Portugal. 3. Hospital Dr. Nélio Mendonça, SESARAM, EPE, Unidade de Imunoalergologia – Funchal, Funchal, Portugal.
4. Faculdade de Medicina, Universidade Lisboa, Clínica Universitária de Imunoalergologia – Lisboa, Lisboa, Portugal. Submitted: 22/11/2019, accepted: 22/12/2019.
Arq Asma Alerg Imunol. 2019;3(4):436-44.
RESUMO ABSTRACT
Introduction: Bee venom (BV) allergy is one of the most common causes of severe anaphylaxis. Venom immunotherapy (VIT) is considered the most effective treatment, but systemic reactions may occur. This study aimed to characterize the sensitization profile by molecular components of patients with BV anaphylaxis under VIT and to evaluate whether systemic reactions during the build-up phase of VIT protocol are related to different sensitization patterns. Methods: A retrospective study of 30 patients under VIT for 1 year. The group of patients who reacted during the build-up phase (group A) was compared with the group with no reactions (group B). Specific IgE (sIgE) and IgG4 (sIgG4) for BV and recombinants (rApi m1, rApi m2, rApi m3, rApi m5, and rApi m10) were evaluated before and 1 year after VIT. Statistical analysis was performed using GraphPad Prism v5.01. Results: Men accounted for 80% of the sample, and mean age was 47 years (14-74 years). Group A consisted of 10 patients, and group B of 20 patients. Before VIT, sIgE to rApi m1 was detected in 86.7% of patients, rApi m2 in 46.7%, rApi m3 in 16.7%, rApi m5 in 43.3%, and rApi m10 in 70%. Positive results to at least 1 BV allergen were detected in 100%; 73% of patients were sensitized to >1 allergen, and 13.3% to all allergens. The profile of the two groups did not differ significantly before VIT, but group B showed a significant decrease
in whole BV extract (p=0.045), rApi m 3 (p=0.017), and rApi m 10
(p=0.021) 1 year after VIT. Regarding sIgG4, there was a significant
increase in rApi m1, which was not observed in other allergens, such as rApi m3 and rApi m10. Conclusion: The analysis of a panel of BV recombinants can improve diagnostic sensitivity, when compared to rApi m1 alone. There was no association between systemic reactions during the build-up phase of VIT and molecular sensitization profile. Nevertheless, it is important to study a greater number of patients.
Keywords: Bee venoms, anaphylaxis, immunotherapy.
Introdução: A alergia ao veneno de abelha (VA) é uma das causas mais comuns de anafilaxia grave. A imunoterapia com veneno de abelha (VIT) é considerada o tratamento mais eficaz, mas reações sistêmicas podem ocorrer. O objetivo deste estudo foi caracterizar o perfil de sensibilização por componentes moleculares de doentes com anafilaxia a VA e avaliar se reações sistêmicas durante o ultra-rush estão relacionadas com diferentes padrões de sensibilização. Métodos: Estudo retrospectivo incluindo 30 doentes submetidos a VIT durante 1 ano. Considerou-se dois grupos: grupo de doentes que reagiu durante o ultra-rush (Grupo A), que foi comparado com o grupo sem reação (Grupo B). Foram avaliadas as IgE (sIgE) e IgG4 (sIgG4) específicas para VA(i1) e componentes moleculares: rApi m1, rApi m2, rApi m3, rApi m5 e rApi m10 antes e 1 ano após VIT. Os testes esta-tísticos foram realizados com Graph-PadPrism v5.01. Resultados: 80% sexo masculino, média de idade 47 anos (14-74). Grupo A com 10 doentes, Grupo B com 20 doentes. Previamente à VIT, sIgE para rApi m1 foi detectada em 86,7%; rApi m2 em 46,7%; rApi m3 em 16,7%; rApi m5 em 43,3%; e rApi m10 em 70%. Resultados positivos para pelo menos um alergênio de VA foram detectados em 100%. 73% dos doentes eram sensibilizados a mais de um alergênio, e 13,3% a todos os alergênios. Não houve diferenças estatisticamente significativas no perfil dos dois grupos antes da VIT, porém verificou-se uma diminuição significativa: p = 0,045; p = 0,017 e p = 0,021 de i1, rApi m3 e rApi m10, respectivamente, no grupo B um ano após VIT. Relativamente à sIgG4, observou-se um aumento significativo de rApi m1, não observado nos restantes alergênios como rApi m3 e rApi m10. Conclusão: A análise de um painel de recombinantes de VA pode melhorar a sensibilidade diagnóstica, quando comparado com rApi m1 isolado. Não se verificou associação entre a ocorrência de reações sistêmicas durante o ultra-rush e o perfil de sensibilização molecular. No entanto, é importante para estudar um maior número de doentes.
Descritores: Veneno de abelha, anafilaxia, imunoterapia.
Contribution of molecular diagnosis to
bee venom allergic patients with systemic reactions
during the build-up phase of bee venom immunotherapy
Contribuição do diagnóstico molecular em doentes alérgicos ao veneno de abelha
com reações sistêmicas durante o ultra-rush
Tatiana Lourenço1,2, Mara Fernandes1,3, Anabela Lopes1, Elisa Pedro1,
Introduction
Systemic reactions to hymenoptera venom allergy have been reported in up to 7.5% of adults.1 These rates are higher among beekeepers, ranging from 14 to 32%.2 Hymenoptera venom allergy is also one of the most common causes of anaphylaxis and accounts for a quarter of all anaphylactic fatalities,3,4 causing important morbidity and impairment of quality of life.1,5
Venom immunotherapy (VIT) is considered the most effective and the only treatment that can potentially prevent further severe reactions to hymenoptera venom,1,5,6 with a protection rate of 75 to 98%, higher than that reported in patients treated with bee venom (BV) (77-84%).1 VIT may be effective with long-term clinical benefit, improving quality of life.1,5
VIT is well tolerated by most patients, but in approximately one-third of the patients, systemic reactions are observed during the initial phase of treatment (build-up phase),6 especially with bee VIT, in which reactions have been 5-fold more frequent than in wasp VIT.1,7 Side effects include local reactions limited to the injection site and systemic reactions, ranging from rash to life-threatening anaphylactic shock.9 The risk factors that might be associated with systemic reactions during VIT are poorly understood. Molecular diagnosis with recombinant allergens can improve diagnostic accuracy by distinguishing cross-reactivity from true co-sensitization, identifying risk biomarkers for systemic reactions, and selecting allergens suitable for immunotherapy.10 In fact, 12 different BV allergens have been identified,5 of which five are available for diagnosis: rApi m 1 (phospholipase A2), rApi m 2 (hyaluronidase), rApi m 3 (acid phosphatase), rApi m 5 (allergen C/DPP IV), and rApi m 10 (CRP/icarapin). However, few studies have evaluated the role of molecular biomarkers in predicting adverse reactions during VIT.
The aim of this study was to characterize the sensitization profile of patients with systemic reactions to BV before and 1 year after VIT, by using molecular components, and to evaluate whether systemic reactions are related to different patterns of molecular sensitization during the build-up phase of VIT.
Methods
Population
A retrospective study of patients with a diagnosis of BV allergy and a clinical history of grade III-IV anaphylaxis according to Muller’s classification11 who
had completed 1 year of VIT with the Bial-Aristegui/ Roxall® commercial extract.
Diagnosis of BV allergy
Diagnosis was based on clinical history, positive skin tests, and specific IgE (sIgE) to whole BV extract.
Skin tests
Skin tests with BV extracts were performed according to the European Academy of Allergy and Clinical Immunology (EAACI) guidelines.1 Stallergenes® or Bial-Aristegui/Roxall® extracts were used at least 3 weeks after the last sting reaction. Skin prick tests were performed with 100 μg/mL concentration, using 0.9% NaCl as a negative control and 10 mg/mL histamine as a positive control. Intradermal tests were performed with increasing concentrations, from 0.001 to 1 μg/mL, and saline as a negative control.
Specific IgE/ IgG4 evaluation
The levels of sIgE and specific IgG4 (sIgG4) to whole BV extract (i1) and recombinants (rApi m 1, rApi m 2, rApi m 3, rApi m 5, and rApi m 10) were evaluated in all patients using ImmunoCAP® system according to the manufacturer’s instructions (ThermoFisher Scientific, Uppsala, Sweden). Values ≥ 0.35 kU/L were considered positive. These measurements were performed before (T0) and 1 year after VIT (T1).
Venom immunotherapy build-up phase protocol - ultra-rush (UR)
The 210-min VIT protocol proposed by Birnbaum et al.12 was used as the VIT build-up phase protocol. In this protocol, a cumulative dose of 101.1 μg, divided into six injections, was given as follows: an initial dose of 0.1 μg, followed by 1, 10, and 20 μg at 30-min intervals. Then, 30 and 40 μg were given every 60 min. The maintenance dose of 100 μg was repeated 15 days after the build-up phase protocol and administered at 4-6-week intervals over a period of 3 to 5 years, as established in the EAACI guidelines.1 All injections were given by trained medical personnel in an Allergology Day Hospital equipped for the treatment of anaphylactic reactions. All patients were pretreated with clemastine and ranitidine. If a systemic reaction occurred, the build-up phase protocol was
discontinued and a new protocol was performed on another day. Systemic reactions were treated according to established recommendations.
The patients were divided into two groups according to the occurrence of systemic reactions during the build-up phase: Group A – patients who had a reaction; and Group B – patients who did not have a reaction.
Statistical analysis
Statistical analysis was performed using the Wilcoxon matched-pairs signed-rank test with GraphPad Prism v 5.01. Results are expressed as mean, median and interquartile range (IQR). P values < 0.05 were considered statistically significant.
Ethics
This study was approved by the Institutional Review Board of the Northern Lisbon University Hospital Center (CHULN) at Hospital Santa Maria/ Medical School, affiliated with the University of Lisbon, and followed the tenets of the Declaration of Helsinki. Written informed consent was obtained from all patients before enrollment in the study.
Results
Thirty patients under bee VIT were included. Most patients were men (24; 80%), and the mean age was 47 years (median, 49; range, 14-74). Ten patients reacted during the build-up phase (Group A), and all
of them had grade II or III systemic reactions according to Muller’s classification. Group B (no reactions) consisted of 20 patients.
Specific IgE and specific IgG4 - T0
Before VIT (T0), all patients (n=30) had positive sIgE to whole BV extract. In these patients, rApi m 1 was detected in 86.7% (n=26), rApi m 2 in 46.7% (n=14), rApi m 3 in 16.7% (n=5), rApi m 5 in 43.3% (n=13), and rApi m 10 in 70% (n=20) (Figure 1A).
Positive results to at least one BV molecular component were detected in 100% of patients. Twenty-two (73%) patients were sensitized to more than one component, six (20%) were sensitized only to rApi m 1, and two (6.7%) to rApi m 10. Four patients (13.3%) were sensitized to all molecular allergens tested. According to the sensitization profile, there was no statistically significant difference between the two groups (Group A, n=10; and Group B, n=20) in the occurrence of systemic reactions during the build-up phase (Figure 1B).
The levels of sIgG4 were low for all recombinants, being zero in most patients. All individual results for sIgE and sIgG4 to whole BV extract and recombinants (rApi m 1, rApi m 2, rApi m 3, rApi m 5, and rApi m 10) are shown in Table 1.
Specific IgE and specific IgG4 - T1
One year after VIT (T1), four patients dropped out of the study, for a total of 26 patients available for analysis (Group A, n=8; and Group B, n=18). At this
Figure 1
BV allergens evaluation before VIT (T0)
A = Frequency of bee venom allergens before VIT; B = Characterization of sensitization profile of group A and B before VIT (median)
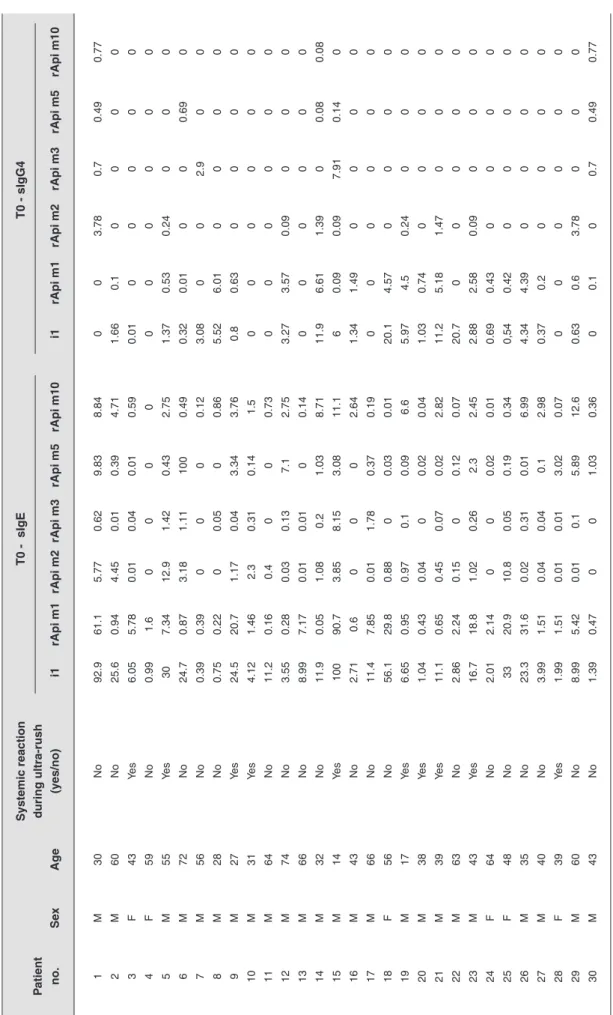
Tab
le 1
Char
acter
ization of the sIgE and sIgG4 sensitization profile of patients bef
ore VIT Systemic reaction T0 - sIgE T0 - sIgG4 P atient during ultra-rush no. Se x Ag e (y es/no) i1 rApi m1 rApi m2 rApi m3 rApi m5 rApi m10 i1 rApi m1 rApi m2 rApi m3 rApi m5 rApi m10 1 M 30 No 92.9 61.1 5.77 0.62 9.83 8.84 0 0 3.78 0.7 0.49 0.77 2 M 60 No 25.6 0.94 4.45 0.01 0.39 4.71 1.66 0.1 0 0 0 0 3 F 43 Yes 6.05 5.78 0.01 0.04 0.01 0.59 0.01 0 0 0 0 0 4 F 59 No 0.99 1.6 0 0 0 0 0 0 0 0 0 0 5 M 55 Yes 30 7.34 12.9 1.42 0.43 2.75 1.37 0.53 0.24 0 0 0 6 M 72 No 24.7 0.87 3.18 1.11 100 0.49 0.32 0.01 0 0 0.69 0 7 M 56 No 0.39 0.39 0 0 0 0.12 3.08 0 0 2.9 0 0 8 M 28 No 0.75 0.22 0 0.05 0 0.86 5.52 6.01 0 0 0 0 9 M 27 Yes 24.5 20.7 1.17 0.04 3.34 3.76 0.8 0.63 0 0 0 0 10 M 31 Yes 4.12 1.46 2.3 0.31 0.14 1.5 0 0 0 0 0 0 11 M 64 No 11.2 0.16 0.4 0 0 0.73 0 0 0 0 0 0 12 M 74 No 3.55 0.28 0.03 0.13 7.1 2.75 3.27 3.57 0.09 0 0 0 13 M 66 No 8.99 7.17 0.01 0.01 0 0.14 0 0 0 0 0 0 14 M 32 No 11.9 0.05 1.08 0.2 1.03 8.71 11.9 6.61 1.39 0 0.08 0.08 15 M 14 Yes 100 90.7 3.85 8.15 3.08 11.1 6 0.09 0.09 7.91 0.14 0 16 M 43 No 2.71 0.6 0 0 0 2.64 1.34 1.49 0 0 0 0 17 M 66 No 11.4 7.85 0.01 1.78 0.37 0.19 0 0 0 0 0 0 18 F 56 No 56.1 29.8 0.88 0 0.03 0.01 20.1 4.57 0 0 0 0 19 M 17 Yes 6.65 0.95 0.97 0.1 0.09 6.6 5.97 4.5 0.24 0 0 0 20 M 38 Yes 1.04 0.43 0.04 0 0.02 0.04 1.03 0.74 0 0 0 0 21 M 39 Yes 11.1 0.65 0.45 0.07 0.02 2.82 11.2 5.18 1.47 0 0 0 22 M 63 No 2.86 2.24 0.15 0 0.12 0.07 20.7 0 0 0 0 0 23 M 43 Yes 16.7 18.8 1.02 0.26 2.3 2.45 2.88 2.58 0.09 0 0 0 24 F 64 No 2.01 2.14 0 0 0.02 0.01 0.69 0.43 0 0 0 0 25 F 48 No 33 20.9 10.8 0.05 0.19 0.34 0,54 0.42 0 0 0 0 26 M 35 No 23.3 31.6 0.02 0.31 0.01 6.99 4.34 4.39 0 0 0 0 27 M 40 No 3.99 1.51 0.04 0.04 0.1 2.98 0.37 0.2 0 0 0 0 28 F 39 Yes 1.99 1.51 0.01 0.01 3.02 0.07 0 0 0 0 0 0 29 M 60 No 8.99 5.42 0.01 0.1 5.89 12.6 0.63 0.6 3.78 0 0 0 30 M 43 No 1.39 0.47 0 0 1.03 0.36 0 0.1 0 0.7 0.49 0.77 VIT = v enom imm unother ap y; F = f emale; M = male; i1 = whole bee v enom e xtr act.
time point, the sensitization profile to BV molecular components was similar to that at baseline (T0): rApi m 1 was detected in 88.5% (n=23), rApi m 2 in 46.2% (n=12), rApi m 3 in 23.1% (n=6), rApi m 5 in 50% (n=13), and rApi m 10 in 69.2% (n=18) (Figure 2A). The sensitization profile of the two groups did not differ significantly (Figure 2B). When the sensitization profile was analyzed in the two groups separately, group B showed a significant decrease in sIgE to whole BV extract (p=0.0451), rApi m 3 (p=0.017), and rApi m 10 (p=0.021) (Figure 2C), but no significant changes were observed in group A (Figure 2D).
Regarding the sIgG4 response to BV and molecular components, there was a significant increase in rApi m 1 levels (p<0.0001), which was not observed in other specific allergens, such as rApi m 3 and rApi m 10. When the two groups were analyzed separately, only
rApi m 1 levels showed a significant increase (group A, p=0.0015; and group B, p=0.0078).
All individual results for sIgE and sIgG4 to BV and its recombinants are shown in Table 2. The median (IQR) values of sIgE and sIgG4 to whole BV extract and recombinants for both groups are detailed in Table 3.
Discussion
In this study, all patients had positive sIgE to whole BV extract and to at least one BV molecular component. The most frequent molecular component was rApi m 1, observed in 86.7% of patients, followed by rApi m 10 (66.7%), rApi m 2 (46.7%), rApi m 5 (43.3%), and rApi m 3 (16.7%). Most patients (22; 73%) were sensitized to more than one component, while six (20%) were sensitized only to rApi m 1 and
Figure 2
BV allergens evaluation 1 year after VIT and before and after VIT from each group individually
A = Frequency of bee venom allergens one year after VIT; B = Characterization of sensitization profile of group A and B one year after VIT (median); C = Characterization of sensitization profile of group B before and 1 year after VIT (median); D = Characte-rization of sensitization profile of group A before and 1 year after VIT (median)
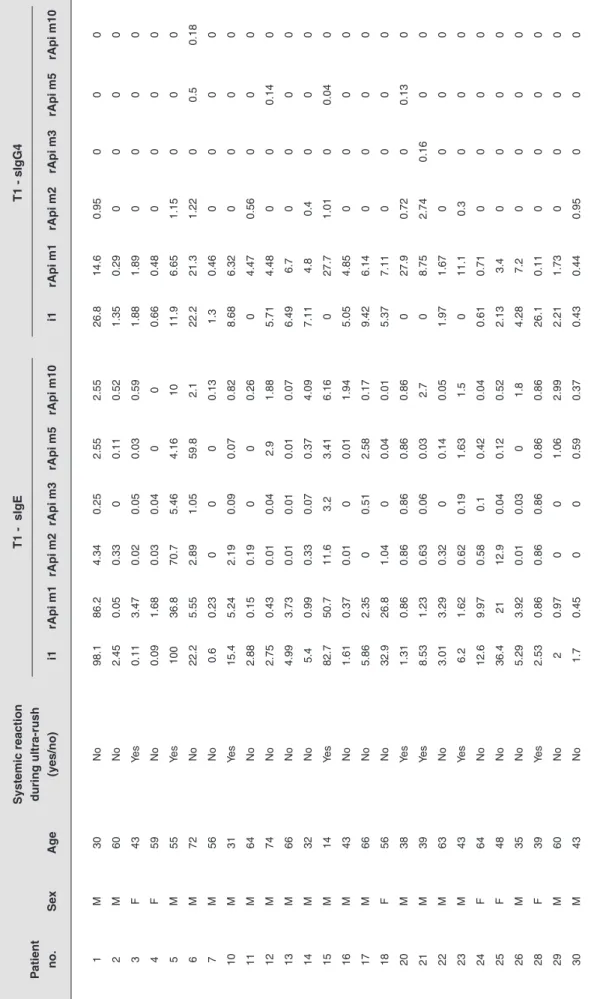
Tab
le 2
Char
acter
ization of sensitization the sIgE and sIgG4 sensitization profile of patients 1 y
ear after VIT Systemic reaction T1 - sIgE T1 - sIgG4 P atient during ultra-rush no. Se x Ag e (y es/no) i1 rApi m1 rApi m2 rApi m3 rApi m5 rApi m10 i1 rApi m1 rApi m2 rApi m3 rApi m5 rApi m10 1 M 30 No 98.1 86.2 4.34 0.25 2.55 2.55 26.8 14.6 0.95 0 0 0 2 M 60 No 2.45 0.05 0.33 0 0.11 0.52 1.35 0.29 0 0 0 0 3 F 43 Yes 0.11 3.47 0.02 0.05 0.03 0.59 1.88 1.89 0 0 0 0 4 F 59 No 0.09 1.68 0.03 0.04 0 0 0.66 0.48 0 0 0 0 5 M 55 Yes 100 36.8 70.7 5.46 4.16 10 11.9 6.65 1.15 0 0 0 6 M 72 No 22.2 5.55 2.89 1.05 59.8 2.1 22.2 21.3 1.22 0 0.5 0.18 7 M 56 No 0.6 0.23 0 0 0 0.13 1.3 0.46 0 0 0 0 10 M 31 Yes 15.4 5.24 2.19 0.09 0.07 0.82 8.68 6.32 0 0 0 0 11 M 64 No 2.88 0.15 0.19 0 0 0.26 0 4.47 0.56 0 0 0 12 M 74 No 2.75 0.43 0.01 0.04 2.9 1.88 5.71 4.48 0 0 0.14 0 13 M 66 No 4.99 3.73 0.01 0.01 0.01 0.07 6.49 6.7 0 0 0 0 14 M 32 No 5.4 0.99 0.33 0.07 0.37 4.09 7.11 4.8 0.4 0 0 0 15 M 14 Yes 82.7 50.7 11.6 3.2 3.41 6.16 0 27.7 1.01 0 0.04 0 16 M 43 No 1.61 0.37 0.01 0 0.01 1.94 5.05 4.85 0 0 0 0 17 M 66 No 5.86 2.35 0 0.51 2.58 0.17 9.42 6.14 0 0 0 0 18 F 56 No 32.9 26.8 1.04 0 0.04 0.01 5.37 7.11 0 0 0 0 20 M 38 Yes 1.31 0.86 0.86 0.86 0.86 0.86 0 27.9 0.72 0 0.13 0 21 M 39 Yes 8.53 1.23 0.63 0.06 0.03 2.7 0 8.75 2.74 0.16 0 0 22 M 63 No 3.01 3.29 0.32 0 0.14 0.05 1.97 1.67 0 0 0 0 23 M 43 Yes 6.2 1.62 0.62 0.19 1.63 1.5 0 11.1 0.3 0 0 0 24 F 64 No 12.6 9.97 0.58 0.1 0.42 0.04 0.61 0.71 0 0 0 0 25 F 48 No 36.4 21 12.9 0.04 0.12 0.52 2.13 3.4 0 0 0 0 26 M 35 No 5.29 3.92 0.01 0.03 0 1.8 4.28 7.2 0 0 0 0 28 F 39 Yes 2.53 0.86 0.86 0.86 0.86 0.86 26.1 0.11 0 0 0 0 29 M 60 No 2 0.97 0 0 1.06 2.99 2.21 1.73 0 0 0 0 30 M 43 No 1.7 0.45 0 0 0.59 0.37 0.43 0.44 0.95 0 0 0 VIT = v enom imm unother ap y; F = f emale; M = male; i1 = whole bee v enom whole e xtr act.
two (6.7%) to rApi m 10. Four patients (13.3%) were sensitized to all molecular allergens under study. These results are consistent with the literature, which shows that, since 1976, rApi m 1 has been considered the most relevant allergen of BV14 and the most frequent molecular allergen in patients with BV allergy,14,15 with rates ranging from 57 to 97%.13,16,17
Although it is clear that rApi m 1 is helpful in improving clinical diagnosis, other allergens are also considered specific to BV allergy, namely rApi m 3, rApi m 4, and rApi m 10.13 Increasing the number of BV allergens available for molecular characterization of sensitization profiles can improve diagnostic accuracy. Kohler et al., using all available BV allergens, reported that at least one of them could be detected in 94.4%, while the specific allergens rApi m 1, rApi m 3, rApi m 4, or rApi m 10 were detected in 89.6% of patients allergic to BV.13 In the present study, the association of rApi m 1, rApi m 3, and/or rApi m 10 allowed the detection of BV sensitization in 100% of patients.
Group A Group B
Median a IQR25/75 a Median b IQR25/75 b Median a IQR25/75 a Median b IQR25/75 b
i1 8.88 3.59/25.88 7.36 1.61/65.88 8.99 2.18/24.35 4.0 1.93/15.00 rApi m1 3.65 0.88/19.28 2.55 0.95/28.91 1.55 0.41/7.68 2.02 0.42/6.66 sIgE rApi m2 0.99 0.03/2.69 0.63 0.05/9.25 0.03 0/1.03 0.11 0.01/0.69 rApi m3 0.09 0.03/0.59 0.08 0.02/2.45 0.03 0/0.18 0.02 0/0.08 rApi m5 0.29 0.02/3.03 0.85 0.03/3.39 0.11 0/1.03 0.13 0.01/1.4 rApi m10 2.6 0.46/4.47 1.16 0.21/5.29 0.61 0.12/4.27 0.45 0.06/4.1 i1 1.2 0.002/5.22 0.94 0/11.1 0.66 0/3.54 3.245 0.64/6.65 rApi m1 0.31 0/2.12 7.7 2.99/23.55 0.1 0/2.01 4.475 0.47/6.803 sIgG4 rApi m2 0.045 0/0.202 0.51 0/1.115 0 0/0.22 0 0/0.44 rApi m3 0 0/0 0 0/0 0 0/0 0 0/0 rApi m5 0 0/0 0 0/0.03 0 0/0.02 0 0/0 rApi m10 0 0/0 0 0/0 0 0/0 0 0/0 Table 3
Median and interquartile range values of sIgE and IgG4 in groups A and B before (T0) and 1 year after VIT (T1)
a before VIT; b 1 year after VIT; VIT = venom immunotherapy; IQR = interquartile range; i1 = whole bee venom whole extract.
We did not analyze rApi m 4 due to commercial unavailability. Regarding the frequency of rApi m 10, our data showed that it was the second most frequent molecular component. This is similar to the results reported in the literature, with rates ranging from 49 to 70%.16,17
It is also known that other BV molecular recombinants, such as rApi m 2 and rApi m 5, can identify cross-reactivity to rVes v 2 and rVes v 3, which are wasp venom recombinants.13 This may allow discrimination between true sensitization to bee or wasp venom.
The main goal of this study was to determine an association between sensitization profiles and systemic reactions during the build-up phase of VIT using BV molecular recombinants, in an attempt to assess the risk of systemic reactions before starting treatment. We did not find an association between the molecular sensitization profile of patients and the occurrence of systemic reactions during the build-up
phase of VIT. In fact, this is a small group of patients and probably other BV molecular components may be involved. In the literature, studies aiming to predict the severity of BV reactions have yielded conflicting results. Consistent with our results, Gattinger et al. also did not find an association between BV molecular levels and the severity of BV reactions.18 Guan et al. concluded that the severity of allergic reactions in patients with BV allergy was correlated with IgE specific activity (sIgE to total IgE ratio).19 Conversely, some BV recombinants have been associated with reaction severity and might serve as potential biomarkers of severity, predicting the occurrence of systemic reactions during VIT. Ruiz et al. found an association between the incidence of systemic reactions during the build-up phase of VIT and sIgE to rApi m 4, even at low levels. They also concluded that, in severe systemic reactions, rApi m 1 and rApi m 2 were predictors of severity, independently of rApi m 4.20 Although promising, these results were obtained in a sample of 19 patients and, for this reason, they should be interpreted with caution. In another study by Ruiz et al., considering only rApi m 4, more systemic reactions were observed in the group of patients with higher rApi m 4 levels, which was associated with poor VIT tolerance.21 In contrast, Korosec et al. found an association between low sIgE to rApi m 1 levels and severe reactions during the build-up phase of VIT.22 Our data showed no difference between patients with lower or higher sIgE to rApi m 1 levels and systemic reactions during the build-up phase. Frick et al. found an association between non-VIT responders and increased sIgE to rApi m 10 levels.23
Our results also showed that, 1 year after VIT, there was a significant decrease in sIgE to whole BV extract (p=0.0451), rApi m 3 (p=0.017), and rApi m 10 (p=0.021) in the group of patients without reactions during the build-up phase of VIT. Although a decrease in sIgE to rApi m 3 and rApi m 10 levels has been documented, no increase in sIgG4 to rApi m 3 and rApi m 10 levels has been observed. Also, a significant increase was observed in sIgG4 to rApi m 1 levels (p<0.0001), confirming its relevance in BV allergy. Although rApi m 3 and rApi m 10 are specific BV allergens, the absence or underrepresentation of these recombinants has been demonstrated in BV preparations used for VIT.17,23 Because rApi m 10 is a frequent BV allergen and its measurement is available on a widely used test platform, it seems reasonable to recommend that sIgE to rApi m 10 should be tested in all patients with BV allergy. In
patients with a predominance of rApi m 10, VIT should be performed with a BV preparation in which the presence of a relevant amount of rApi m 10 has been documented.23
Limitations of the present study include the retrospective nature of data collection and a limited number of patients. In this respect, our results highlight the need for clinical studies with larger sample sizes and more molecular components in order to characterize different sensitization profiles and possible associations with different treatment options. These profiles could be used as biomarkers of disease severity and treatment response, thereby increasing the potential benefits of VIT.
Conclusion
Molecular diagnosis revealed additional specific BV allergens, improving the sensitivity and accuracy of BV allergy diagnosis and allowing the identification of distinct sensitization profiles. In the present study, no association was found between the occurrence of systemic reactions during the build-up phase of VIT and the molecular sensitization profile of the patients. A significant decrease was observed in sIgE to whole BV extract, rApi m 3, and rApi m 10 levels in the group of patients without reactions during the build-up phase of VIT. One year after VIT, however, only a significant increase in sIgG4 to rApi m 1 levels was observed. Further studies are needed to define the basis of severity molecular biomarkers to identify systemic reactions during the build-up phase of VIT in order to prevent and reduce their occurrence.
Acknowledgement
We are grateful to Phadia-ThermoFisher Scientific (Uppsala, Sweden) for providing the ImmunoCAP tests.
1. Sturm GJ, Varga EM, Roberts G, Mosbech H, Bilo MB, Akdis CA, et al. EAACI Guidelines on allergen immunotherapy: Hymenoptera venom allergy. Allergy. 2018;73(4):744-64.
2. Golden DB. Anaphylaxis to insect stings. Immunol Allergy Clin North Am. 2015;35(2):287-302.
3. Müller UR. Bee venom allergy in beekeepers and their family members. Curr Opin Allergy Clin Immunol. 2005;5(4):343-7. 4. Clark S, Camargo CA Jr. Epidemiology of anaphylaxis. Immunol
Allergy Clin North Am. 2007;27(2):145-63.
5. Liew WK, Williamson E, Tang ML. Anaphylaxis fatalities and admissions in Australia. J Allergy Clin Immunology. 2009;123(2):434-42.
6. Jakob T, Rafei-Shamsabadi D, Spillner E, Müller S. Diagnostics in hymenoptera venom allergy: current concepts and developments with special focus on molecular allergy diagnostics. Allergo J Int. 2017;26:93-105.
7. Bozek A, Koodziejczyk K. Safety of specific immunotherapy using an ultra-rush induction regimen in bee and wasp allergy. Human vaccine & immunotherapeutics. 2018;14(2):288-91.
8. Martignago I, Incorvaia C, Ridolo M. Preventive actions of allergen immunotherapy: the facts and the effects in search of evidence. Clin Mol Allergy. 2017;15:13.
9. Boyle RJ, Elremeli M, Hockenhull J, Cherry MG, Bulsara MK, Daniels M, et al. Venom immunotherapy for preventing allergic reactions to insect stings. Cochrane Database Syst Rev. 2012; 10:CD008838. 10. Sastre J, Rodríguez F, Campo P, Laffond E, Marín A, Alonso
MD. Adverse reactions to immunotherapy are associated to different pattern of sensitization to grass allergens. Allergy. 2015;70(5):598-600.
11. Mueller HL. Diagnosis and treatment of insect sensitivity. J Asthma Res. 1966;3(4):331-3.
12. Birnbaum J, Ramadour M, Magnan A, Vervloet D. Hymenoptera ultra-rush venom immunotherapy (210 min): a safety study and risk factors. Clin Exp Allergy. 2003;33(1):58-64.
13. Köhler J, Blank S, Müller S, Bantleon F, Frick M, Huss-Marp J, et al. Component resolution reveals additional major allergens in patients with honeybee venom allergy. J Allergy Clin Immunology. 2014;133(5):1383-9.
14. Sobotka AK, Franklin RM, Adkinson NF, Valentine MD, Bear H, Lichtenstein LM. Allergy to insect stings. II. Phospholipase A: the major allergen in honeybee venom. J Allergy Clin Immunol. 1976;57:29-40.
15. Ruiz B, Serrano P, Moreno C. IgE-Api m4 is useful for identifying a particular phenotype of bee venom allergy. J Investig Allergol Clin Immunol. 2016;26(6):355-61.
16. Sobotka AK, Franklin RM, Adkinson NF, Valentine MD, Bear H, Lichtenstein LM. Allergy to insect stings. II. Phospholipase A: the major allergen in honeybee venom. J Allergy Clin Immunol. 1976;57:29-40.
Correspondence: Tatiana Lourenço
E-mail: [email protected]
No conflicts of interest declared concerning the publication of this article.
17. Jakob T, Müller U, Helbling A, Spillner E. Component resolved diagnostics for hymenoptera venom allergy. Curr Opin Allergy Clin Immunol. 2007;17(5):363-72.
18. Gattinger P, Lupinek C, Kalogiros L, Silar M, Zidarn M, Korosec P, et al. The culprit insect but not severity of allergic reactions to bee and wasp venom can be determined by molecular diagnosis. PLoS One. 2018;13(6).
19. Guan K, Li LS, Yin J. Use of sIgE/T-IgE in Predicting Systemic Reactions: Retrospective Analysis of 54 Honeybee Venom Allergy Cases in North China. Chin Med J. 2016;129:2091-5.
20. Ruiz B, Serrano P, Verdú M, Moreno. Sensitization to Api m1, Api m2, and Api m4: association with safety of bee venom immunotherapy [Letter]. Ann Allergy Asthma Immunol. 2015;114:350-2. 21. Ruiz B, Serrano P, Moreno C. IgE- Api m4 is useful for identifying a
particular phenotype of bee venom allergy. J Investig Allergol Clin Immunol. 2016;26(6):355-61.
22. Korošec P, Žiberna K, Šilar M, Dežman M, Čelesnik Smodiš N, Rijavec M, et al. Immunological and clinical factors associated with adverse systemic reactions during the build-up phase of honeybee venom immunotherapy. Clinical et Experimental Allergy. 2015;45:1579-89.
23. Frick M, Fischer J, Helbling A, Ruëff F, Wieczorek D, Ollert M, et al. Predominant Api m 10 sensitization as risk factor for treatment failure in honey bee venom immunotherapy. J Allergy Clin Immunol. 2016;13(6):1663-71.