Interictal spike EEG source analysis in hypothalamic hamartoma epilepsy
Alberto J.R. Leal
a,*, Vitorina Passa˜o
b, Eula´lia Calado
c, Jose´ P. Vieira
c, Joa˜o P. Silva Cunha
da
Department of Neurology, Hospital Fernando Fonseca, IC19, 2700 Amadora, Portugal
b
Department of Neurology, Hospital Ju´lio de Matos, Lisbon, Portugal
c
Department of Pediatric Neurology, Hospital Dona Estefaˆnia, Lisbon, Portugal
d
Department of Electronic Telecommunications and IEETA, University of Aveiro, Aveiro, Portugal Accepted 22 July 2002
Abstract
Objective: The epilepsy associated with the hypothalamic hamartomas constitutes a syndrome with peculiar seizures, usually refractory to medical therapy, mild cognitive delay, behavioural problems and multifocal spike activity in the scalp electroencephalogram (EEG). The cortical origin of spikes has been widely assumed but not specifically demonstrated.
Methods: We present results of a source analysis of interictal spikes from 4 patients (age 2–25 years) with epilepsy and hypothalamic hamartoma, using EEG scalp recordings (32 electrodes) and realistic boundary element models constructed from volumetric magnetic resonance imaging (MRIs). Multifocal spike activity was the most common finding, distributed mainly over the frontal and temporal lobes. A spike classification based on scalp topography was done and averaging within each class performed to improve the signal to noise ratio. Single moving dipole models were used, as well as the Rap-MUSIC algorithm.
Results: All spikes with good signal to noise ratio were best explained by initial deep sources in the neighbourhood of the hamartoma, with late sources located in the cortex. Not a single patient could have his spike activity explained by a combination of cortical sources.
Conclusions: Overall, the results demonstrate a consistent origin of spike activity in the subcortical region in the neighbourhood of the hamartoma, with late spread to cortical areas. q 2002 Elsevier Science Ireland Ltd. All rights reserved.
Keywords: Hypothalamic hamartoma; Epilepsy; Electric; Source analysis
1. Introduction
The hypothalamic hamartomas are rare malformations of the central nervous system, whose main manifestations are precocious puberty and epilepsy (Valdueza et al., 1994). The epilepsy is associated with peculiar laughing spells (gelastic seizures), dacrystic, partial complex and atonic seizures, which start in the first years of life. The seizures are quite refractory to medical therapy and the patients typi-cally have several fits daily.
The early onset, peculiar type of seizures, usually asso-ciated with progressive cognitive deterioration, and beha-vioural problems makes this a distinct epileptic syndrome (Berkovic et al., 1988).
The electroencephalogram (EEG) in this condition is characterized by multifocal, mainly fronto-temporal, spike activity (Striano et al., 1999), very often involving both hemispheres. Despite occasional suggestions of a cortical
origin for this activity, surgical results based on these find-ings were uniformly poor (Cascino et al., 1993). The few cases with a good outcome for epilepsy were all submitted to surgical resection of the hamartoma (Nishio et al., 1989, 1994; Valdueza et al., 1994; Rosenfeld et al., 2001; Palmini et al., 2002).
The good results from surgery strongly implied the hamartoma as the source of the ictal activity and its intrinsic epileptogenicity was confirmed with recordings from deep electrodes placed inside the lesion (Munari et al., 1995).
In this study, we describe the clinical data, magnetic resonance imaging (MRI) and EEG findings in 4 cases with the syndrome. We performed EEG source analysis of the interictal spike activity, with the goal of gaining a better understanding of the relationship between the hamartoma and the generators of the paroxysms recorded on the scalp. Results of this study have been published in abstract form (Leal, 2001).
1388-2457/02/$ - see front matter q 2002 Elsevier Science Ireland Ltd. All rights reserved. PII: S 1 3 8 8 - 2 4 5 7 ( 0 2 ) 0 0 2 5 3 - 5
www.elsevier.com/locate/clinph
CLINPH 2001714 * Corresponding author. Tel.: 1351-21-434-8269; fax:
1351-21-436-2275.
2. Methods 2.1. Clinical data 2.1.1. Patient 1
C.F.N., 25 year-old male. The gestational period, delivery and neonatal period were free of problems. He accom-plished the normal motor and cognitive milestones up to the age of 2 years. At this age he started with brief episodes (less than 1 min) of interruptions of consciousness and motor arrest, which occurred several times daily. Learning problems became apparent with a progressive delay in development. Performance at school was very poor, and he could barely read and write by the age of 15 years.
The atypical absence seizures remained uncontrolled, and by the age of 7 years, the epilepsy got worse with new types of seizures: complex partial, generalized tonic–clonic and sudden falls, with severe and repeated head trauma. Several seizures were reported daily, with little improvement result-ing from the different antiepileptic drugs tested.
By the age of 14 years the epilepsy remained uncontrolled but seizure free periods of weeks to months were observed, alternating with periods of more than 10 daily seizures. Severe behavioural problems became apparent, with periods of high aggressiveness, bulimia and hypersexual behaviour. These abnormal behaviours lasted for days to weeks, and alternated with periods of persistent hypersomnolence and others of normal behaviour. He was referred to a psychiatric hospital and in view of the increasing difficulty in social interaction was chronically institutionalized at the age of 20 years.
The hypothalamic hamartoma (Fig. 2) was diagnosed at the age of 15 years in a computerized tomography scan (CT scan), and the diagnosis was later confirmed by a biopsy. 2.1.2. Patient 2
T.M.M.H., 11 year-old boy, 3rd son of healthy parents. No family history of epilepsy or other neurological diseases was present. The gestational period was normal, vaginal delivery with cephalic presentation occurred at the 40th week and no problems were observed in the neonatal period. From the first weeks of life almost daily, non-febrile, brief episodes of motor arrest, loss of contact and tonic turning of the eyes became apparent. The episodes lasted less than 1 min and were followed by mild prostration. An EEG at 12 months revealed spike activity and the patient
was started on medication with sodium valproate, which produced a clear reduction of seizures to one or two per week.
Mild delay of motor and cognitive milestones became apparent; he walked unaided only at 18 months of age and pronounced sentences with 4 years.
In the first years, occasional falls were present with the seizures, but they became less and less frequent, stopping by the time he started school. The first gelastic seizures were reported with 6 years and rapidly became the predominant type, occurring 3–4 times daily. The laughing episodes lasted less than 1 min and lacked emotional content. At the age of 8 years, the first dacrystic seizures were noticed, with brief episodes of weeping without the appropriate emotional context. Both seizure types occurred several times daily, but the latter became slowly predominant.
Video–EEG studies at ages of 8 and 11 years revealed the absence of clear ictal spike activity, with very rare and low amplitude interictal spikes occurring independently over both frontal lobes (Fig. 3; Table 1). A MRI at age 8 revealed the hypothalamic hamartoma (Fig. 4).
At the time of the study severe learning problems are apparent at school, with several dacrystic seizures daily and occasional gelastic ones.
2.1.3. Patient 3
D.P.R., 5 year-old girl. The mother suffers from epilepsy since the first year of life, and from type I neurofibromatosis. There is no history of either epilepsy or neurofibromatosis in other family members.
During pregnancy the mother had been medicated with Carbamazepine and Phenobarbitone, and because of this the pregnancy was considered of high risk and was medically assisted. No problems were apparent during this period. Delivery occurred at the 40th week and was slightly dystocic (forceps was used). The baby presented no problems in the neonatal period.
The development was normal: she smiled in the first month, made gait acquisition at age 9 months and pronounced meaningful sentences with less than 2 years of age. Cutaneous spots characteristic of neurofibromatosis clearly revealed the transmission of the disease from the mother.
When she was 18 months she had the first seizure, initiated by motor arrest with loss of contact, followed by tonic turning of the eyes and fall with clonic movements of
Table 1 Clinical data Age (years) Sex Hamartoma diameter (cm)
Background EEG Spike activity Seizure types
Patient 1 25 M 2.5 Slow (7 Hz) Frontal/temporal (predominantly right) Partial complex and astatic Patient 2 11 M 0.8 Slow (7.5 Hz) Frontal (predominantly right) Gelastic, dacristic and astatic. Patient 3 5 F 1.3 Normal Fontal (no lateralization) Partial complex and tonic Patient 4 2 F 2.5 Normal Temporal (right side) Gelastic and partial complex
the limbs. No fever was present at the time and deep sleep followed. Two weeks later a similar, non-febrile, seizure occurred. She started medication with sodium valproate, with stabilization of the seizure frequency at one to two per month. Other antiepileptic drugs tested were unsuccess-ful to improve the epilepsy, which progressively got worse, reaching several seizures daily.
The EEGs revealed very frequent multifocal spike activ-ity in the frontal lobes (Table 1; Fig. 5a), with bilateral synchronization and generalization. A MRI at age 2 revealed the hypothalamic hamartoma (Fig. 6).
2.1.4. Patient 4
N.S.M., 2 year-old girl. The pregnancy was complicated with bleeding in the first trimester, but was otherwise uneventful and medically assisted. There was a medical
record of a previous spontaneous abortion. Pelvic delivery occurred at the 35th week of conceptional age, with no problems. The birth weight was 2.270 kg, the Apgar score 9–10, and the baby looked healthy. She accomplished the motor and cognitive milestones normally (good interaction from the first months, gait acquisition at 14 months of age, first words with less than 1 year and sentences with 2 years). From the first weeks of life, brief (less than 1 min), episodes of emotionally inappropriate laughing were present, occurring more than 10 times daily and followed by transient decrease in motor activity. These gelastic fits persisted in the following months, and became more frequent when the child was frustrated or deeply concen-trated playing with toys. At 1 year of age, the occasional occurrence of weeping accompanying the laughing was noted. The typical episode started with a deep and imper-ceptible throat sound, followed by laughing and sometimes weeping, all lasting less than 1 min. The patient reacted correctly when asked to perform specific tasks during the seizures, and no loss of contact was apparent.
By the age of 2 years, a brief interruption of conscious-ness with tonic turning of the eyes at the end of the seizure became apparent, sometimes with sudden falls. Other type of late seizure manifestations appearing at this time included vomiting, with loss of body strength and slow fall-ing to the ground, without loss of consciousness.
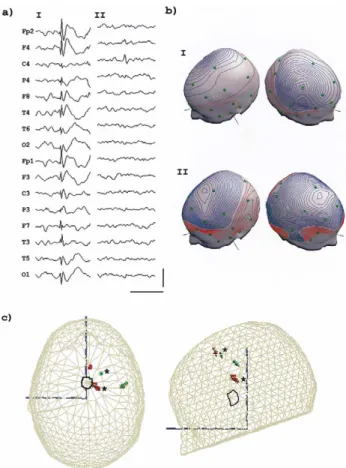
Fig. 1. Patient 1: (a) The 3 types of interictal spikes, in non-averaged raw EEG, with a peak in frontal (I), right (II) and left (III) temporal areas. Horizontal scale: 500 ms; vertical scale: 200 mV. (b) Electric potential over the scalp surface at spike onset, showing two clear maxima on opposite hemispheres in a dipolar distribution. Electrodes are represented in green; (c) Boundary element model (BEM) with tesselation for scalp, outer and inner skull boundaries (the last two are not shown). The initial ( p ) and peak of the spike instantaneous moving dipoles are shown for spike I (red) [explained variance (EV) of 80 and 95%], II (blue) [EV of 94 and 95%] and III (green) [EV of 95 and 93%]. The hamartoma is represented as the outlined area in black.
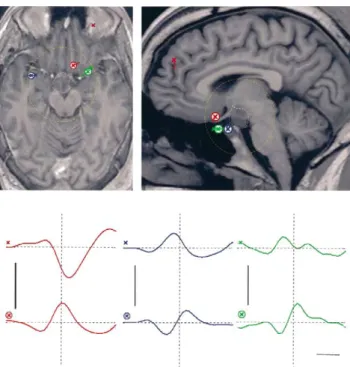
Fig. 2. Recursively applied multiple signal classification (Rap-MUSIC) analysis for patient 1, with source localization and their activation curves. Sources are projected on the axial and sagittal planes through the center of the hamartoma. The sources with the earliest peak of activation for each spike type are circled (red for type I, blue for type II and green for type III). The hamartoma is outlined in white and the boundaries of the neighbour-hood outlined in yellow. The horizontal bar represents a 20 ms time scale, while the vertical bars corresponds to a 500 hAm activity scale. The verti-cal dotted line represents the spike peak.
Abnormal breast development and pubic hair were noted and an investigation with head MRI was performed for the precocious puberty. This test revealed a hypothalamic lesion with the characteristics of a hamartoma (Fig. 8).
Carbamazepine was started 3 months before this study, and a reduction in the late manifestations of the seizures was produced, with disappearance of falls and loss of conscious-ness. Nevertheless the seizures still occur several times (5– 6) daily.
2.2. EEG acquisition and processing
The interictal EEG data was obtained during video–EEG monitoring (Telefactor Beehive; Zwolle, the Netherlands), lasting from 6 to 48 h. The sampling frequency was 200 Hz and a set of 27 scalp electrodes was used for patient 1, while 32 electrodes were used for all other patients.
The EEG was inspected visually using an average refer-ence montage and spikes with a clear distinction from the background and no artifacts were selected for further analy-sis. A visual classification of spikes was done, based on the
morphology and spatial topography at the peak (Figs. 1a, 3a, 5a, and 7a). As many different topography classes were defined as required to represent all the spike types present in the record of each patient.
All EEG epochs were high pass filtered with a time constant of 0.16 s and a low pass filter of 35 Hz. The spikes for each class were then averaged after synchronization by the peak at the channel with the highest spike amplitude. The number of averages ranged from a minimum of 10 to a maximum of 43 for different classes (Table 2).
2.3. MRI acquisition and processing
The MRI data was obtained from volumetric T1 spoiled gradient recalled (SPGR) acquisitions, with a field of view including the nasion, pre-auricular points and the scalp. Other non-volumetric sequences were used for diagnosis but are not considered in this work.
For each patient the volumetric MRI was used to build a boundary element model (BEM) including tesselations for the scalp, outer and inner skull, to be used for EEG source localization.
2.4. Electrodes
The 3D positions of electrodes were determined in rela-tion to the nasion and pre-auricular points, according to the method of De Munck et al. (1991). Registration of the elec-trodes with the volumetric model was done using the nasion and pre-auricular points as fiducial points.
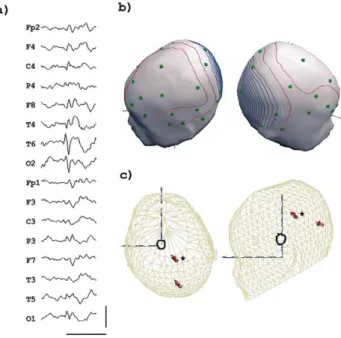
Fig. 3. Patient 2: (a) Sample of the raw (non-averaged) EEG data with the two spike types. Horizontal scale: 500 ms; vertical scale: 100 mV. (b) Potential maps over the scalp at spike onset, demonstrating an overall dipolar voltage distribution with an anterior negative maxima and a poster-ior positivity; (c) Moving dipole models for the two types of spikes, with spike onset ( p ) and peak dipoles for type I (red) [EVs of 90 and 97%] and type II (green) [EVs of 87 and 96%].
Fig. 4. Rap-MUSIC analysis for patient 2. Represented are spike type I (red) and II (blue) with source localizations projected on the axial and sagittal planes through the center of the hamartoma, and their activation curves. The sources with the earliest peak of activation are circled and the hamar-toma is outlined in white, with the neighbourhood outlined in yellow. The time and activation scales are the same as in Fig. 2.
2.5. Source localization
The resolution of the inverse problem is critically depen-dent on the constrain conditions imposed on the possible solutions. Because there is no a priori knowledge of the appropriate ones in our patients, we decided to use two models with different constrains on the solutions, trying to determine the number of generators present as well as their localization and sequence of activation. The main goal is not to compare the different methods, but instead to determine their complementarity in the characterization of the final solution.
The initial source localization was done using a realistic 3 shell BEM single moving dipole solution for each class, at time instants where the scalp potential showed a dipolar distribution (Figs. 1b, 3b, 5b, and 7b). A searching proce-dure based on the Marquardt algorithm was used from spike onset up to the spike peak. The instantaneous solutions allow an evaluation of the ‘center of mass’ of the intracra-nial sources and provide a rough evaluation of their origin and progression in a simple model. This model has impor-tant, experimentally determined (Van den Broek et al.,
1998; Krings et al., 1999; Cuffin et al., 2001), localization capabilities of the early generators of spike activity provided there is only one source active at that time. Their main limitations are: the possible existence of several sources simultaneously active, leading to ambiguities on the interpretation of the single dipole solution and because no complete scanning of the volume is done, there is the potential for the algorithm to get trapped in a local minimum solution instead of a global one.
The recursively applied multiple signal classification (Rap-MUSIC) algorithm was used to scan the intracranial volume for dipolar solutions (Mosher et al., 1999; Kobaya-shi et al., 2002a,b), trying to establish the number and general localization of the generators present. After a singu-lar value decomposition of the spatio-temporal matrix of the averaged spike data, a signal space with lower dimension was produced. Scanning of the volume of interest was done searching for the dipolar source with the highest correlation with the signal space. The dimension of this space was then reduced by projecting it away from the previous solution at each itteration and the process repeated until the source with the highest projection in the remaining space achieved an explained variance lower than 95%. The point location of each source as well as its activation curve was obtained. The sources were then ordered for the time to first peak of acti-vation and the final solutions represented on the volumetric MRIs (Figs. 2, 4, 6 and 8). Because a comprehensive scan-ning of the volume is done no local minimum interference is present, and there is also no need to postulate a priori the number of generators, which constitutes one of the strongest
Fig. 5. Patient 3: (a) Spike types as seen in the raw (non-averaged) EEG. Horizontal scale: 500 ms; vertical scale: 200 mV. (b) Potential maps over the scalp at spike onset, with two clear maxima of opposite polarity. Elec-trodes are in green (c) Moving dipole models for spike I (red) [EVs of 85% and 94%] and II (green) [EVs of 90 and 95%] at spike onset ( p ) and spike peak.
Fig. 6. Rap-MUSIC analysis for patient 3 of the two spike types I (red) and II (blue). The sources are projected on the axial and sagittal planes through the center of the hamartoma, and the ones with the earliest peak of activa-tion are circled. The hamartoma is outlined in white and the neighbourhood in yellow. Time and activation scales are as in Fig. 2.
advantages of the algorithm. The main limitation is the resulting imprecise localization information due to the dependence of successive generators on the localization information of previous ones.
A procedure to quantify the concept of ‘neighbourhood of the hamartoma’ was implemented, which takes into consid-eration the variability in size of the lesion between different patients (Table 1) and the localization uncertainty of dipolar solutions for the inverse problem reported in the literature
(Van den Broek et al., 1998; Krings et al., 1999; Van Burik and Peters, 2000; Cuffin et al., 2001). The neighbourhood is defined as the spherical volume with center on the hamar-toma and radius equal to the sum of half the hamarhamar-toma diameter for the particular patient and an estimated upper limit of the localization error assumed as 2.0 cm for all patients (Table 2).
The moving dipole model was implemented with the advanced source analysis (ASA) software (ANT software b.v.; Enschede, the Netherlands). For the Rap-MUSIC models, we used the software BESA 4.2 (MEGIS software GmbH, Munich, Germany), which uses a standardized finite element model of the scalp, skull and brain volumes, obtained from an averaged head using 24 normal individual MRIs.
3. Results
3.1. Interictal EEG
The background EEG activity was normal for age in patients 3 and 4, slightly slowed in patient 2 (7–8 Hz) and clearly slow (7 Hz) in patient 1 (Table 1). The sleep archi-tecture was preserved in all cases.
Patient 1 showed an excess of slow, high amplitude, delta waves, mainly over the fronto-temporal areas, which was not present in any of the other patients.
The first 3 patients exhibited spike activity involving both hemispheres (Figs. 1a, 3a, and 5a), while in case 4 only the right hemisphere was involved (Fig. 7a). All had a limited number of spike types (1–3), with two clear maxima over the scalp, with a dipolar potential distribution (Figs. 1b, 3b, 5b and 7b).
The amount of paroxysmal activity was heterogeneous. Patient 3 had the most prominent one, with very frequent frontal high ampitude spikes, which occurred in bursts last-ing a few seconds and with frequent generalizations (Fig. 5a). Patients 1 and 4 were in the middle range, with frequent multifocal activity over the fronto-temporal areas of both hemispheres (Fig. 1a) and in the posterior right hemisphere (Fig. 7a), respectively. In patient 2 the spike activity was very scarce and of low amplitude, but two independent foci over the frontal areas could be identified (Fig. 3a). Sleep greatly increased the amount of spike activity in all but patient 2.
3.2. MRI data
The hamartomas evaluated in the SPGR T1 MRI sequences were all sessile, and could be classified as II.a (case 2) and II.b (cases 1, 3 and 4) in the anatomical classi-fication of Valdueza et al. (1994).
No cortical lesions could be found in our 4 cases but in patient 3 white matter scattered myelination abnormalities were present, with the typical features described in type I neurofibromatosis (Duffner et al., 1989).
Fig. 7. Patient 4: (a) Raw non-averaged EEG. Horizontal bar: 500 ms; vertical bar: 100 mV. (b) Scalp potential map at spike onset. (c) Moving dipole model at spike onset ( p ) and spike peak (EVs of 89 and 90%).
Fig. 8. Rap-MUSIC results for patient 4, with a deep early activating source and a more superficial one. Time and activation scales as in Fig. 2.
All cases exhibited an asymmetrical implantation of the hamartoma on the hypothalamus (Figs. 2, 4, 6 and 8), with predominant connection to the right side.
In cases 1, 3 and 4 there was concordance between the predominant spike lateralization and the anatomical one, while there was no such correlation for patient 2.
3.3. Moving dipole model
Patient 1 showed subcortical dipoles located in the deep temporal and orbito-frontal areas, with limited spatial spread between spike onset and peak (Fig. 1c). Dipoles for spike types I and III were located inside the hamartoma neighbourhood, while dipoles for type II were outside (Table 2).
In patient 2, the earliest generator of spike type I was located inside the hamartoma neighbourhood (Table 2), but for spike type II all generators were outside such a neighbourhood (Fig. 3c).
In patient 3, spike type I showed an early dipole within the hamartoma neighbourhood (Table 2) with a late frontal dipole, while spike type II showed only cortical dipoles (Fig. 5c).
A pattern of an early subcortical dipole, outside the hamartoma neighbourhood (Table 2), with late spatial spread to cortical areas was present in patient 4 (Fig. 7c). 3.4. Rap-MUSIC model
For patient 1 each spike type produced two sources distributed inside the neighbourhood of the hamartoma, the temporal and the frontal lobes (Fig. 2). Spike type I produced an early activating source close to the hamartoma (Table 2) with a late activating one in the left frontal cortex. Spike type II produced two sources, both in the right temporal lobe. Two left temporal sources were recovered for spike type III, located in the fronto-temporal area.
The spike type I of patient 2 produced two sources with a pattern suggesting an origin in the hamartoma neighbour-hood and later spread to the lower left frontal lobe. For type II an early source was located in the hamartoma neighbour-hood and another in the right frontal lobe (Fig. 4).
For patient 3 the dominant type I and II spikes produced early sources near the hamartoma and late activating ones in the frontal and right central cortical areas, respectively (Fig. 6).
For patient 4 spike type I produced an early source at the hamartoma neighbourhood posterior boundaries, with a neocortical one, over the right occipital areas (Fig. 8).
4. Discussion 4.1. Clinical data
The reported cases express the main characteristics described for the epilepsy associated with hypothalamic hamartomas (Berkovic et al., 1988): they all started with seizures in the first years of life which were refractory to medical therapy, developmental problems were present in the two oldest patients, and gelastic fits were the predomi-nant seizure type (3 of 4 cases).
Patient 3 presented with type I neurofibromatosis, a genetic disease associated with a wide variety of central nervous system problems (Huson et al., 1988), usually with a low incidence of epilepsy. The high epileptogenicity of the hamartoma versus the low epileptogenicity of the white matter lesions present in neurofibromatosis (Duffner et al., 1989) makes it likely that the first is the cause of the epileptic activity.
The overall data is consistent with the postulated progres-sive cognitive deterioration of the syndrome (Berkovic et al., 1988), with the oldest patients showing clear learning and behavioural problems. The fact that cognitive and beha-vioural disturbances usually appear after long standing and refractory seizures suggests that they are causally related.
4.2. EEG data
A clear trend was apparent in the described cases for a progressive slowing of the background activity with age, a feature already described in the literature (Berkovic et al., 1988). No such progression could be found for the spike
Table 2
Moving dipole and Rap-MUSIC data
Neighbourhood radius (cm) Spike type (averaged spikes) Distance to hamartoma (cm) Moving dipole Rap-MUSIC
Patient 1 3.3 I(31) 3.1 2.4 II(43) 4.9 3.3 III(13) 1.9 3.2 Patient 2 2.4 I(36) 1.7 1.4 II(13) 4.3 1.9 Patient 3 2.7 I(10) 2.8 2.5 II(27) 5.4 2.4 Patient 4 3.3 I(10) 4.2 3.3
activity, which exhibited great inter-individual variability independent of age.
The multifocal spike activity is a common finding in previously described cases (Striano et al., 1999) and has been taken as suggestive of secondary epileptogenesis involving multiple neocortical areas (Berkovic et al., 1988). We are not aware of studies trying to establish the sources of such spike activity, but the uniformly poor results of surgical cortical resections (Cascino et al., 1993) strongly suggests that the primary epileptic focus lies at a subcortical location. The present study was undertaken to test the possi-bility that the scalp activity is not autonomous from the hamartoma, but merely the result of propagated activity of deep sources in the neighbourhood of the dysplastic lesion. 4.3. MRI data
The pathological diagnosis was confirmed with a biopsy in case 1.
In the other cases the diagnosis rested on the radiological aspects of the lesion present in the MRIs (Boyko et al., 1988; Valdueza et al., 1994): Homogeneous isointense to the cortex T1 sequences, hyperintense in T2 sequences, sessile attachment to the hypothalamus, lack of contrast enhancement and no progression on repeated examinations. The sessile character of the lesions observed in our cases is a common finding in patients with hamartoma and epilepsy (Arita et al., 1999), while pedunculated lesions are only associated with precocious puberty.
A trend to concordance between hamartoma and scalp spike activity lateralization was apparent in 3 cases. Case 2 did not express such concordance, but the spike activity was very scarce and asymmetry weak. This observation raises the interesting possibility that a careful anatomical characterization of the hamartoma anatomy might allow us to predict the spike lateralization.
4.4. Moving dipole model
The moving dipole model produced a pattern of early activating sources in the subcortical area for the dominant spike types of all patients with later spread to the frontal or temporal neocortical areas. The same pattern was present with most spike types, but in some only neocortical sources could be discovered. These were the ones with the most unfavourable signal to noise ratio, suggesting that this fact might prevent the recovery of other, more deeply located sources. Despite the fact that a BEM was used with the individual anatomical data, the model produced early subcortical sources outside the hamartoma neighbourhood in 4 of 8 spike types analyzed. This could be due to a concomitant activation of cortical and subcortical genera-tors, leading to a ‘center of mass’ in the middle range. That interpretation is supported by an analysis of the activation curves of the sources recovered by the Rap-MUSIC algo-rithm demonstrating a significant degree of concomitant
activation of cortical and subcortical sources (Figs. 2, 4, 6, and 8).
Overall, the single moving dipole model could not explain most spike types, which seem to originate from more than one brain area simultaneously and require more complex models to follow the spatio-temporal spreading patterns between these generators. Nevertheless, in a subset of patients a dipole source at the beginning of the spike can clearly be demonstrated in the hamartoma neighbourhood.
4.5. Rap-MUSIC
This method produces at each iteration a scanning of all the solution space, avoiding possible errors produced by local minima on the search procedure of the other dipolar methods used. The algorithm is fairly automatic, after the user specifies the epoch for the data, the number of compo-nents for the single value decomposition and the minimum correlation of the source with the signal space. The model allows the use of solutions other than the single dipole for the scanning procedure, but only this was used in this study. The fundamental advantage of this algorithm is that no previous estimation of the number of generators is needed, as it finds the successive best fitting dipoles at each ittera-tion. The information on the localization of the sources is less reliable as it depends on the localizations obtained in previous iterations. In this work we used the standard realis-tically shaped volume model of the software package BESA2000, as no software package incorporating a BEM volume conduction is known to us. It is our feeling that the use of such a model does not significantly affect the contri-bution of the method for the present study.
Most spike types produced a consistent early source in the neighbourhood of the hamartoma, with secondary sources in neocortical areas, mainly frontal and temporal. This suggests that the spikes observed on the scalp are originated in the hamartoma and are not independently generated in the cortex.
A close inspection of the activation curves of the different sources reveals an important concurrent degree of activity, explaining the inability of the single moving dipole to follow the complex spatial and temporal dynamics of the spike activity.
Generic model of interictal spike generation
Overall our results suggest that the largest majority, if not all, of the spike activity recorded on the scalp is generated in the neocortex adjacent to the recording electrodes, but it is in fact triggered by a generator in the neighbourhood of the hamartoma. Despite the fact that ictal and interictal activity must not originate from the same area, this seems to be the case in most patients where ictal scalp EEG is recorded (Cascino et al., 1993). Although the need to remove the hamartoma to obtain good control of this type of epilepsy is widely recognized, and not dependent on the interictal spike analysis, our results suggest that such procedure
could also cure the dysfunctional interictal epileptic activity and therefore lead to an improvement in cortical function.
The proposed model postulates a subcortical origin for the scalp spike activity, with later involvement of neocor-tical areas and provides a clear explanation both to the poor surgical results from neocortical resections and the wide-spread spike activity over a cortex without visible lesions. The present data further shows that the propagation patterns of spike activity from the hamartoma to the neocortex are in a reduced number for each patient, and that their complex spatial and temporal dynamics can be described with source analysis methods in EEG.
Acknowledgements
The authors are grateful to Professor Lopes da Silva and to Professor Thomas Kno¨sche for reviewing the paper and making useful critical comments. This work was partially supported by IEETA.
References
Arita K, Ikawa F, Kurisu K, Sumida M, Harada K, Uozumi T, Monden S, Yoshida J, Nishi Y. The relationship between magnetic resonance imaging findings and clinical manifestations of hypothalamic hamar-toma. J Neurosurg 1999;91:212–220.
Berkovic S, Andermann F, Melanson D, Ethier E, Feindel W, Gloor P. Hypothalamic hamartoma and ictal laughter: evolution of a character-istic epileptic syndrome and diagnostic value of magnetic resonance imaging. Ann Neurol 1988;23:429–439.
Boyko O, Curnes J, Oakes W, Burger P. Hamartomas of the tuber cinereum: CT, MR and pathologic findings. Amer J Neuro Radiology 1988;12:309–314.
Cascino G, Andermann F, Berkovic S, Kuzniecky R, Sharbrough F, Keen D, Bladin P, Kelly P, Olivier A, Feindel W. Gelastic seizures and hypothalamic hamartomas: evaluation of patients undergoing chronic intracranial EEG monitoring and outcome of surgical treatment. Neurology 1993;43:747–750.
Cuffin BN, Schomer DL, Ives JR, Blume H. Experimental tests of EEG source localization accuracy in realistically shaped head models. Clin Neurophysiol 2001;112:2228–2292.
De Munck J, Vijn P, Spekreijse H. A practical method for determining electrode positions on the head. Electroenceph clin Neurophysiol 1991;72:184–187.
Duffner P, Cohen M, Seidel G, Shucard D. The significance of MRI abnormalities in children with neurofibromatosis. Neurology 1989;39:373–378.
Huson S, Harper P, Compston D. Von Recklinghausen Neurofibromatosis. A clinical and population study in south-east Wales. Brain 1988;111:1355–1381.
Kobayashi K, Akiyma T, Nakahori T, Yoshinaga H, Gotman J. Systematic source estimation of spikes by a combination of independent compo-nent analysis and Rap-MUSIC. Clin Neurphysiol 2002a;113:713–724. Kobayashi K, Akiyama T, Nakahori T, Yosinaga H, Gotman J. Systematic source estimation of spikes by a combination of independent compo-nent analysis and Rap-MUSIC. Clin Neurophysiol 2002b;113:725–734. Krings T, Chiappa KH, Cuffin BN, Cochius JI, Connolly S, Cosgrove GR. Accuracy of EEG dipole source localization using implanted sources in the human brain. Clin Neurophysiol 1999;110:106–114.
Leal AJR. EEG source analysis of epileptic activity in hypothalamic hamar-toma. J Neurol Sci 2001;187(1):S231.
Mosher J, Baillet S, Leahy R. EEG source localization and imaging using multiple signal classification approaches. J Clin Neurophysiol 1999;16(3):225–238.
Munari C, Kahane P, Francione S, Hoffmann D, Tassi L, Cusmai R, Vige-vano F, Pasquier B, Betti O. Role of the hypothalamic hamartoma in the genesis of gelastic fits (a video–stereo–EEG study). Electroenceph clin Neurophysiol 1995;95:154–160.
Nishio S, Fujiwara S, Aiko Y, Takeshita I, Fukui M. Hypothalamic hamar-toma. Report of two cases. J Neurosurg 1989;70:640–645.
Nishio S, Morioka T, Fukui M, Goto Y. Surgical treatment of intractable seizures due to hypothalamic hamartoma. Epilepsia 1994;35(3):514– 519.
Palmini A, Chandler C, Andermann F, Costa da Costa J, Paglioli-Neto E, Polkey C, Rosenblatt B, Montes J, Martinez JV, Farmer JP, Sinclair B, Aronyk K, Paglioli E, Coutinho L, Raupp S, Portuguez M. Resection of the lesion in patients with hypothalamic hamartomas and catastrophic epilepsy. Neurology 2002;58:1338–1347.
Rosenfeld J, Harvey A, Wrennall J, Zacharin M, Berkovic S. Transcallosal resection of hypothalamic hamartomas, with control of seizures, in children with gelastic seizures. Neurosurgery 2001;48(1):108–118. Striano S, Meo R, Bilo L, Cirillo S, Nocerino C, Ruosi P, Striano P,
Estraneo A. Gelastic epilepsy: symptomatic and cryptogenic cases. Epilepsia 1999;40(3):294–302.
Valdueza J, Cristane L, Dammann O, Bentele K, Vortmeyer A, Saeger W, Padberg B, Freitag J, Herrmann H. Hypothalamic hamartomas: with special reference to gelastic epilepsy and surgery. Neurosurgery 1994;34:949–958.
Van Burik MJ, Peters MJ. Estimation of the electric conductivity from scalp measurements: feasibility and application to source localization. Clin Neurophysiol 2000;111:1514–1521.
Van den Broek SP, Reinders F, Donderwinkel M, Peters MJ. Volume conduction effects in EEG and MEG. Electroenceph clin Neurophysiol 1998;106:522–534.