Universidade de Aveiro 2014
Departamento de Biologia
Verónica Inês Jesus
Oliveira Nogueira
Avaliação da eficácia do tratamento químico com
nanomateriais na melhoria da qualidade de diferentes
efluentes industriais
Assessing the effectiveness of chemical treatment
with nanomaterials in improving the quality of
different industrial effluents
Universidade de Aveiro 2014
Departamento de Biologia
Verónica Inês Jesus
Oliveira Nogueira
Avaliação da eficácia do tratamento químico com
nanomateriais na melhoria da qualidade de
diferentes efluentes industriais
Assessing the effectiveness of chemical treatment
with nanomaterials in improving the quality of
different industrial effluents
Dissertação apresentada à Universidade de Aveiro para cumprimento dos requisitos necessários à obtenção do grau de Doutor em Biologia, realizada sob a orientação científica da Doutora Ruth Maria de Oliveira Pereira, Professora Auxiliar do Departamento de Biologia da Faculdade de Ciências da Universidade do Porto, da Doutora Isabel Maria Cunha Antunes Lopes, Investigadora auxiliar do Centro de Estudos do Ambiente e do Mar (CESAM) da Universidade de Aveiro e da Doutora Teresa Alexandra Peixoto da Rocha Santos, Professora Associada no ISEIT/Viseu do Instituto Piaget
Apoio financeiro da FCT e do FSE no âmbito do III Quadro Comunitário de
Aos meus pais e marido pelo incansável apoio.
“Apesar de tudo, a loucura não é assim uma coisa
tão feia como muita gente julga. Há tantas loucas felizes!”
Florbela Espanca
o júri
presidente Doutor João de Lemos Pinto
Professor Catedrático do Departamento de Física da Universidade de Aveiro Doutor Amadeu Mortágua Velho da Maia Soares
Professor Catedrático do Departamento de Biologia da Universidade de Aveiro Doutora Maria da Graça Bontempo Vaz Rasteiro
Professora Associada com Agregação da Faculdade de Ciências e Tecnologia da Universidade de Coimbra
Doutora Isabel Maria Cunha Antunes Lopes
Investigadora Principal do Departamento de Biologia da Universidade de Aveiro (Coorientadora)
Doutor António Paulo Alves Ferreira de Carvalho Professor Auxiliar da Faculdade de Ciências da Universidade do Porto
Doutora Maria Cláudia Gonçalves da Cunha Pascoal Professora Auxiliar da Universidade do Minho
Doutora Ana Cristina Cardoso Lopes Freitas
Professora Auxiliar do Instituto Superior Interculturais e Transdisciplinares do Instituto Piaget de Viseu
Doutora Ruth Maria de Oliveira Pereira
agradecimentos À Professora Doutora Ruth Pereira, poucas são as palavras para expressar todo o meu agradecimento, primeiro por ter acreditado em mim e me ter ajudado a chegar até aqui, pelos incentivos constantes e por todo o conhecimento que me tem transmitido e me permitem crescer tanto a nível científico como pessoal.
À Doutora Isabel Lopes pelo apoio científico e laboratorial, pela sua simpatia e palavras de apoio constante, pela sua amizade demonstrada desde o primeiro dia que tive o prazer de a conhecer.
À Doutora Teresa Rocha-Santos, Doutora Cristina Freitas e a Doutora Graça Rasteiro por me terem acolhido nos seus laboratórios, pela vossa ajuda e disponibilidade e todo o apoio científico.
Agradeço ao Professor Doutor Fernando Gonçalves pela oportunidade de trabalhar no seu laboratório, pela boa disposição, por promover o espírito de equipa e companheirismo.
A todos os meus amigos do Leader, aos que ficaram e aos que passaram e que continuam na minha vida, em especial, Miss, Nini, Cuco, Catarina, Joaninha, Nês Rosa, Nês Efe, Serginho e Sofia obrigado por todas as vossas palavras de conforto, companheirismo, partilha de conhecimento e boa disposição demonstrada ao longo deste meu percurso. Ao Bruno Castro, o meu bem-haja, por todas as palavras de conforto e me lembrar que apesar de longe estamos perto, e por me fazer chorar também! Agradeço também ao “grupinho do almoço” pelos bons momentos que nos proporcionam. As minhas meninas e meninos que me ajudaram no Inglês e que tão bons momentos que fizeram ter, Sirine, Mohamed, Bin e Brazileirinha. À Sara, Daniela, Revelação e Bruno Nunes agradeço a vossa boa disposição.
À maria Cátia por ser como é, por estar lá para ouvir e compreender, pelos momentos da loucura das Daphnias e músicas M80. O meu obrigado.
Às meninas do Piaget, Kátia, Dina e Celine pelos momentos de animação e por toda a ajuda e disponibilidade que sempre demostraram.
À Raquel, Bruna, Samir e Luís pelos nossos “Coffes” e por estarem sempre lá, nos momentos bons e menos bons, nas gargalhadas e nas brincadeiras. Ao meu Lucky que nos últimos meses tanto me tem animado durante a minha escrita.
À minha Mami e Papi e a minha irmã por serem como são e por estarem sempre lá…Adoro-vos.
Ao meu Ripolim por ter partilhado comigo todos os momentos destes últimos anos, os bons e os de maior stress, pelos abraços, por todas as palavras ditas
palavras-chave efluentes industriais, nanomateriais, ecotoxicidade, organismos aquáticos, degradação fotocatalítica, tratamento biológico.
resumo As atividades industriais são uma das principais fontes de poluição em todos os
ambientes. Dependendo do tipo de indústria, vários tipos de contaminantes orgânicos e inorgânicos são frequentemente libertados no meio ambiente, em concentrações que podem representar riscos para os meios aquáticos. Várias metodologias, nomeadamente físicas, químicas, biológicas ou a combinação de processos, têm sido propostas e aplicadas para minimizar o impacto destes efluentes, contudo nenhuma delas foi totalmente eficaz em termos de taxas de redução dos vários contaminantes, redução da toxicidade, e melhoria de algumas propriedades físicas e químicas dos diversos tipos de águas industriais residuais. É por isso imperativo o desenvolvimento de novas metodologias de tratamento, com recurso a novos materiais que vão surgindo no mercado. Neste contexto surge a nanotecnologia, oferecendo novas possibilidades no tratamento de efluentes com base nas propriedades físicas e químicas melhoradas dos nanomateriais (NMs), que podem aumentar consideravelmente o seu potencial de adsorção e oxidação. Embora as várias aplicações dos NMs possam trazer benefícios, o seu uso também irá contribuir para a sua introdução no ambiente e varias preocupações têm vindo a ser levantadas sobre estes materiais. As mesmas propriedades que tornam os NMs tão atrativos para aplicações ambientais também podem ser responsáveis por efeitos ecotoxicológicos nas comunidades naturais. Com o objetivo de selecionar NMs para o tratamento de efluentes orgânicos e inorgânicos avaliámos a toxicidade de nanopartículas de óxido de níquel (NiO) com 100 e 10-20 nm, de dióxido de titânio (TiO2,< 25 nm) e de óxido de ferro (Fe2O3,≈ 85x425 nm). A avaliação ecotoxicológica foi realizada através de uma bateria de ensaios com organismos aquáticos de diferentes níveis tróficos e grupos funcionais. Numa segunda etapa os dois NMs pré-selecionados foram aplicados no tratamento de efluente de lagar de azeite. Os NMs foram assim usados como catalisadores em processos de fotodegradação que incluíram os seguintes sistemas TiO2/UV, Fe2O3/UV, TiO2/H2O2/UV e Fe2O3/H2O2/UV. Utilização do TiO2 ou Fe2O3 com H2O2 revelou resultados bastante eficientes na melhoria de algumas propriedades químicas, no entanto, apesar de se ter verificado alguma redução da toxicidade para V.
fischeri, a maior percentagem de redução foi registada para o sistema H2O2/UV, sem a adição de NMs. Posteriormente foi também aplicado ao mesmo efluente um tratamento sequencial utilizando oxidação catalítica com NMs e fungos. Esta nova abordagem aumentou a redução da carência química de oxigênio, do conteúdo em fenóis e da toxicidade para V. fischeri, no entanto não se verificou qualquer redução de cor e compostos aromáticos após 21 dias de tratamento
quer nas propriedades químicas, quer em termos de redução da toxicidade. No entanto, para o efluente mineiro os tratamentos mais eficazes (TiO2/UV e Fe2O3/UV) apenas foram capazes de remover significativamente três metais (Zn, Al e Cd). Não obstante, estes tratamentos foram capazes de reduzir a toxicidade do efluente. Numa última etapa, avaliou-se a toxicidade dos resíduos sólidos formados após o tratamento de efluentes com NMs em larvas de Chironomus
riparius, uma espécie representativa do compartimento sedimentos, em meios
de água doce. Alguns desses resíduos mostraram a capacidade de afetar negativamente a sobrevivência e o crescimento de C. riparius, dependendo do efluente tratado, que os originou. Este trabalho abre novas perspetivas para a utilização de NMs no tratamento de efluentes industriais, e demonstra que apesar das aplicações anunciadas para os NMs, ainda são necessárias diversas avaliações, quer em termos da sua eficácia, quer da sua perigosidade para o ambiente antes da sua aplicação em grande escala.
keywords industrial wastewater, nanomaterials, ecotoxicity, aquatic organisms, photocatalytic degradation, biological treatment.
abstract Industrial activities are the major sources of pollution in all environments.
Depending on the type of industry, various levels of organic and inorganic pollutants are being continuously discharged into the environment. Although, several kinds of physical, chemical, biological or the combination of methods have been proposed and applied to minimize the impact of industrial effluents, few have proved to be totally effective in terms of removal rates of several contaminants, toxicity reduction or amelioration of physical and chemical properties. Hence, it is imperative to develop new and innovative methodologies for industrial wastewater treatment. In this context nanotechnology arises announcing the offer of new possibilities for the treatment of wastewaters mainly based on the enhanced physical and chemical proprieties of nanomaterials (NMs), which can remarkably increase their adsorption and oxidation potential. Although applications of NMs may bring benefits, their widespread use will also contribute for their introduction into the environment and concerns have been raised about the intentional use of these materials. Further, the same properties that make NMs so appealing can also be responsible for producing ecotoxicological effects. In a first stage, with the objective of selecting NMs for the treatment of organic and inorganic effluents we first assessed the potential toxicity of nanoparticles of nickel oxide (NiO) with two different sizes (100 and 10-20 nm), titanium dioxide (TiO2, < 25 nm) and iron oxide (Fe2O3, ≈ 85x425 nm). The ecotoxicological assessment was performed with a battery of assays using aquatic organisms from different trophic levels. Since TiO2 and Fe2O3 were the NMs that presented lower risks to the aquatic systems, they were selected for the second stage of this work. Thus, the two NMs pre-selected were tested for the treatment of olive mill wastewater (OMW). They were used as catalyst in photodegradation systems (TiO2/UV, Fe2O3/UV, TiO2/H2O2/UV and Fe2O3/H2O2/UV). The treatments with TiO2 or Fe2O3 combined with H2O2 were the most efficient in ameliorating some chemical properties of the effluent. Regarding the toxicity to V. fischeri the highest reduction was recorded for the H2O2/UV system, without NMs. Afterwards a sequential treatment using photocatalytic oxidation with NMs and degradation with white-rot fungi was applied to OMW. This new approach increased the reduction of chemical oxygen demand, phenolic content and ecotoxicity to V. fischeri. However, no reduction in color and aromatic compounds was achieved after 21 days of biological treatment. The photodegradation systems were also applied to treat the kraft pulp mill and
Nonetheless the treatments were able of reducing the toxicity of the effluent. As a final stage, the toxicity of solid wastes formed during wastewater treatment with NMs was assessed with Chironomus riparius larvae, a representative species of the sediment compartment. Certain solid wastes showed the potential to negatively affect C. riparius survival and growth, depending on the type of effluent treated. This work also brings new insights to the use of NMs for the treatment of industrial wastewaters. Although some potential applications have been announced, many evaluations have to be performed before the up-scaling of the chemical treatments with NMs.
TABLE OF CONTENTS
List of Figures
List of Tables
Chapter I
General introduction ... 29
1.1 Wastewater discharges and treatment: European and national regulations .... 29
1.2 Some of the most concerning wastewaters ... 32
1.2.1 Olive oil mill wastewaters (OOMW) ... 32
1.2.2. Paper mill wastewaters ... 35
1.2.3 Mining effluents ... 37
1.3. Treatments for organic and inorganic effluents ... 38
1.4. Nanomaterials for remediation/wastewater treatment ... 41
1.5. Goals and thesis structure ... 43
1.6 References ... 46
Chapter II
Assessing the ecotoxicity of metal nano-‐oxides with potential for
wastewater treatment ... 61
Abstract ... 61
2.1 Introduction ... 61
2.2 Materials and Methods ... 64
2.2.1 Tested nanomaterials ... 64
2.2.2 Characterization of aqueous suspensions of NMs ... 64
2.2.3 Ames Test with Salmonella typhimurium ... 65
2.2.4 Growth tests with Raphidocelis subcapitata ... 65
2.2.5 Immobilization and reproduction tests with Daphnia magna ... 66
2.2.6 Growth test with Lemna minor ... 67
2.2.7 Microtox® Test with Vibrio fischeri ... 68
2.2.8 Immobilization tests with Artemia salina (Artoxkit M®) ... 68
2.2.9 Immobilization test with Brachionus plicatilis (Rotoxkit M®) ... 68
2.2.10 Statistical Analysis ... 68
2.3 Results ... 69
2.3.1 Characterization of aqueous suspensions of NMs ... 69
2.3.2 Bioassays ... 71 2.4 Discussion ... 75 2.5 Conclusions ... 81 Acknowledgments ... 82 2.6 References ... 82
Chapter III
Photocatalytic treatment of olive oil mill wastewater using TiO2 and
Fe2O3 nanomaterials ... 91
Abstract ... 91
3.1 Introduction ... 91
3.2 Materials and Methods ... 94
3.2.1 Olive oil mill wastewater and reagents ... 94
3.2.2 Photocatalytic experiments ... 95
3.2.3 Analytical determinations ... 96
3.2.4 Microtox assays ... 96
3.2.5 Statistical analysis ... 96
3.3 Results and Discussion ... 96
3.3.1 Photocatalytic oxidation processes ... 96
3.3.1.1 Effect of photocatalysts and their concentrations ... 97
3.3.1.2 Effect of hydrogen peroxide concentration in the H2O2/UV system ... 99
3.3.1.3 Effect of the addition of hydrogen peroxide on the photocatalytic system ... 101
3.3.2 Toxicity to Vibrio fischeri ... 104
3.4 Conclusion ... 106
Acknowledgments ... 107
3.5 References ... 107
Chapter IV
Biological treatment with fungi of olive oil mill wastewater pre-‐treated
by photocatalytic oxidation with nanomaterials. ... 117
Abstract ... 117
4.1 Introduction ... 118
4.2 Materials and Methods ... 120
4.2.1 Olive oil mill wastewater source ... 120
4.2.2. Nano-‐catalysts and oxidant reagent ... 120
4.2.3 Photocatalytic degradation ... 121
4.2.4 Biological treatment ... 122
4.2.5 Post-‐treatment evaluations ... 123
4.2.6 Statistical analysis ... 123
4.3 Results and Discussion ... 124
4.3.1 Photochemical treatments ... 124
4.3.2 Biological treatment of the pre-‐treated OMW ... 127
4.4 Conclusions ... 139
Acknowledgments ... 139
4.5 References ... 139
Chapter V
Treatment of mining and kraft pulp mill effluents with nano-‐TiO2 and
nano-‐Fe2O3 photocatalysis ... 145
Abstract ... 147
5.1 Introduction ... 147
5.2 Materials and Methods ... 150
5.2.1 Organic and inorganic effluent ... 150
5.2.2 Nano-‐catalysts and hydrogen peroxide ... 151
5.2.3 Photocatalytic experiments ... 151
Organic effluent ... 151
Inorganic effluent ... 152
5.2.4 Post-‐treatment evaluations ... 152
5.2.5 Statistical analysis ... 153
5.3. Results and Discussion ... 153
5.3.1 Pulp mill effluent ... 153
5.3.1.1 Effects of initial pH ... 153
5.3.1.2 Effects of catalyst (nano-‐TiO2 and nano-‐Fe2O3) dose ... 155
5.3.1.3 Effect of addition of H2O2 ... 157
5.3.1.4 Toxicity to V. fischeri ... 160
5.3.2 Mining effluent ... 161
5.3.2.1 Effects of catalyst dose ... 161
5.3.2.2 Effect of addition of H2O2 ... 163
5.3.2.3 Toxicity to V. fischeri ... 164
5.4 Conclusion ... 166
5.5 References ... 166
Chapter VI
Toxicity of solid residues resulting from wastewater treatment with
nanomaterials ... 173
Abstract ... 173
6.1 Introduction ... 174
6.2 Materials and Methods ... 176
6.2.1 Chironomus riparius sediment bioassay ... 176
6.2.2 Characterization of the organic and inorganic content of SRs ... 177
6.2.3 Statistical analyses ... 177 6.3 Results ... 178 6.4 Discussion ... 181 6.5 Conclusion ... 185 6.6 References ... 185
Chapter VII
Conclusions and final remarks ... 189
LIST OF FIGURES
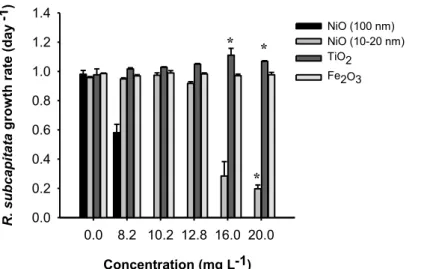
Figure II.1-‐ Growth rate (day−1) of R. subcapitata exposed to the four NMs. Error bars: standard error; asterisks: statistically significant differences from the control.
Figure II.2-‐ Growth rate (day-‐1) of L. minor exposed to the four NMs. Error bars: standard error; asterisks: statistically significant differences from the control.
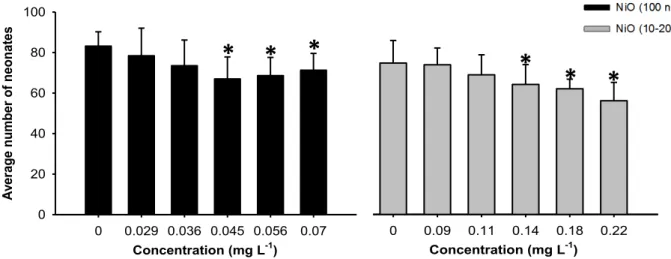
Figure II.3-‐ Number of offspring produced during 21 days by D. magna at different concentrations of NiO (100 nm) and NiO (10-‐20 nm). Error bars: standard error; asterisks: statistically significant differences from the control.
Figure II.4-‐ Number of juveniles produced during 21 days by D. magna at different concentrations of TiO2 and Fe2O3. Error bars: standard error; asterisks: statistically significant differences from the control.
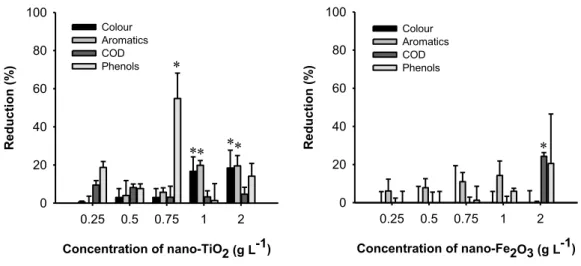
Figure III.1-‐ Effect of nano-‐TiO2 (a) and nano-‐Fe2O3 (b) loadings on color, aromatic compounds, COD and total phenolic content reduction after treatment of OMW at inherent pH and 2 hours of exposure to UV light. Asterisk stand for statistical significant differences from the control, for corresponding treatments (Dunnett tests; p<0.05).
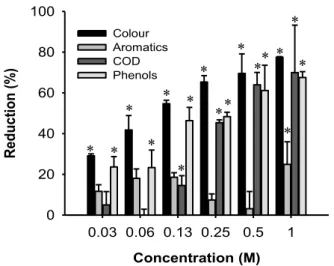
Figure III.2-‐ Effect of H2O2 loadings using H2O2/UV process on color, aromatic compounds, COD and total phenolic content reduction after treatment of OMW at inherent pH and 2 hours of exposure to UV light. Asterisk stand for statistical significant differences from the control, for corresponding treatments (Dunnett tests; p<0.05).
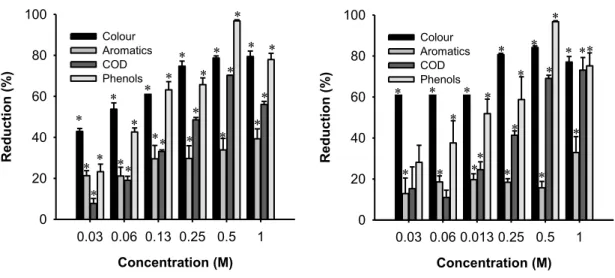
Figure III.3-‐ Effect of H2O2 loading in the process nano-‐TiO2/H2O2/UV (a) and nano-‐ Fe2O3/H2O2/UV (b) on color, aromatic compounds, COD and total phenolic content reduction at inherent pH, 1.0 g L-‐1 catalyst loading and 2 hours of exposure to UV light.
Asterisk stand for statistical significant differences from the control, for corresponding treatments (Dunnett tests; p<0.05).
Figure IV.1-‐ OMW absorbance ratio [Abs(t)/Abs(t0)] at 465 nm (a) and 270 nm (b) after 5 days of chemical oxidation with nano-‐TiO2/UV (TiO2), nano-‐Fe2O3/UV (Fe2O3), nano-‐ TiO2/H2O2/UV (TiO2+H2O2) and nano-‐Fe2O3/H2O2/UV (Fe2O3+H2O2).
Figure IV.2-‐ Absorbance ratio [(Abs(t)/Abs(t0)] at 465 and 270 nm, and pH variation throughout time of OMW pre-‐treated incubated with P. chrysosporium or P. sajor caju at 25˚C and 120±10 rpm.
Figure V.1-‐ Effect of pH (pH 3, 7 and 11) on colour, aromatic compounds and COD reduction after treatment of pulp mill effluent with nano-‐TiO2/UV (a) and nano-‐ Fe2O3 (b) at 1.0 g L-‐1 of catalyst (nano-‐TiO2 or nano-‐Fe2O3) and 2 hours of exposure to UV light. Asterisk stand for statistical significant differences from the control, for corresponding treatments (Dunnett tests; p<0.05).
Figure V.2-‐ Effect of nano-‐TiO2 (a) and nano-‐Fe2O3 (b) dose on colour, aromatic compounds and COD reduction after treatment of pulp mill effluent at pH 3 and 2 hours of exposure to UV light. Asterisk stand for statistical significant differences from the control, for corresponding treatments (Dunnett tests; p<0.05).
Figure V.3-‐ Effect of H2O2 loading in the process nano-‐TiO2/H2O2/UV (a) and nano-‐ Fe2O3/H2O2/UV (b) on colour, aromatic compounds and COD reduction at pH 3, 0.75 g L-‐1 catalyst loading and 2 hours of exposure to UV light. Asterisk stand for statistical significant differences from the control, for corresponding treatments (Dunnett tests; p<0.05).
Figure V.4-‐ Effect of nano-‐TiO2 (a) and nano-‐Fe2O3 (b) dose on the concentration of zinc, aluminum and cadmium after treatment of a mining effluent after 2 hours of
Figure V.5-‐ Effect of the addition of H2O2 to nano-‐TiO2 (Ti+H) or nano-‐Fe2O3 (Fe+H) system on the concentration of zinc, aluminum and cadmium after treatment of a mine effluent after 2 hours of exposure to UV light. Error bars are the standard deviations. Asterisks indicate significant differences from the control (p<0.05).
Figure VI.1-‐ Percentages of survival of C. riparius larvae, following a 10-‐day exposure period, to control and sediments mixed with the SRs from the different effluent treatments. Asterisks indicate significant differences from the control (p<0.05).
Figure VI.2-‐ Average growth rate of C. riparius in control and in sediment samples mixed with SRs from different effluent treatments, calculated based on body length and head capsule width of the larvae. Error bars represent the standard deviation. Asterisks indicate significant differences from the control (p<0.05).
List of Tables
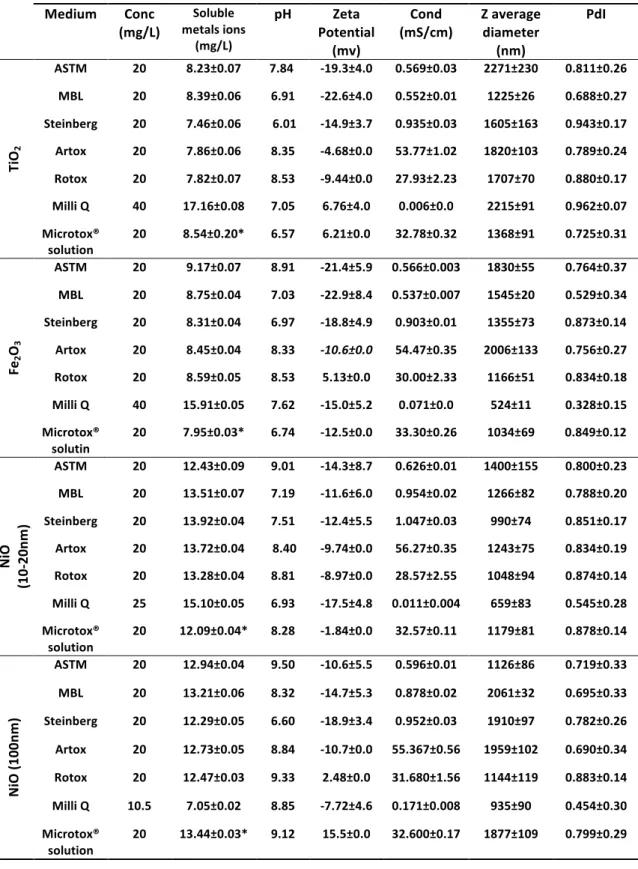
Table II.1-‐ Data from DLS, ELS and ICP-‐MS for the tested NMs when suspended in all test media.
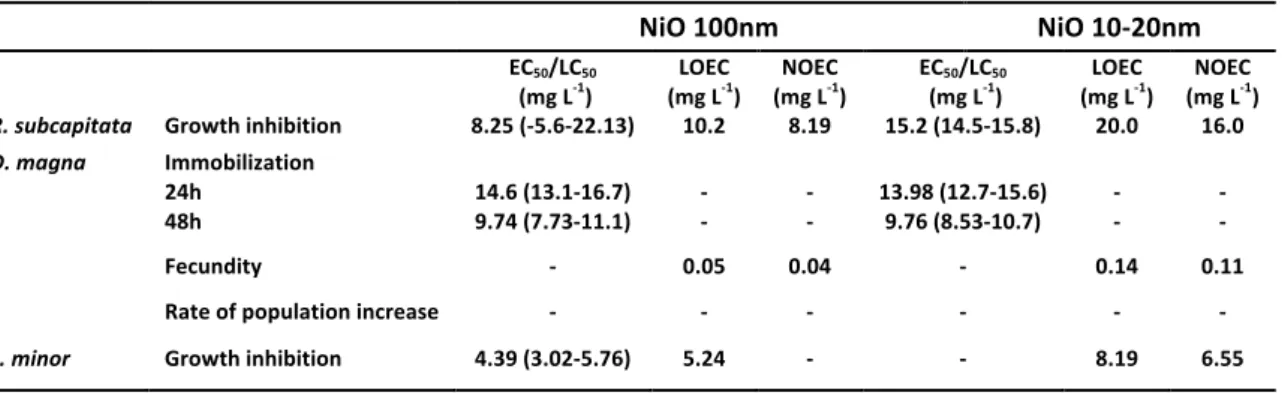
Table II.2-‐ Ecotoxicity data for nano-‐NiO (100 nm) and nano-‐NiO (10-‐20 nm) with corresponding 95% confidence intervals.
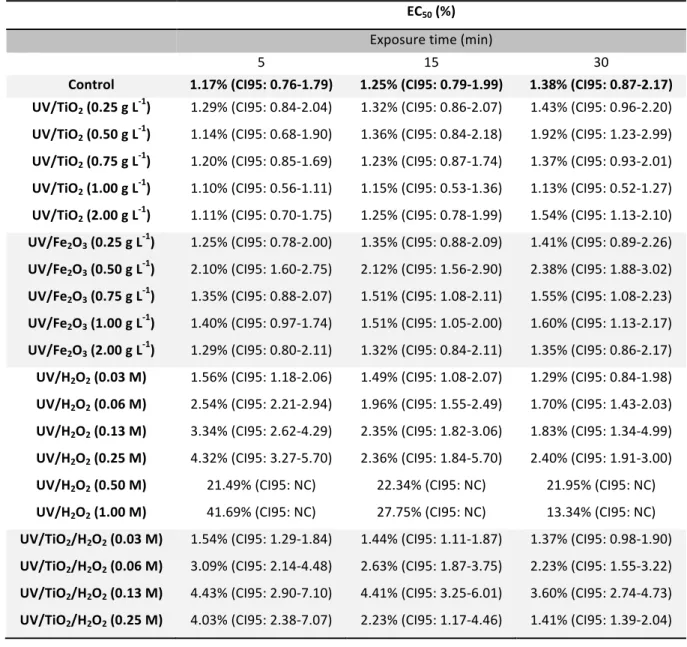
Table III.1-‐ Values of EC50 for bioluminescence inhibition expressed in effluent percentage, and corresponding 95% confidence intervals (CI95), for OOMW samples after the treatments at 5, 15, and 30 min exposure of Vibrio fischeri (NC not calculated).
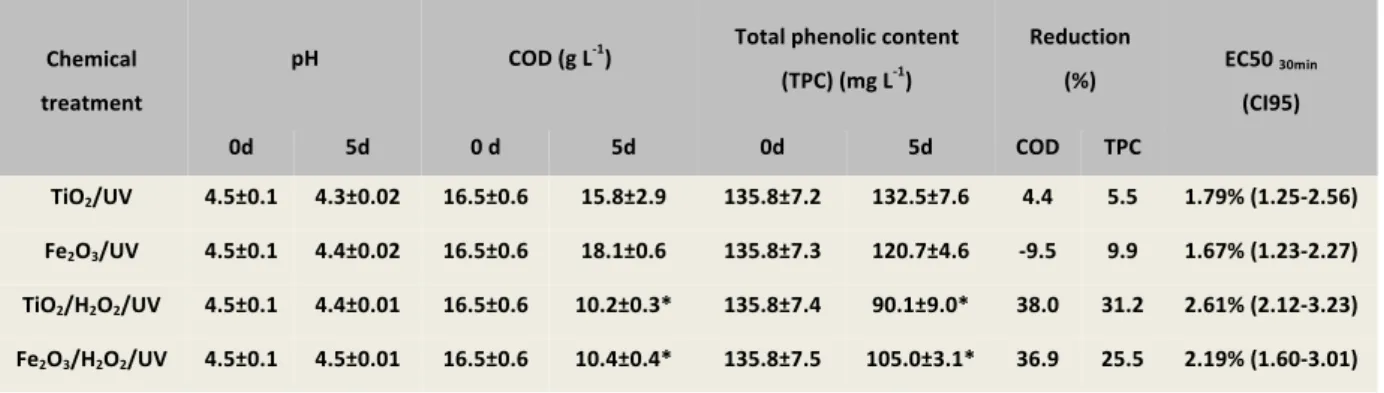
Table IV.1-‐ Average ± STDEV values of pH, COD, total phenolic content (mg L-‐1), % of reduction in COD and TPC and toxicity of OOMW samples treated by the four chemical treatments previously described. Toxicity data is expressed in % of dilution of the OOMW sample tested. Asterisk stand for statistical significant differences from the control, for corresponding treatments (Dunnett tests; p<0.05).
Table IV.2-‐ Average ± STDEV values of biomass, pH, COD, total phenolic content, % of reduction in COD and TPC and toxicity of OOMW samples pre-‐treated by chemical oxidation with nanoparticles, followed by biological treatment with P. chrysosporium or P. sajor caju. Toxicity data is expressed in % of dilution of the OOMW sample tested.
Table IV.3-‐ Results of two-‐way ANOVA testing the effects of biological treatment period (0 and 21 days) with P. chrysosporium, chemical pre-‐treatment (nano-‐TiO2/UV, nano-‐Fe2O3/UV, nano-‐TiO2/H2O2/UV and nano-‐Fe2O3/H2O2/UV) and their interaction on absorbance at 465 nm and 270 nm, pH, COD, total phenolic content and toxicity. One-‐way ANOVA followed by Tukey multiple comparison test (p< 0.05) was used to evaluate statistical differences between 0 and 21 day for each pre-‐treatment applied.
Table IV.4-‐ Results of two-‐way ANOVA testing the effects of biological treatment period (0 and 21 days) with P. sajor caju, chemical pre-‐treatment (nano-‐TiO2/UV, nano-‐ Fe2O3/UV, nano-‐TiO2/H2O2/UV and nano-‐Fe2O3/H2O2/UV) and their interaction on absorbance at 465 nm and 270 nm, pH, COD, total phenolic content and toxicity. One-‐ way ANOVA followed by Tukey multiple comparison test (p < 0.05) was used to evaluate statistical differences between 0 and 21 day for each pre-‐treatment applied.
Table IV.5-‐ Results of two-‐way ANOVA testing the effects of fungi (P. chrysosporium and P. sajor caju), chemical pre-‐treatment (nano-‐TiO2/UV, nano-‐Fe2O3/UV, nano-‐ TiO2/H2O2/UV and nano-‐Fe2O3/H2O2/UV) and their interaction on absorbance at 465 nm and 270 nm, pH, COD, total phenolic content and toxicity. One-‐way ANOVA followed by Tukey multiple comparison test (p < 0.05) was used to evaluate statistical differences between fungi to each pre-‐treatment applied.
Table V.1-‐ Average values (± standard deviation) of pH, COD and absorbance, at 270 and 465 nm, for the raw effluent of the bleached kraft pulp mill.
Table V.2-‐ Metals and metalloids concentration (average ± standard deviation) and pH in the original effluent from São Domingos mine.
Table V.3-‐ Values of EC50 recorded for bioluminescence inhibition expressed in effluent percentage, and corresponding 95% confidence intervals (CI95), or the highest effect expressed in bioluminescence inhibition percentage for OOMW samples after the treatments at 5, 15, and 30 min exposure of V. fischeri (HE – highest effect).
Table V.4-‐ Values of EC50 for bioluminescence inhibition expressed in effluent percentage, and corresponding 95% confidence intervals (CI95), or the highest effect expressed in bioluminescence inhibition percentage for mining effluent samples after the treatments at 5, 15, and 30 min exposure of V. fischeri (HE – highest effect).
Table VI.2-‐ Organic and inorganic content (mg per mg of SR) of the residues formed after the treatment of OOMW, kraft paper mil effluent and mining effluent with nano-‐ TiO2 and nano-‐Fe2O3.
Chapter I
General Introduction
1.1 Wastewater discharges and treatment: European and national regulations
Surface and ground water resources are continuously facing profound changes and quality deterioration, caused by anthropogenic activities, such as mining operations, manufacturing and agro-‐industries, highly dependent from water, both for supplying processes with high quality water, but also as receiving medium of resulting wastewaters, one of the negative externalities of industries. With the industrial development required to guarantee the economic growth of countries, the generation and accumulation of waste products has tremendously increased and one of the major challenges is the proper management and safe disposal of the vast amount and array of such solid and liquid wastes. Industrial wastewaters are one of the major sources of direct and often continue input of pollutants into aquatic ecosystems (Kanu and Achi, 2011; Smolders et al., 2004). Due to the lack of effluent treatment facilities, proper treatment methodologies and disposal systems, huge amounts of industrial wastewater, containing high loads of organic and inorganic chemicals, some of them with high toxicity and recalcitrant potential, are being discharged into aquatic environments. Depending on the type of industry, the wastewater produced can contain different pollutants such as dyes, phenolic compounds, surfactants, pharmaceuticals, pesticides, organic solvents, chlorinated by-‐products, metals and microorganisms, which can cause the increase in biological oxygen demand (BOD), chemical oxygen demand (COD) and total dissolved solids (TDS) in the water systems promoting their deterioration (Kanu and Achi, 2011; Muñoz et al., 2009; Weber et al., 2006). This environmental contamination is now a global concern and managing these wastewaters is becoming increasingly crucial for ensuring a clean environment, in light of significant water scarcity being faced by many countries. The United Nations (U.N.) Millennium Ecosystem Assessment (MA) highlighted the need for the preservation of aquatic resources for both ecosystem integrity and human well being. Ecosystem services are the benefits that people obtain from ecosystems however, despite their critical importance, the MA reported that over 60 percent of ecosystem services were
already degraded and will continue to be degraded for decades to come (MA, 2005). Wetlands deliver myriad ecosystem services that contribute to human well being, being fish supply and water availability the two most important services affecting human well-‐being. Thus, unfortunately the degradation and loss of these ecosystems is more rapid than that of other ecosystems. Population growth and increasing economic development are the primary indirect causes of degradation and loss of wetland ecosystems, but also direct causes like pollution, water withdrawal, overharvesting and overexploitation, and climate change are meaningful (MA, 2005). Hence, at the European level, strict environmental legislation like the Water Framework Directive (WFD, 2000/60/EC) and corresponding daughter directives (e.g., Directive 2008/1/EC, 91/271/EC and 2008/105/EC) (EC, 2000, 2008a,b) aimed in protecting these resources came into force, with a new ecosystemic vision of the freshwater ecosystem as well as with a more conservative approach regarding wastewater discharges. This new approach was particularly interesting since most of the contaminants found in wastewaters can easily find their way to groundwater and surface waters resources being responsible for affecting their chemical and ecological conditions (Fatta-‐Kassinos et al., 2011; Kanu and Achi, 2011). In 2005 the Portuguese Water Law (Law nº 58/2005, of 29 of December) transposed the EU WFD (AR, 2005).
The article 1 of the decision nº 2455/2001/EC (EC, 2001) of the European Parliament and of the Council of 20 November of 2001 established a first list of 33 priority substances including priority hazardous substances that pose a significant risk to the aquatic environment (EC, 2001). Priority and hazardous substances were defined by the WFD as “substances that represent a meaningful risk to aquatic environment, which should be identified by normal risk assessment procedures” and, “as substances or groups of substances that are toxic, persistent and liable to bioaccumulate, and other substances or groups of substances which give rise to an equivalent level of concern”, respectively. Within these substances were metals like cadmium, lead and mercury, phenolic compounds (nonylphenols, octylphenols and pentachlorophenols) as well dioxins. This decision amended the WFD and the list was
discharges and losses of priority substances and of phasing out emissions, discharges and losses of priority hazardous substances (article 1).
The WFD daughter Directive 2008/105/EC, of 16 of December 2008, on environmental quality standards in the field of water policy laid down the environmental quality standards for the priority substances (EQS) and other pollutants included in the annex (EC, 2008a). This Directive was transposed to the national legislation by the Law by Decree nº 103/2010 of 24 of September which included in its Annex I the list of priority substances and in annex II, the list of other pollutants, while annex III set the EQS for surface waters (MAOT, 2010). Thus, in order to regulate the discharge of these substances and achieve good surface water chemical status, water bodies must meet environmental quality standards (EQS) set by the Directive 2008/105/EC (EC, 2008a).
The WFD also expected that member states establish an inventory of emissions, discharges and losses of the all priority substances and other pollutants listed in Part A of Annex I of the Directive 2008/105/EC for each river basin district, but also, for some of these compounds, for the sediment and biota (EC, 2008a). The great majority of chemical substances are not included in the previous list for which EQS were defined and, that must be monitored, according to the above mentioned legislation, but they can be detected, at least indirectly, if they harm the ecological communities of receptors systems. In this context the WFD is complemented with two directives addressing wastewater discharges into surface water, the Urban Wastewater Treatment Directive (UWTD, Directive 91/271/EEC) and the Industrial Emissions Directive (IED -‐ Directive 2010/75/EU) (EC, 1991; EC, 2010). The IED groups seven directives, including the Integrated Pollution Prevention and Control Directive (IPPC, Directive 2008/1/EC), into one piece of legislation. The IPPC directive applies to large industries with a high pollution potential such as the energy sector, the production and processing of metals, the mineral and chemical industries, pulp and paper production, waste management facilities, food production and non-‐industrial activities such as livestock farming, as defined in Annex I of the Directive. This directive introduced an integrated and combined approach intended to control the emissions to air, water and
soil, applying the best available techniques (BAT) in order to ensure a high level of protection of the environment taken as a whole. Also it established emission limit values (ELVs) for a list of polluting substances (e.g. metals and their compounds, persistent hydrocarbons, substances which have an unfavourable influence on the oxygen balance, as well the substances listed in Annex X to Directive 2000/60/EC) defined in Annex III of the Directive based on BAT, controlling simultaneously point-‐ source pollution and ensuring the compliance with the applicable environmental quality standards (EC, 2008b). IPPC enforces the treatment of wastewaters prior to discharge by applying preventive and minimization techniques. The Law by Decree nº 127/2013, of 30 of August, transposed into national law the Industrial Emissions Directive applicable to the prevention and control of pollution, as well as rules to prevent and/or reduce emissions to air, water and soil, and waste generation in order to achieve a high level of environmental protection as a whole (MAOTE, 2013). The Portuguese legislation also established in the Annex XVIII of the Law by Decree 236/98 of 1 August, emission limit values (ELVs) for the discharge of industrial wastewaters (ME, 1998). To attain a good chemical and ecological status of water masses, as required by the WFD and the Portuguese legislation, is necessary to properly treat industrial wastewaters before their discharge to aquatic ecosystem to reduce their environmental impact. Recognizing the clear evidence that our water resources are increasingly scarce in various regions and countries, and that the quality of the available freshwater is also deteriorating due to pollution, the research for new wastewater treatment methodologies are increasing worldwide.
1.2 Some of the most concerning wastewaters 1.2.1 Olive oil mill wastewaters (OOMW)
Olive oil production is one of the most important agricultural industries in the Mediterranean basin countries. According to the International Olive Oil Council from November 2013, 2.4 millions of tones of olive oil are produced annually worldwide being the major producers in the EU (72.1%), namely in Spain (67.4.0%), Italy (16.7%),
area, Tunisia (5.5%), Syria (6.0%), Turkey (5.8%) and Morocco (3.6%), are relevant olive oil producers. However, outside Mediterranean basin, other countries are also becoming emergent producers like Argentina, Australia and South Africa (Paraskeva and Diamadopoulos, 2006; Roig et al., 2006). Regardless of the economic advantages, the olive oil has also been associated with health benefits, such as lower incidence of cardiovascular disease and certain types of cancer (prostate and colon). The occurrence of such health problems in Greece, Italy and Spain are considerably lower and this has been related with the Mediterranean diet, which includes olive oil as a relevant food item (Cicerale et al., 2010; Tuck and Hayball, 2002; Visioli and Galli, 1998).
However, the extraction of olive oil poses two serious environmental problems for the producing countries; on the one hand large amounts of water are used in the extraction process and in the other huge quantities of high extremely toxic wastewaters and sludge are generated (Arvaniti et al., 2012; Dermeche et al., 2013). More than 30 million m3 of wastewater are generated every year in the world (Kavvadias et al., 2010; McNamara et al., 2008).
Nowadays, the traditional process (pressing) and centrifugation technologies such as three-‐ and two-‐phase centrifugation systems are the two ways of extracting the oil. Although the pressing process is a relatively obsolete technology and its use has decreased, it is still being used for some small olive oil mills especially due to the cheap equipment and technical simplicity of the processes carried out. However, it produces a more concentrated OOMW compared to the centrifugation systems, because uses a small quantity of water (Bhatnagar et al., 2014; Dermeche et al., 2013). The three-‐phase method produces olive oil, a solid residue (olive pomace), and a great amount of OOMW, because of the water that is added at different steps during oil production to improve the separation of oil (Peikert et al., 2014). This led to the introduction in the early nineties of a two-‐phase “ecological friendly” extraction system. This process produces two products: olive oil and a by-‐product waste, which is the combination of olive husk and OOMW (called wet pomace or two-‐phase olive mill waste (TPOMW)) (Dermeche et al., 2013; Roig et al., 2006; Tsagaraki et al., 2007). The
main advantage of this system is the significant reduction in the volume of OOMW produced, nevertheless large amounts of semi-‐solid waste (TPOMW) are still produced (Alburquerque et al., 2004; Dermeche et al., 2013; Justino et al., 2012; Morillo et al., 2009).
In summary, the management of wastes from olive oil extraction has to deal with three main problems: the seasonality of waste generation, the enormous volume of wastewater generated each year, and the other types of waste. The complex physical and chemical composition of olive oil mill wastewater (OOMW) is variable and depends on many factors such as olive variety and maturity, climatic conditions, the local and seasonal nature of oil production, cultivation methods and the extraction process (McNamara et al., 2008; Ouzounidou et al., 2010; Roig et al., 2006). Nevertheless, the main composition of olive oil mill wastewater is about 83-‐96% of water, 1-‐8% of sugars, 0.5-‐2.4% of nitrogenous compounds, 0.5-‐1.5% of organic acids, 1.0-‐1.5% of phenols, pectin and tannins, 0.02-‐1.0% of lipids and inorganic substances, with offensive smell and dark colour (Asses et al., 2009; Ouzounidou et al., 2010; Sayadi et al., 2000). The main environmental impacts of OOMW derive from its acidic condition (pH 3.0-‐5.9), high organic load (biological and chemical oxygen demands can reach up to 100 and 220 g L−1, respectively) and phenolic content (up to 80 g L−1) (Azbar et al., 2004), which contribute for the high toxicity of this wastewater. It is generally acknowledged that the high toxicity of OOMW is due to polyphenolic components since these compounds are highly recalcitrant and toxic to microorganisms and plants (Asfi et al., 2012; Saadi et al., 2007).
Despite the recognition that OOMW is a truly hazard residue, in many countries it is still being spread onto soil or into water courses, without any valorisation treatment, causing negative impacts on the environment (Peikert et al., 2014). For example, S’habou et al. (2009) shows that the uncontrolled and repeated disposal of OOMW can affect soil quality, increasing the organic matter, the electrical conductivity and phenolic compounds concentration, as well contaminate groundwater with phenolic compounds. However, and despite the known hazard of this wastewater, the
the uncontrolled disposal and in promoting some valorisation to this waste, gave a special permission trough the regulatory order Nº 626/2000, for spreading OOMW on land (MADRP, 2000). Thus a limit of discharge in soils of < 80 m3/ha/year for irrigation purposes was established. And this use can be made close to water bodies. Nevertheless, the most common method of elimination in practice has been the storage in lagoons where OOMW is left to evaporate naturally, until the production of the next year. Despite being the most economical method such disposal only reduces the volume of wastewater concentrating the most hazardous pollutants, causing several environmental problems such as bad odour or the possible contamination of soil and water body pollution (de la Casa et al., 2009; Kavvadias et al., 2010; S’habou et al., 2009). Thereby, several other treatments options have been proposed and tested, such as physicochemical (membrane filtration, coagulation-‐flocculation, electrocoagulation, advanced oxidation, ultra-‐filtration/reverse osmosis, adsorption and sedimentation) and biological (aerobic or anaerobic processes) as well several combined technologies (for instance a sequential treatment with fungi and photo-‐ Fenton), aiming to make OOMW acceptable for discharge into the environment (Achak et al., 2014; Arvaniti et al., 2012; Duarte et al., 2014; Hanafi et al., 2010; Hodaifa et al., 2013; Jarboui et al., 2013; Kilic and Solmaz, 2013; Michael et al., 2014; Pelendridou et al., 2013; Sampaio et al., 2011). Although some treatment options have obtained significant results in ameliorating parameters as colour, COD and phenolic content the toxicity persisted or in some cases found a slightly increased (Justino et al., 2012). None of these single technologies or the combination between them was effective enough to gather a consensus to be universally adopted for OOMW treatment.
1.2.2. Paper mill wastewaters
The pulp and paper industry has always had to deal with two major environmental problems; the first is consumption of high quantities of freshwater and the second is the large volume of pollutant wastewater produced (Lucas et al., 2012). Although several efforts were taken in the last few years to recycle and reduce the consumption of water with the best available techniques (Gönder et al., 2011), it still
uses a considerable amount of freshwater resources, which can attain 60 m3 per tonne of paper produced (Pokhrel and Viraraghavan, 2004; Thompson et al., 2001). Pulp and paper industry is one of the largest contributors to air and water pollution (Garg and Tripathi, 2011). The most significant sources of pollution in pulp and paper industry are wood preparation, pulping, pulp washing, bleaching and coating operations. Among the various processing steps, pulping is one of the major sources of pollutants in all the process because large amount of water are necessary reappearing in the form of an effluent. In this step, wood chips are digested so the fibers can be separated and treated to remove lignin. Two major processes are been used worldwide, mechanical and chemical processes, but they can also be combined depending of the desire quality of the finish product. Both in European Union and North America the most prevalent process is the chemical pulping (Badar and Farooqi, 2012; Pokhrel and Viraraghavan, 2004). In the chemical pulping high amounts of chemicals are used as alkaline (Kraft process) or acidic (sulphite process) mediums to cook and digest the wood chips in the presence of elevated pressures and temperatures. Using chemical pulp to produce paper is more expensive and the yield is lower than using mechanical pulp, but it has better strength and brightness properties. The wastewaters generated from the pulping process include solid wastes, like wood debris and several wooden compounds such as lignin, carbohydrate and wood extractives. Also, depending on the type of pulping process, resins acids, unsaturated fatty acids, diterpene alcohols, chlorinated resin acids can appear (Pokhrel and Viraraghavan, 2004). Some of the wood extractives, although in smaller quantities, can be more toxic that phenols and can decrease the quality of the aquatic environment, the final receptor of these wastes (Garg and Tripathi, 2011). The chemical pulp bleaching is the last step and the responsible for most of the toxicity of the wastewater, as in this process the objective is to remove the remained lignin and brighten the pulp. Several chemicals are used to transform lignin as oxygen, hydrogen peroxide, sodium hypochlorite, chlorine dioxide and chlorine. The effluent generated from the bleaching contains dissolved lignin, chlorinated organic compounds (AOX) as well inorganic chloride compounds (e.g.,
AOX are xenobiotics and with recalcitrant nature and tend to persist in the environment (Garg and Tripathi, 2011). Moreover, the chemical composition of pulp and paper mill effluents vary in a wide range, depending on the type of wood used and the pulping and bleaching procedures, but is characterized by high chemical oxygen demand, low biodegradability and dark-‐brown colour (Buyukkamaci and Koken, 2010; Wang et al., 2011). The dark-‐brown colour resulted from the lignin compounds present in the effluent, and are both visually unacceptable and responsible by reducing light transmission and thereby the phytoplankton activity (Garg and Tripathi, 2011; Sahoo and Gupta, 2005). The most common treatments applied to the effluents from the pulp and paper industry are the biological systems, like sequential anaerobic and aerobic treatments, after a primary clarification. However, the biological treatment is not able to completely remove all the toxic compounds, such as inorganic compounds, and a tertiary treatment (e.g. sedimentation/floatation, coagulation and precipitation, adsorption, oxidation and membrane filtration) is often needed (Gönder et al., 2011; Kamali and Khodaparast, 2014).
1.2.3 Mining effluents
One of the major anthropogenic sources of metal contamination in soils and waters are the mineral and mining activities (Johnson and Hallberg, 2005). Over the years mines were extensively exploited been an important economic activity in many countries however, even after the cessation of the exploratory activity, the impacts persists (Antunes et al., 2007; Lopes et al., 2000; Pereira et al., 2004). There are several methods of metal and industrial minerals mining (e.g., underground mining, open-‐pit mining, strip mining and dredge mining) being very difficult to predict the composition of the wastewater produced (Cooke and Johnson, 2002; Iakovleva and Sillanpää, 2013). Although the extraction method and the composition of the base minerals in the rock can vary, they all share a common characteristic, which is the production of acidic effluents, the so called acid mine drainage (AMD) (Cooke and Johnson, 2002; Williams, 2001). AMD results from the oxidation of sulphide minerals (like pyrite) when they are exposed to oxygen, water and microorganisms. When sulphur compounds are
![Figure IV.1-‐ OMW absorbance ratio [Abs(t)/Abs(t0)] at 465 nm (a) and 270 nm (b) after 5 days of chemical oxidation with nano-‐TiO 2 /UV (TiO 2 ), nano-‐Fe 2 O 3 /UV (Fe 2 O 3 ), nano-‐TiO 2 /H](https://thumb-eu.123doks.com/thumbv2/123dok_br/15811623.1080548/126.892.129.764.138.379/figure-omw-absorbance-ratio-abs-abs-chemical-oxidation.webp)