INSTITUTO DE CIÊNCIAS BIOMÉDICAS ABEL SALAZAR
FACULDADE DE CIÊNCIAS
Alexandra Dinis Santos.
Emission of global warming gases from
N
orthern Portugal estuaries: the contribution of CH4 and N2O
Emission of global warming gases from
N
orthern
Portugal estuaries: the contribution of CH4 and N2O
Alexandra Cristina Dinis Santos
M.
ICBAS
2019
SEDE ADMINISTRATIVA MESTRADOTOXICOLOGIA E CONTAMINAÇÃO AMBIENTAIS
Emission of global warming gases
from Northern Portugal estuaries:
the contribution of CH4 and N2O
Alexandra Dinis Santos
M
Alexandra Cristina Dinis Santos
Emission of global warming gases from Northern Portugal estuaries:
the contribution of CH
4and N
2O
Dissertação de Candidatura ao grau de Mestre em
Toxicologia e Contaminação Ambientais submetida
ao Instituto de Ciências Biomédicas Abel Salazar
da Universidade do Porto
Orientador – Professor Doutor Adriano A. Bordalo e Sá
Professor Associado com Agregação
Instituto de Ciências Biomédicas Abel Salazar
da Universidade do Porto.
Co-orientadora – Doutora Catarina Teixeira
Investigadora Centro Interdisciplinar de
Investigação Marinha e Ambiental.
Index
Acknowledgements ... 3
Abstract ... 4
Resumo ... 5
Introduction ... 6
Global warming and greenhouse effect ... 6
Greenhouse gases ... 7
Study area ... 11
Objective ... 12
Materials and experimental procedures ... 13
Sampling ... 13
Experimental procedures... 15
Data analysis ... 17
Results ... 18
Characterization of water and sediment samples ... 18
Dissolved CH4 and N2O in estuarine water ... 22
Production and consumption of CH4 in sediments ... 23
Production and consumption N2O in sediments ... 26
CH4 and N2O fluxes per area ... 27
Correlations between CH4 and N2O and environmental variables ... 28
Discussion ... 31
Conclusions ... 35
Acknowledgements
Primeiramente queria agradecer ao Professor Doutor Adriano Bordalo, pela oportunidade de trabalhar no laboratório e neste projeto. Agradecer à Doutora Catarina Teixeira pelo apoio e pela ajuda no projeto e na elaboração desta dissertação. Agradecer também a todas as pessoas que trabalham no laboratório pela ajuda prestada sempre que era necessário. Finalmente, mas não menos importante agradecer à minha família pelo apoio e pelo incentivo que sempre me dão.
A investigação desenvolvida no âmbito desta dissertação de mestrado foi parcialmente apoiada pelo projecto UNNOWN - UNdiscovered Nitrogen micrOrganisms for
Wastewater iNoculation: finding efficient microbial seed sludges for wastewater nitrogen removal (referência PTDC/BTA-BTA/31098/2017), com cofinanciamento do COMPETE
2020, Portugal 2020 e União Europeia através do FEDER, e pela FCT através de Orçamento de Estado.
Abstract
Global warming is one of the most important problems of the 21st century. Human
activities cause an increase in greenhouse gases emissions to the atmosphere. The increase of greenhouse gases in the environment, such as carbon dioxide, methane, and nitrous oxide, leads to an increase in their concentration in the atmosphere with commensurable impact on the climate due to their ability to absorb infrared radiation. Our research focused on two major gases responsible for global warming, methane (CH4), and nitrous oxide (N2O). Estuaries are one of the natural sources of emissions of
these gases to the atmosphere. As such, the objective of this work was to estimate the potential emissions of CH4 and N2O to the atmosphere from the Douro, Ave, and Cávado
estuaries. Water and sediment samples were collected seasonally in intertidal areas of the three estuaries. Dissolved concentrations of CH4 and N2O in water were quantified
by GC-FID and GC-ECD, respectively, and potential fluxes of CH4 and N2O from
sediments were estimated using slurry incubations. Douro estuary presented the higher value of both dissolved methane (1.149 nmol L-1) and nitrous oxide (0.104 nmol L-1). In
addition, Douro estuary sediments presented the higher values of methane production (26.48 nmol h-1 g-1 wet sed). Ave estuary sediments presented the higher value of nitrous
oxide production (0.10 nmol h-1 g-1 wet sed). In spite of being located within the same
geographic area, the estuaries presented substantially different results in what methane and nitrous oxide emissions are concerned. Further studies are necessary to better understand the magnitude of the problem and to design measures to remediate the impacts on the estuaries.
Resumo
O aquecimento global é um dos maiores problemas do século XXI. As atividades humanas causam um aumento nas emissões de gases de efeito estufa para a atmosfera. O aumento da produção de gases, como o dióxido de carbono, o metano e o óxido nitroso, leva a um aumento da sua concentração na atmosfera, com impactos comensuráveis para o clima. Estes gases de efeito de estufa são importantes devido à sua capacidade de absorverem radiação infravermelha. Este estudo concentrou-se em dois importantes gases responsáveis pelo aquecimento global, o metano (CH4) e o óxido
nitroso (N2O). Os estuários são conhecidos como ambientes onde ocorrem emissões
naturais destes gases para a atmosfera. Assim, o objetivo deste trabalho foi estimar as emissões de CH4 e N2O dos estuários do Douro, Ave e Cávado. Amostras de água e
sedimento foram colhidas sazonalmente, em zonas intertidais dos três estuários. As concentrações de CH4 e N2O dissolvidos foram quantificadas por GC-FID e GC-ECD,
respetivamente. Os fluxos de CH4 e N2O a partir dos sedimentos foram estimados
usando slurries. O estuário do Douro apresentou os valores mais elevados quer de CH4
(1.149 nmol L-1) quer de N
2O (0.104 nmol L-1) dissolvidos. Adicionalmente, o estuário do
Douro também apresentou valores elevados para a produção de CH4 em sedimentos
(26.48 nmol h-1 g-1 sed hum). Por sua vez, o estuário de Ave apresentou o maior valor
de produção de N2O (0.10 nmol h-1 g-1 sed hum). Embora os estuários em estudo
estejam localizados na mesma área geográfica, apresentam resultados
substancialmente diferentes nas emissões de CH4 e N2O. Mais estudos são necessários
para entender melhor a magnitude do problema e criar medidas para remediar potenciais impactos negativos.
Introduction
Global warming and greenhouse effect
Global warming is one of the most important issues of the 21st century (Houghton, 2009).
The term global warming is used to describe the increase in the average temperature of the Earth oceans and atmosphere (Bodri et al., 2007). Throughout history, Earth climate has changed. In the last 650 000 years, there have been seven cycles of glacial advance and retreat, fostered by natural causes, with the last ice age ending abruptly about 7 000 years ago, marking the beginning of the modern climate era (IPCC, 2014b). In these days, global warming refers to the rapid rising of the global temperature occurring during the last 100 to 150 years, believed to be related to anthropogenic activities (Bodri et al., 2007). Activities like the burn of fossil fuel, deforestation, and intense agriculture are increasing the concentration of greenhouse gases in the atmosphere, causing an increase in the greenhouse effect (Houghton, 2009).
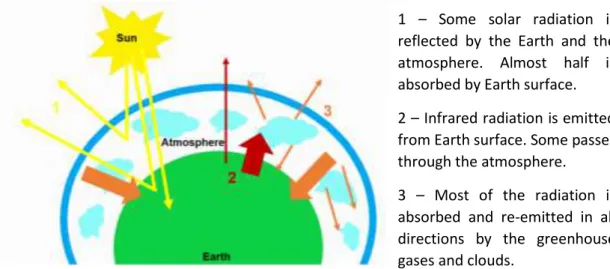
The greenhouse effect is fundamental to the life on Earth regulating the temperature to around 18 ºC, and without it the temperature would be -15 ºC (Tremblay et al., 2005). In normal conditions, the solar radiation is absorbed by the Earth, warming it, and reflected by the atmosphere and the Earth. With the increase of the greenhouse gases in the atmosphere, the infrared radiation reflected and emitted by Earth is absorbed and re-emitted in all directions, causing the warm of Earth surface and lower atmosphere (Figure 1) (North, 2015).
Since the late 19th century, the average temperature has risen about 0.9 ºC, mainly due
to the large increase of emissions of greenhouse gases to the atmosphere. Records show that the warmest years occurred in the last 35 years, with the warmers being registered since 2010. The warmer year, on the record, was 2016, with eight of twelve months (January to September, with the exception of June) being the warmest on record for those months, respectively (IPCC, 2018).
The warming of the Earth surface causes the melting of permafrost. Permafrost degradation can cause impacts locally and globally, one of the more important being the release of greenhouse gases to the atmosphere (Streletskiy et al., 2015). Additionally, the increase of the temperature can cause serious problems like melting of polar ice caps leading to sea levels rising and more coastal erosion, increase in the magnitude and extension of natural disasters, desertification, massive migration, and increase in epidemics (Houghton, 2009).
Greenhouse gases
Greenhouse gases affect the Earth climate by trapping the radiation in the atmosphere, inhibiting the cooling of the Earth (North, 2015). Thus, the increase of greenhouse gases in the atmosphere, such as water vapour, CO2, methane (CH4), and nitrous oxide (N2O)
is important due to their ability to retain the heat. The emissions of these gases can occur naturally in rivers, lakes, estuaries, soils, and forests, but anthropogenic activities are increasing emissions in rates never seen before (Lashof et al., 1990).
Acting as a feedback mechanism to the climate, the water vapour is one of the most important gases in the atmosphere. Its concentration in the atmosphere increases as the Earth is getting warmer but reduces because of clouds formation and precipitation (IPCC, 2014b). It is one of the most important greenhouse gases being capable of absorbing and emitting infrared radiation. As an important component of the hydrological cycle, it is naturally present in the atmosphere. Its evaporation to the atmosphere can occur from
1 – Some solar radiation is reflected by the Earth and the atmosphere. Almost half is absorbed by Earth surface. 2 – Infrared radiation is emitted from Earth surface. Some passes through the atmosphere. 3 – Most of the radiation is absorbed and re-emitted in all directions by the greenhouse gases and clouds.
water and soils, there it condenses and forms clouds, returning to Earth surface by precipitation (Brusseau et al., 2019).
As part of the Earth carbon cycle, CO2 is also naturally present in the atmosphere, but
human activities are adding more CO2, affecting the ability of natural sinks to remove it
(EPA, 2019). CO2 is produced naturally by respiration and volcano eruptions, and
anthropogenically by deforestations, land use alterations, and the burning of fossil fuels (IPCC, 2014b). With a lifetime of about 100 years, the CO2 is the most abundant
greenhouse gas present in the atmosphere, causing about 63% of global warming (Houghton, 2009; IPCC, 2007b).
Methane is a key component of natural gas. Natural sources of CH4 to the atmosphere
include wetlands, natural transfer of CH4 from the soil by plants, methanogenic activity
in soil and sediments, and animal digestive processes such as termites and ruminants (Figure 2). With a land occupation of only 6 %, wetlands represent 63 % of the natural sources of CH4 to the atmosphere; this emission is affected by abiotic and biotic factors.
Nonetheless, human activities continue to be the main contributor to CH4 presence in
the atmosphere, with activities such as the burning of fossil fuel, agriculture, burning or destruction of biomass, wastewater management, and indirectly the melting of permafrost (Houghton, 2009; Hu et al., 2019; IPCC, 2013; Rasmussen et al., 1983). Agriculture is one of the biggest sources of CH4 mainly due to rice production, livestock
production, enteric fermentation, and landfills (IPCC, 2007a). In 1997, it was estimated that agriculture was responsible for two-thirds of the CH4 sources to the atmosphere.
The previsions indicate that if no measures are taken, the CH4 emissions will increase
60 % until to 2030 (Cole et al., 1997; IPCC, 2007a). CH4 is a major by-product of organic
matter degradation (Bastviken, 2009). In sediments, under aerobic conditions, CH4 is
formed by microorganisms that convert organic compounds to CH4. However, under
anaerobic conditions, CH4 can be produced by a process called methanogenesis. This
process occurs in sediment, marine environments and freshwater, and is carried out by anaerobic bacteria as free-living or as symbionts with protists or animals (Cui et al., 2015; Fenchel et al., 2012). CH4 degradation can occur by two processes, photochemical
elimination and microbial oxidation (Yoon et al., 2009). In the first, reactions in the stratosphere with hydroxyl radicals or electronically excited singlet oxygen, degrade CH4.
In the microbial process, the oxidation of CH4 is carried out by methanotrophs, since this
bacterial group uses CH4 as energy and carbon source. Before 1800, the concentration
of CH4 in the atmosphere was twice lower than the levels present in our days (Houghton,
years shorter than CO2, being responsible for 21% of the greenhouse effect (EPA, 2019;
IPCC, 2007b).
Figure 2 – Schematic of CH4 emissions and consumption processes (original).
Nitrous oxide is naturally present in the atmosphere as part of the nitrogen cycle, but human activities have been increasing its amount (EPA, 2019). In the early 2000s, the main source of N2O to the atmosphere where soils and oceans, with emissions
dependent on the activity of microorganisms (Bange, 2000). Presently, the main sources are from human activities like agriculture, wastewater management, and fuel combustion (Houghton, 2009). The two most important biogenic processes of N2O production are
nitrification and denitrification (Bange, 2000). In nitrification, the nitrate is obtained by the CH4 Consumed by Anaerobic oxidation by microbes Methanotrophs Emissions from
Landfills Fossil fuels
Burning biomass Melting permafrost Nutrient-rich seabeds Hydrates and clathrates Digestive processes in termites Digestive processes in domestic animals including ruminants Transfer of CH4in soil to air by plants Plant decay in natural wetlands and rice paddies
Methanogens in soil and sediments
Wastewater management
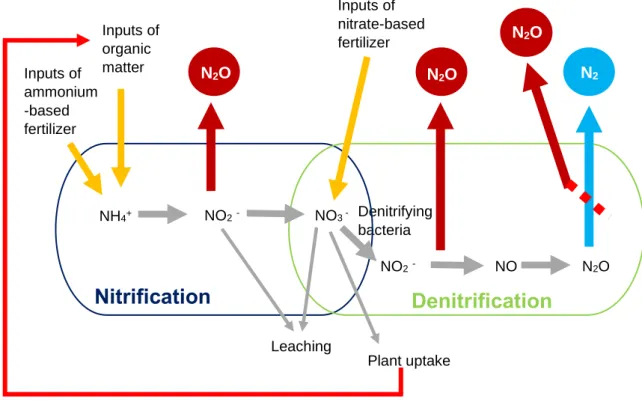
transformation of ammonium. Soil organic matter mineralization and chemical fertilizers are the two main sources of ammonium in the soil. The N2O is formed as a secondary
product of nitrification, in the transformation of ammonium into nitrite (Figure 3) (Prosser, 2005). The microbial process of transforming nitrate and nitrite into dinitrogen (N2) or
N2O is called denitrification. The amount of oxygen (O2) available in the surrounding
environment determines the occurrence of denitrification. Only in the presence of a low amount of O2 will the denitrify bacteria switch from aerobic to anaerobic respiration, using
nitrate as an electron acceptor (Martens, 2005). N2O emissions can occur by incomplete
denitrification due to inhibition of the last step of the process (Skiba, 2008). The removal of N2O from the atmosphere occurs by natural sinks, but mostly by chemical reactions
(EPA, 2019). Chemical removal can only occur in the stratosphere, where N2O is
photochemically destroyed, but can also form NO radicals that attack the ozone layer, which protects the earth against ultraviolet radiation. N2O in the atmosphere has a
lifetime of 120 years and cause a greenhouse effect of 7% (Houghton, 2009).
Methane and nitrous oxide are present in the atmosphere with concentrations that are two to six order of magnitude lower than CO2, but their high capacity of absorbing infrared
N2O
Figure 3 – Schematic of N2O emissions and consume processes (original).
Denitrifying bacteria Inputs of organic matter NH4+ Inputs of ammonium -based fertilizer NO3 -NO2 -NO2- NO N2O N2O Inputs of nitrate-based fertilizer N2O N2
Nitrification
Denitrification
Leaching Plant uptakeradiation produced or reflected by the Earth makes them important contributors to global warming. When comparing the three gases, CH4 and N2O have absorption capacities 34
and 298 times higher than CO2, respectively (IPCC, 2014a). As such, the increase of
their concentration in the atmosphere has been the focus of previous studies (Lashof et al., 1990; Tremblay et al., 2005). High levels and emissions of CH4 were found in
estuaries, streams surrounded by forests, agriculture lands, and peatlands (Sturm et al., 2016). While high levels and emissions of N2O occur in estuaries, systems receiving
freshwater from groundwater or streams, and especially systems where fertilizer had been applied (Sturm et al., 2016).
Study area
Estuaries have been defined as semi-enclosed coastal bodies of water, with a free connection with the sea, where seawater is commensurable diluted with freshwater (Pritchard, 1967). Estuaries are critical transition zones, linking sea, land, and freshwater habitats. They are one of the most important ecosystems on Earth, providing essential ecological functions like decomposition and nutrient cycling (Levin et al., 2001). These coastal areas were identified as important natural sources of emissions of CH4 and N2O
(Bange et al., 1998). Estuaries present a higher physical-chemical variation than other aquatic systems. The variability of salinity and temperature over tidal cycles translates in a unique aquatic system (Elliott et al., 2011).
For the purpose of this study, three estuaries in Northern Portugal were selected: Douro,
Cávado and Ave river estuaries. The Douro river is 927 km long with a watershed of 97, 667 km2 shared between Portugal and Spain, making it one of the longest rivers in
the Iberian Peninsula (Bordalo et al., 2005). Along the river watershed, there were built more than 50 dams for power generation and irrigation (Azevedo et al., 2010). Since his construction in 1985, the last dam located at 21.6 km from the mouth, is the limit of the Douro estuary (Azevedo et al., 2008). The estuary is located at 41.08º N and 8.42º W (mouth), presents a semi-diurnal mesotidal regime, and has been previously divided into 3 stretches due to seawater intrusion (Teixeira et al., 2012; Vieira & Bordalo., 2000). Living within the estuary area, in the last 8 km of the river, are more than 700,000 inhabitants (Carrola et al., 2014). Additionally, there are effluents from the eight existent wastewater treatment plants (WWTPs) without nutrient removal (Azevedo et al., 2006). The Cávado river has a watershed of 1,588 km2, a length of 122 km, and its mouth is
course, nine dams have been built for power generation, agricultural and water supply. The river runs through heavy urbanized and industrialized areas with several WWTPs spread along the watershed (Moreira et al., 2006; Vieira et al., 1998). The Ave river is the smallest in this study, with a length of 90.9 km and a watershed of 1,388 km2, flowing
into the Atlantic Ocean at 41.26º N and 8.45º W (Araújo et al., 2010; Soares et al., 1999). Through the years, the river has been heavily modified with artificially constrained banks (Teixeira et al., 2013). The river runs through heavily populated areas with many industries (Araújo et al., 2010). Within his 1.5 km of extension, the estuary harbours industries and a shipyard that together with local agriculture and domestic pollution results in bad water quality (Barbosa-Vasconcelos et al., 2018).
Objective
The objective of this work was to estimate the potential emissions of CH4 and N2O to the
atmosphere from Douro, Ave, and Cávado estuaries, through water and sediment analyses in the upper, middle, and lower stretches of each water body.
Materials and experimental procedures
Sampling
Sample collection was performed in estuarine intertidal areas of Douro, Ave and Cávado rivers during low tide. The sampling sites of the three estuaries were previously selected and represented the lower, middle and upper stretches (Figure 4, Table 1). In the Douro estuary, the three sites were located at the mouth of tributaries and close to the outlets of WWTPs. D1 was located at the mouth of Granja stream and near Sobreiras WWTP. D2 was located at the mouth of rivers Tinto and Torto, overlooking Freixo Marina, and under the influence of WWTPs of Freixo and Rio Tinto. D3 was located at the mouth of Gramido stream close to the effluent of the WWTP with the same name. In the Ave estuary, two sites were selected near the shipyard and downstream a weir where an effluent of unknown origin is located. In this estuary, only two points were selected due to the small length of the estuary. In the Cávado estuary three sites were selected, the first within a saltmarsh area, the second near a WWTP, and the most upstream, in a less impacted area but with the presence of recreational activities.
Figure 4 - Sampling sites (a - Ave River; b – Cávado River; c – Douro River). Source: Google Maps.
A1
A2
a
C1
C2
C3
b
D3
D2
D1
c
x x xTable 1 – Geographical coordinates of the sampling sites (Datum – WGS 84). Sites Latitude N Longitude W Douro D1 41,14777 -8,65200 D2 41,14377 -8,57952 D3 41,12531 -8,55980 Ave A1 41,34598 -8,74358 A2 41,35158 -8,73794 Cávado C1 41,52275 -8,78591 C2 41,51099 -8,75720 C3 41,51617 -8,74159
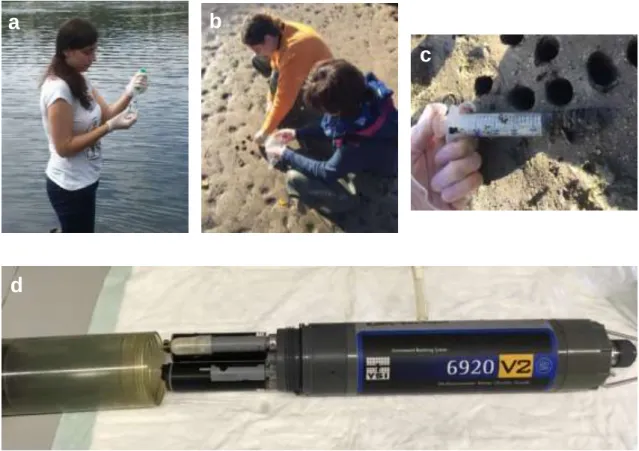
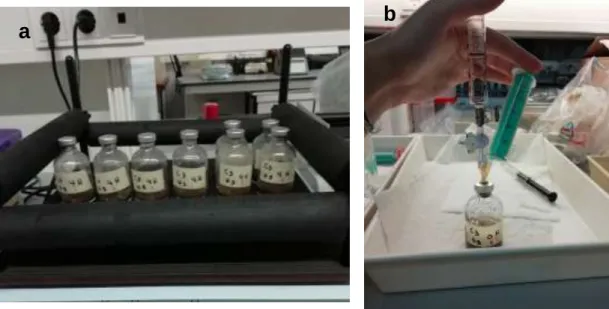
The sampling collection was performed seasonally in summer (Jul), fall (Nov), winter (Feb), and spring (May). The water samples were collected with syringes and 10 mL were added to 20 mL serum bottles (Figure 5a). Triplicate water samples were collected at each site. The serum bottles were previous sealed with butyl stopper and aluminium crimp, and purged 10 minutes in N2 to remove the O2. One litre of water was collected in
a plastic bottle to be used in the sediment incubations. Sediment samples were collected using cut-off end syringes (Figure 5b, 5c). Fifteen sediment cores (5 cm depth) were collected at each site, and placed in a plastic bag. All samples were refrigerated in ice chests and transported to the laboratory for further processing. Water samples were analysed immediately upon arrival, and sediments samples were processed within 24h. Temperature, salinity, conductivity, dissolved oxygen, pH and turbidity were measured in situ using a YSI 6920 V2 multiprobe (figure 5d).
Experimental procedures
Sediment samples were characterized in terms of water and organic matter contents. Three replicates of sediment from each site were dried for 24 h (105ºC), providing the percentage of water content (humidity), and then ignited in the muffle for 4 h (550ºC), providing the percentage of organic matter.
To analyse the concentration of CH4 and N2O in the water, each serum bottle was
vigorously shaken for 1 minute, 4 mL were collected to measure CH4 concentration, and
8 mL of headspace was collected by displacement to measure N2O concentration
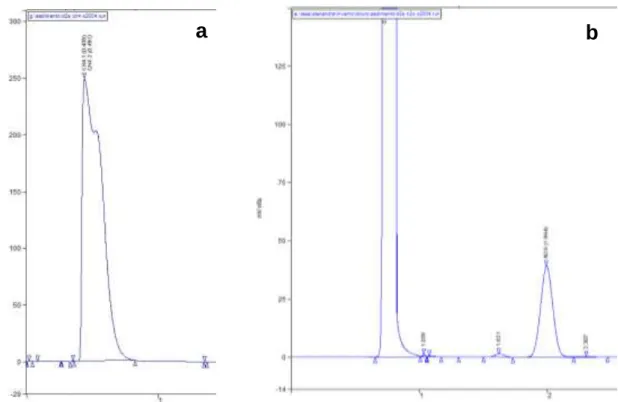
(Teixeira et al., 2010). CH4 and N2O levels were quantified in a Varian gas
chromatographer (CP-3800). CH4 levels were determined using a PoraPak T column
and a Flame Ionization Detector (GC-FID) (Figure 6a), and N2O levels using two
HayeSep D columns and an Electron Capture Detector (GC-ECD) (Figure 6b). The GC was calibrated using a certified gas standard mixture of N2O and CH4.
c
a
d
b
Figure 5 –Sampling collection (water collection (a), sediments collection (b, c)), and multiparametric sonde used to measure water variables in situ (d).
The fluxes of CH4 and N2O from the sediments were estimated using slurry incubations.
Slurries consisted of 10 mL of filtered (0.2 µm) estuarine water and 5 mL of homogenized sediment in 50 mL serum bottles sealed with butyl stopper and aluminium crimp. For each site, six serum bottles were prepared, three for incubation in the presence of oxygen (O2), and three purged 20 min with N2, for incubation without O2. An extra set of
time zero slurries were prepared and sacrificed immediately after closure/purging, to quantify initial CH4 and N2O levels. All remaining samples were incubated for 4h at
constant stirring (100 rpm) (Figure 7a). At the end of the incubation, headspace samples were collected to quantify CH4 and N2O as described above (Figure 7b). Due to technical
problems, N2O could not be quantified in the spring samples.
a
b
Data analysis
Data were tested for normality and homogeneity of variances. Linear correlation analysis was conducted to establish relationships between CH4 and N2O and environmental
parameters measured. Statistical analysis was performed at the 95% confidence level (p < 0.05) using STATISTICA 13.0 (StatSoft, Inc., Palo Alto, CA, USA).
Figure 7 – Slurry incubations (a), and sampling of the headspace for N2O measurement (b).
Results
Characterization of water and sediment samples
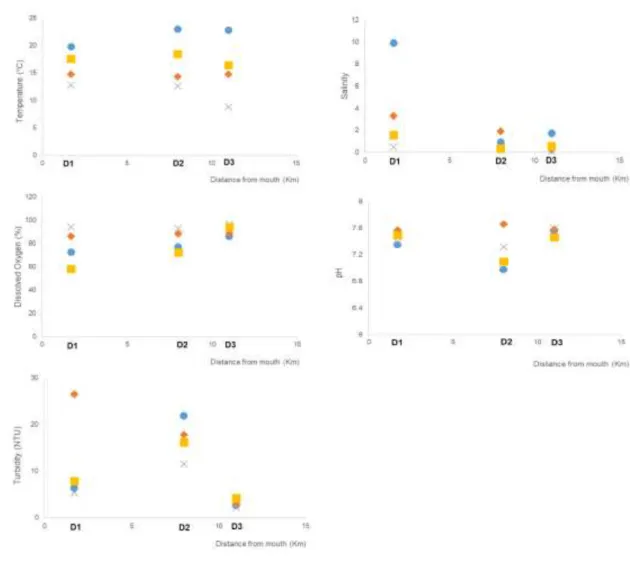
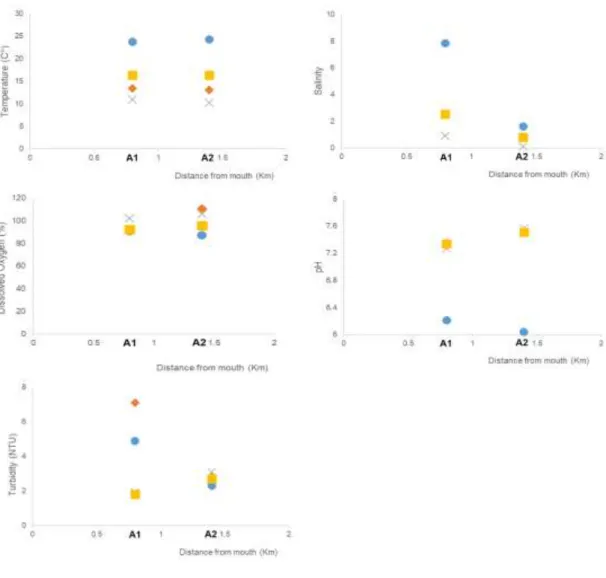
The water variables measured in situ, from Douro, Ave and Cávado estuaries, are presented in Figures 8, 9 and 10, respectively.
In Douro estuary, the variation of water temperature was according to the season, with higher values during the summer and lower in the winter. The salinity presented higher values in the lower estuary during the summer, site D1. The other two sites, D2 and D3, presented identical low salinity values during all seasons. Dissolved oxygen saturation ranged from 72.2 to 96.7 %, with the higher value found during the winter. Estuarine water pH varied between 6.98 and 7.66, being the higher value obtained in the summer. During the summer, maximum turbidity was found in the middle estuary, whereas in the upstream site values were always lower.
In Ave estuary, the temperature presented also a clear seasonal variation, with a similar temporal and spatial trend as in the Douro (Figure 9). The values obtained for salinity were higher in the summer, on the lower estuary, site A1. In this site, the salinity variation was higher than in site A2. Similar values of salinity were found for fall and spring in both sites. The highest value of dissolved oxygen saturation was obtained in the fall, with values ranging from 90.7 to 110.6 % during the four seasons. In this estuary, the water pH ranged from 6.04 to 7.57, the highest value being measured in the winter. In terms of turbidity, site A1 presented a seasonal variation, but not in site A2.
In Cávado estuary, the water temperature fluctuated according to the season, as in the other estuaries (Figure 10). The values obtained for salinity in site C1, in the lower estuary, during the summer were the higher obtained in all the study. The sites C2 and C3 presented a lower variation. The dissolved oxygen saturation ranged between 79 to 142.6 %. The abnormally high value obtained in the spring might be related to the presence of phytoplankton. In terms of pH, the values range from 6.57 to 8.18, this last one obtained in the spring. The values of turbidity presented a noticeable variation within the sites and the estuary.
The sediment water and organic matter contents are presented in Table 2.
The highest percentage of humidity was 57.1 % obtained in Cávado estuary, C2, during the winter. In the Douro estuary, the higher percentage of humidity was obtained in the site D2 during the winter, 32.8 %. In the Ave estuary, the higher percentage of humidity was 53.2 % obtained during the fall on site A2. The higher percentage of organic matter was 12.11 % obtained during the fall in Ave estuary, A2. In the Douro estuary, the higher percentage was obtained in the fall, on site D2, 4.63 %. The Cávado estuary presented a higher percentage of organic matter in the winter, on site C2 with 9.03 %. As expected, all three estuaries, the correlation between the humidity and organic matter was high, with coefficients of 0.92, 0.91 and 0.96, for Douro, Ave and Cávado estuaries, respectively.
Table 2 – Values of water and organic matter contents in sediments (values represent averages ± sd of 3 replicates).
Dissolved CH
4and N
2O in estuarine water
In Table 3, the results obtained for dissolved CH4 and N2O in the water are summarized.
The highest value of dissolved CH4 was obtained in D2 during spring (1.149 nmol L-1).
The highest value of dissolved N2O was also obtained in D2 but during the winter (0.104
nmol L-1). In the Ave estuary, the higher value of dissolved CH
4 was 0.056 nmol L-1,
obtained during spring at site A1. The higher value of dissolved N2O was obtained during
the summer at site A2 (0.011 nmol L-1). In Cávado estuary, the higher value of dissolved
Water (%) Organic matter (%) Water (%) Organic matter (%) S um me r D1 28.7±0.78 4.22±0.41 W inte r D1 20.1±0.25 1.73±0.05 D2 20.4±0.52 1.34±0.04 D2 32.8±2.67 3.97±0.64 D3 23.1±0.60 1.83±0.13 D3 29.0±0.95 2.94±0.22 A1 15.2±0.46 0.73±0.11 A1 12.8±1.56 0.74±0.18 A2 28.0±1.19 3.48±0.26 A2 39.1±0.76 6.64±0.13 C1 17.8±0.16 1.46±0.38 C1 19.4±0.36 0.86±0.03 C2 27.5±0.79 1.52±0.12 C2 57.1±1.27 9.03±0.64 C3 29.6±0.97 1.86±0.26 C3 19.4±1.29 1.18±0.04 F al l D1 30.7±0.67 4.63±0.36 S pri ng D1 20.3±0.56 1.87±0.09 D2 30.4±0.86 4.30±0.22 D2 21.1±0.82 1.94±0.28 D3 22.8±0.36 1.56±0.22 D3 22.3±0.51 2.35±0.15 A1 17.3±0.64 5.59±0.00 A1 16.0±0.59 1.07±0.67 A2 53.2±0.79 12.11±0.54 A2 50.7±0.74 9.39±0.19 C1 17.4±0.57 1.35±0.14 C1 17.9±0.62 1.26±0.03 C2 44.0±0.66 5.74±0.21 C2 52.3±0.29 8.59±0.23 C3 19.3±0.50 0.98±0.02 C3 13.3±0.48 0.58±0.03
CH4 was 0.068 nmol L-1, obtained during fall at site C3. The higher value of dissolved
N2O was obtained at site C1 during the winter (0.010 nmol L-1).
Douro estuary presented higher concentrations for both dissolved CH4 and N2O. The
Ave and Cávado estuaries presented similarly lower concentrations.
Table 3 – Dissolved CH4 and N2O in sample water. The values presented are the average ± sd . (n.d. – not determined due to technical problems)
Production and consumption of CH
4in sediments
In the Douro estuary, the site with the higher values of CH4 production was D2 (middle
estuary) in both incubations (Figure 11). Under aerobic conditions, the higher value was obtained in the fall, 13.37 nmol h-1 g-1 wet sed. The higher production rate, under
anaerobic conditions, was 26.48 nmol h-1 g-1 wet sed, and was obtained in the winter.
CH4 (nmol L-1) N2O (nmol L-1) CH4 (nmol L-1) N2O (nmol L-1) S umm e r D1 0.091±0.004 0.011±0.001 Win ter D1 0.055±0.000 0.014±0.001 D2 0.472±0.029 0.021±0.001 D2 0.891±0.582 0.104±0.017 D3 0.006±0.001 0.007±0.000 D3 0.015±0.003 0.004±0.000 A1 0.021±0.018 0.010±0.001 A1 0.046±0.001 0.010±0.002 A2 0.017±0.003 0.011±0.000 A2 0.031±0.001 0.008±0.000 C1 0.010±0.000 0.004±0.001 C1 0.011±0.001 0.010±0.001 C2 0.025±0.001 0.007±0.000 C2 0.024±0.001 0.008±0.001 C3 0.026±0.004 0.008±0.000 C3 0.024±0.001 0.009±0.000 Fa ll D1 0.073±0.044 0.005±0.001 S prin g D1 0.128±0.010 n.d. D2 0.666±0.158 0.028±0.004 D2 1.149±0.346 n.d. D3 0.029±0.000 0.017±0.002 D3 0.071±0.002 n.d. A1 0.028±0.004 0.009±0.001 A1 0.056±0.015 n.d. A2 0.040±0.000 0.007±0.001 A2 0.045±0.015 n.d. C1 0.028±0.003 0.006±0.000 C1 0.029±0.003 n.d. C2 0.040±0.007 0.009±0.000 C2 0.049±0.003 n.d. C3 0.068±0.057 0.009±0.001 C3 0.031±0.009 n.d.
In the Ave estuary, site A2 presented the higher values of both production and consumption of CH4 (figure 12). The highest consumption value was 51.7 nmol h-1 g-1
wet sed, and was obtained under aerobic conditions, in the spring. Under anaerobic conditions, the highest value of production was 1.98 nmol h-1 g-1 wet sed in the winter.
In the Cávado estuary, the site with the higher production and consumption of CH4 was
the C2 (Figure 13). Under aerobic condition, in the winter, there was a consumption of 0.27 ± 0.081 nmol h-1 g-1 wet sed. Also, in the winter, but under anaerobic conditions, the
higher value of production was 0.12 ± 0.103 nmol h-1 g-1 wet sed.
b a
Figure 11 - Methane production in Douro estuary sediments in aerobic (a), and anaerobic (b) conditions.
Sediments from the Douro estuary, under aerobic and anaerobic conditions fostered CH4
production, while in Ave and Cávado middle stretches, under aerobic conditions, acted as CH4 sinks, in the spring and winter, respectively. However, during the winter and
under anaerobic conditions, Ave and Cávado middle and upper estuaries were active places of CH4 production. Overall, looking at the CH4 emission potential from the studied
estuaries, Douro estuary presented higher production rates, followed by Ave estuary, and finally Cávado estuary with the lowest rates.
Figure 13 - Methane production in Cávado estuary sediments in aerobic (a), and anaerobic (b) conditions.
a b
Figure 12 - Methane production in Ave estuary sediments in aerobic (a), and anaerobic (b) conditions. * Value reported in the right vertical axis.
a b
Production and consumption N
2O in sediments
In the Douro estuary, the higher values of production and consumption of N2O were
obtained in the winter in site D2 (Figure 14). Under aerobic conditions, positive fluxes (production) were measured for all sediments, with the higher rates being 0.061 nmol h -1 g-1 wet sed. Inversely, in incubations without oxygen, negative fluxes (consumption)
was observed for most sediments. The higher consumption rate obtained, was 0.065 nmol h-1 g-1 wet sed. As referred previously, the values of N
2O from spring were not
available due to technical problems.
In the Ave estuary, site A1 presented the higher production values of N2O (Figure 15). In
aerobic conditions, the value was 0.10 nmol h-1 g-1 wet sed. The value in anaerobic
condition was 0.05 nmol h-1 g-1 wet sed. In both incubations, the higher values were
obtained in the summer.
For Cávado estuary, the higher production and consumption values were both obtained in site C2, and in the fall (Figure 16). Under aerobic conditions, the higher production value was 0.007 nmol h-1 g-1 wet sed. The higher value of consumption was obtained
under anaerobic conditions, 0.005 nmol h-1 g-1 wet sed.
a b
Figure 14 – Nitrous oxide production in Douro estuary sediments in aerobic (a), and anaerobic (b) conditions.
Overall, in what N2O emissions are concerned, Ave estuary presented the higher
production potential followed by Douro estuary and, finally, Cávado estuary with lower rates.
CH
4and N
2O fluxes per unit area
The obtained results from the sediments were tentatively compared with other studies by estimating the fluxes per unit area using the surface area of sediments in incubation
Figure 15 – Nitrous oxide production in Ave estuary sediments in aerobic (a), and anaerobic (b) conditions.
b a
Figure 16 – Nitrous oxide production in Cávado estuary sediments in aerobic (a), and anaerobic (b) conditions.
bottles. The Douro estuary, under anaerobic conditions, reached 57.0 µmol h-1 m-2 of
CH4 production in winter survey, while Ave and Cávado estuaries presented maximum
values one to two orders of magnitude lower (5.9 µmol h-1 m-2, 0.32 µmol h-1 m-2,
respectively). Under aerobic conditions, the obtained results were in the same line with the Douro estuary, reaching 37.9 µmol h-1 m-2, in the fall, while the Ave and Cávado
estuaries presented values of 1.9 µmol h-1 m-2 and 0.07 µmol h-1 m-2, respectively in the
winter. The emissions of N2O from the sediments in the Douro estuary, under anaerobic
conditions, reached 27.8 nmol h-1 m-2. Under aerobic conditions, the emissions of N 2O
reached 135.8 nmol h-1 m-2. In the Ave estuary, the emissions of N
2O reached 153.9
nmol h-1 m-2, and 201.4 nmol h-1 m-2 under anaerobic and aerobic conditions,
respectively. Under anaerobic conditions, in the Cávado estuary, the emissions reached 15.5 nmol h-1 m-2. Under aerobic conditions, the N
2O emission reached 11.3 nmol h-1 m-2.
Correlations between CH
4and N
2O and environmental variables
The correlation coefficients between dissolved CH4 and N2O and measured
environmental variables for each studied estuary are presented in Table 4.
In the water from the Douro estuary, the dissolved CH4 concentration was correlated with
the dissolved N2O concentrations (R=0.84). In the Ave estuary, the dissolved CH4
concentration was positively related with dissolved oxygen saturation, and pH, presenting R values of 0.75 and 0.86, respectively. The dissolved N2O concentration in
Ave estuary was inversely related with the pH (R=-0.91). In the Cávado estuary, the dissolved CH4 concentration was inversely correlated with the oxygen saturation
(R=-0.59), and the dissolved N2O concentration showed an inverse relation with salinity
(R=-0.84).
The correlation coefficients between CH4 and N2O fluxes estimated in sediments from
Douro, Ave, Cávado, and environmental values are presented in Tables 5, 6 and 7. In the Douro estuary, the anaerobic CH4 production, presented a positive relation with
sediment water content, R=0.62 (Table 5). Under aerobic conditions, it correlated with turbidity, (R=0.78), and again with the percentage of water in the sediment (R=0.60). CH4
production presented a positive relation with N2O production under aerobic conditions
(R=0.72), while under anaerobic conditions an opposite trend was found (R=-0.91).
Table 4 – Correlation coefficients between dissolved CH4 and N2O, and environmental variables measured in Douro, Ave and Cávado estuaries, (significant correlations, p<0.05, are presented in red) (T – Temperature: Sal – Salinity; OD Sat – Dissolved oxygen saturation; Turb – Turbidity; Sed water – Sediments water content; Sed OM – Sediments Organic matter).
Douro Ave Cávado
CH4 N2O CH4 N2O CH4 N2O N2O 0.8403 p=0.005 1 -0.6466 p=0.165 1 0.3611 p=0.340 1 T 0.0520 p=0.873 -0.2140 p=0.580 -0.5334 p=0.121 0.7937 p=0.059 -0.1025 p=0.751 -0.5270 p=0.145 Sal -0.2291 p=0.474 -0.2484 p=0.519 0.4595 p=0.252 0.4082 p=0.422 -0.5053 p=0.094 -0.8379 p=0.005 OD Sat -0.1617 p=0.616 0.2401 p=0.534 0.7465 p=0.033 -0.8020 p=0.055 -0.5859 p=0.045 -0.3362 p=0.376 pH -0.5406 p=0.070 -0.2692 p=0.484 0.8614 p=0.006 -0.9095 p=0.012 0.3153 p=0.318 0.2977 p=0.437 Turb 0.3584 p=0.253 0.0542 p=0.890 -0.2439 p=0.560 -0.2179 p=0.678 -0.3126 p=0.322 -0.4098 p=0.273 Sed Water 0.1474 p=0.648 0.4338 p=0.243 0.1314 p=0.756 -0.5883 p=0.219 -0.0375 p=0.908 0.2048 p=0.597 Sed OM 0.1229 p=0.704 0.2492 p=0.518 0.0693 p=0.870 -0.7693 p=0.074 -0.0296 p=0.927 0.1102 p=0.778
Table 5 – Correlation between environmental variables and sediments in Douro estuary under aerobic and anaerobic conditions (only variables with significant correlations (p<0.05) are presented which coefficients are highlighted in red).
Aerobic incubations Anaerobic incubations
CH4 N2O CH4 N2O N2O 0.7202 p=0.029 1 -0.9025 p=0.001 1 Turb 0.7838 p=0.003 0.2880 p=0.452 0.5286 p=0.077 -0.2912 p=0.447 Sed Water 0.5988 p=0.040 0.2905 p=0.448 0.6214 p=0.031 -0.6353 p=0.066
In the Ave estuary, only the production of N2O in sediments (Table 6) presented a
significant (p<0.05) correlation with salinity, under both anaerobic and aerobic conditions, R=0.94 and R=0.91, respectively.
Table 6 – Correlation between environmental variables and sediments in Ave estuary under aerobic and anaerobic conditions (only variables with significant correlations (p<0.05 are presented which coefficients are highlighted in red).
Aerobic incubations Anaerobic incubations
CH4 N2O CH4 N2O N2O -0.1805 p=0.732 1 -0.4437 p=0.378 1 Sal 0.1743 p=0.680 0.9074 p=0.012 -0.3458 p=0.401 0.9359 p=0.006
In the Cávado estuary, the production of N2O, under aerobic conditions, presented a
positive and significant (p<0.05) relation with sediment characteristics, water (R=0.81) and the organic matter (R=0.83) contents (Table 7).
Table 7 – Correlation between environmental variables and sediments from Cávado estuary under aerobic and anaerobic conditions (only variables with significant correlations (p<0.05) are presented which coefficients are highlighted in red)
Aerobic incubations Anaerobic incubations
CH4 N2O CH4 N2O N2O -0.3708 p=0.326 1 -0.4410 p=0.235 1 Sed water 0.4043 p = 0.192 0.8081 p=0.008 0.5104 p=0.090 -0.5170 p=0.154 Sed OM -0.5359 p=0.073 0.8256 p=0.006 0.4852 p=0.110 -0.5761 p=0.105
Discussion
Background
The increase of greenhouse gases emissions, through anthropogenic activities, have an important role in the greenhouse effect (Houghton, 2009). Greenhouse gases, such as CO2, CH4, and N2O owe their importance based on two factors: their atmosphere
concentration, and their ability of absorbing infrared radiation (Lashof et al., 1990). CO2
is considered to be the most important greenhouse gas present in the atmosphere (IPCC, 2007b). Although its concentration in the atmosphere is the highest of the three above mentioned gases, is absorption capacity is the lowest. With a lower concentration in the atmosphere CH4 and N2O have, however, absorption capacities 34 and 298 times
higher than CO2, making them the two most important greenhouse gases in the
atmosphere (IPCC, 2014a). Greenhouse gases have two sources of emissions: natural and anthropogenic. Natural sources of CH4 are wetlands, methanogenic activity in soil
and sediments, animal digestive processes such as termites and ruminants, and natural transfer from the soil to the air. Anthropogenic sources are burning of fossil fuel, agriculture, burning or destruction of biomass (Hu et al., 2019). In the N2O case, the
natural sources are soils and oceans. The anthropogenic sources are agriculture, wastewater management and fossil combustion (Houghton, 2009).
Estuaries are important ecosystems that provide essential ecological functions such as decomposition and nutrient cycling (Levin et al., 2001). The consequence of global warming can cause serious problems in estuaries and coastal zones. The rising of sea levels can cause more erosion and an increase of saltwater intrusion in the estuaries, causing the lost decrease in freshwater availability (Houghton, 2009).
Dissolved methane emissions to the atmosphere has been studied previously. Studies have been focused on water systems like lakes (Sanches et al., 2019), estuaries (Gwenaël et al., 2002; Middelburg et al., 2002; Upstill-Goddard et al., 2000), coastal waters (Bange et al., 1998), and salt marshes (Ferrón et al., 2007) In these studies, the higher value was obtained in a river in Brazil (8000 nmol L-1). Emissions of CH
4 from
sediments have been studied in rice paddy fields (Zhou et al., 2018), in grassland regions (Tang et al., 2019), in mangroves (Allen et al., 2011), in estuarine intertidal sediments (Li et al., 2019), and manure of dairy cows (Hu et al., 2018). The last environment provided the highest CH4 production (720 µmol h-1 m-2).
Previous studies on the emissions of nitrous oxide to the atmosphere from aquatic systems and sediments include estuaries (Bange et al., 1996; de Wilde et al., 2000), coastal waters (Bange et al., 1996), and marginal seas (Ferrón et al., 2007; Hashimoto et al., 1999). As in the case of N2O, estuaries with 338 nmol L-1 were the most productive.
In the case of sediment emissions, studies were performed in rice paddy fields (Zhou et al., 2018), in mangroves (Allen et al., 2011), and in estuaries intertidal sediments (Li et al., 2019; Middelburg et al., 1995). The highest values were obtained in mangroves (4587 nmol h-1 m-2).
Dissolved CH4 and N2O in estuarine water
The highest methane levels in estuarine water were 0.056 nmol L-1, 0.068 nmol L-1 and
1.149 nmol L-1, in Ave, Cávado and Douro estuaries, respectively. Throughout the
seasons, the higher concentrations were always obtained at site D2, in the Douro estuary, located at the mouth of Tinto river. The obtained values might be related to the presence of effluent from two WWTPs, and subsequently an increase of organic matter availability. Methane production is usually related to microbial organic matter decomposition (Wuebbles et al., 2002). No seasonal trend was observed for measured CH4 concentrations for the studied estuaries. Additionally, no common relation was found
between CH4 levels and the measured environmental variables, with dissolved oxygen
being positively related to CH4 in Ave estuary, while negatively related in Cávado estuary.
Previous studies report values for dissolved CH4 in European estuaries ranging from 111
to 600 nmol L-1, and in rivers from 5 to 8000 nmol L-1 (Middelburg et al., 2002). Ferrón et
al. (2007) compiled values for dissolved CH4 from 2.1 to 4201 nmol L-1 in estuaries. For
coastal waters and marginal seas concentrations ranged from 2.0 to 1360 nmol L-1
(Ferrón et al., 2007). When comparing the results obtained in this study to the available data from the literature, it is clear that the three estuaries studied presented low levels of dissolved CH4, i.e. the productivity was smaller.
Dissolved N2O levels reached 0.010 nmol L-1, 0.011 nmol L-1, and 0.104 nmol L-1,
corresponding to maximum concentrations obtained in Cávado, Ave, and Douro estuaries. Similarly, to dissolved CH4, the highest values of dissolved N2O were obtained
in Douro, at site D2. As in the case of CH4, the values obtained of dissolved N2O did not
present a seasonal trend as in the case of CH4. The only estuary where dissolved N2O
inverse relation with the salinity, in the vein of the trend reported also for other estuaries (Bange, 1992). In Douro estuary, a significant relation (p<0.05) was obtained between the dissolved N2O and CH4, denoting a possible common source for substrate.
Values of dissolved N2O ranging from 10 to 338 nmol L-1 have been found in estuaries
(de Wilde et al., 2000), representing 2-3 orders of magnitude higher than in the most productive studied estuary (Douro). Therefore, the tree estuaries studied presented lower dissolved N2O concentrations than other studied environments.
CH4 and N2O fluxes from estuarine sediments
Fluxes of CH4 and N2O were measured in sediment slurries during incubations with and
without oxygen in order to ascertain eventual sinks and sources. In the presence of oxygen, negative fluxes (sinks) of CH4 were observed in sediments from two locations:
Ave estuary site A2 (spring), and Cávado estuary site C2 (winter). Anaerobic conditions stimulated CH4 production in most sediments. The higher CH4 production values,
recorded in site D2, were obtained in fine-grained sediments rich in organic matter, environment, suitable for methanogens (Wuebbles et al., 2002). Methane production in the Douro and Ave estuaries were higher than previously reported in Australian estuaries (2.9 µmol h-1 m-2) (Allen et al., 2011), but lower than reported from estuaries in China
(570.4 µmol h-1 m-2 and 74.2 µmol h-1 m-2) (Hu et al., 2019; Li et al., 2019). Douro estuary
presented a relation between CH4 production and water column turbidity. Also, in Douro
estuary, a positive relation was found between CH4 and sediment water content. Higher
percentages of water were found in fine grained sediments associated with higher organic matter contents. Nonetheless, no significant relation was found between organic matter and CH4 production.
Positive fluxes of N2O were generally found in incubations in the presence of O2. Under
aerobic conditions, N2O is likely to be produced during the nitrification process (Bange,
2000). In incubations without O2, N2O was consumed in most slurries from Douro
estuary. In sediments from Ave and Cávado estuaries, anaerobic production of N2O was
found, especially in downstream locations. Under anaerobic conditions, denitrification was probably the main responsible for N2O production (Bange, 2000). Consumption of
N2O was generally observed in the colder seasons, with higher values obtained in the
site D2. A possible effect of temperature in the production of N2O was observed in Ave
N2O values were lower than previously reported in estuaries from Australia, China, and
Belgium (Allen et al., 2011; Li et al., 2019; Middelburg et al., 1995). In Douro estuary, a relation was found between CH4 and N2O production, a positive relation under aerobic
conditions, and an inverse relation under anaerobic conditions. Ave estuary presented a positive relation with salinity, under both aerobic and anaerobic conditions. A relation between N2O emission and salinity was also found in other estuarine systems (Franklin
et al., 2017; Li et al., 2019). Cávado N2O production presented a positive relation, under
aerobic conditions, with sediments water and sediment organic matter.
In spite of the above mentioned, no consistent relation was found between CH4 and N2O
fluxes and environmental variables measured, indicating that the sites on this study represented unique ecosystems, with various process and interactions occurring simultaneously (Welti et al., 2016). Indeed, the different range of emissions of both CH4
and N2O from the three estuaries reflected the specificity of environmental conditions.
The selected sites and estuaries present different characteristics between them and anthropogenic pressures. Site, D2, in the Douro estuary is a clear example, with effluents from two polluted tributaries (rivers Tinto and Torto), two wastewater treatment plants, and a recreational port, all within the same area. Coincidentally, the highest dissolved gases concentrations and potential emission rates from sediment were found for this location. Nonetheless, the potential emission fluxes of both CH4 and N2O from these
estuaries were lower than reported for other estuaries around the world. Therefore, the contribution to global warming is expected to be of smaller magnitude under current conditions, then in other places.
This study provided knowledge about the situation of the three estuaries from Northern Portugal. However, more studies in different areas within the estuary are necessary to better understand their contribution to the emission of greenhouse gases. Studies in freshwater tributaries are necessary to better understand their contribution to the emission of greenhouse gas. Increasing the magnitude of the studies allows a better understanding of the real emissions rates that occur in our estuaries.
Conclusions
Although the three estuaries are located within the same geographic area, they presented substantially different results in what N2O and CH4 emissions are concerned.
Even though the three estuaries are heavily urbanized and modified, the values obtained were lower than reported in other estuarine systems worldwide, although higher values were found in the most human impacted locations. Measures to address and limit the problem are important to prevent negative impacts in the future.
Since estuaries are ecological important, further studies are necessary to better understand the anthropogenic impact of N2O and CH4 emissions, and the need for
References
Allen, D., Dalal, R. C., Rennenberg, H., & Schmidt, S. (2011). Seasonal variation in nitrous oxide and methane emissions from subtropical estuary and coastal mangrove sediments, Australia. Plant Biol (Stuttg), 13(1), 126-133.
Araújo, M. A. V. C., Teixeira, J. C. F., & Teixeira, S. F. C. F. (2010). Physical characterization of estuarine sediments in the northern coast of Portugal. Journal
of Coastal Research, 26(2), 301-311.
Azevedo, I. C., Bordalo, A. A., & Duarte, P. M. (2010). Influence of river discharge patterns on the hydrodynamics and potential contaminant dispersion in the Douro estuary (Portugal). Water Res, 44(10), 3133-3146.
Azevedo, I. C., Duarte, P. M., & Bordalo, A. A. (2006). Pelagic metabolism of the Douro estuary (Portugal) – Factors controlling primary production. Estuarine, Coastal
and Shelf Science, 69(1), 133-146.
Azevedo, I. C., Duarte, P. M., & Bordalo, A. A. (2008). Understanding spatial and temporal dynamics of key environmental characteristics in a mesotidal Atlantic estuary (Douro, NW Portugal). Estuarine, Coastal and Shelf Science, 76(3), 620-633.
Bange, H., Dahlke, S., Ramachandran, R., Meyer-Reil, L. A., Rapsomanikis, S., & Andreae, M. (1998). Seasonal Study of Methane and Nitrous Oxide in the Coastal
Waters of the Southern Baltic Sea (Vol. 47).
Bange, H. W. (2000). It's not a gas. Nature, 408(6810), 301-302.
Bange, H. W., Rapsomanikis, S., & Andreae, M. O. (1996). Nitrous oxide in coastal waters. Global Biogeochemical Cycles, 10(1), 197-207.
Bange, H.W., Rapsomanikis, S. and Andreae, M.O. (1992). The contribution of coastal and shelf areas to the marine emissions of N2O: Measurements of dissolved
and atmospheric N2O in the Gironde estuary. Ann. Geophys., 10, Suppl. II: C
221.
Barbosa-Vasconcelos, A., Mendes, Â., Martins, F., Lopes, E., Machado, A., Bordalo, A. A., Vaz-Pires, P., Vieira, N., Martins da Costa, P., & Bessa, L. J. (2018). River water analysis using a multiparametric approach: Portuguese river as a case study. Journal of Water and Health, 16(6), 991-1006.
Bastviken, D. (2009). Encyclopedia of Inland Waters. In G. E. Likens (Ed.), Encyclopedia
Bodri, L., & Cermak, V. (2007). Borehole Climatology. A new method on how to reconstruct climate. In L. Bodri & V. Cermak (Eds.), Borehole Climatology (pp. 175-266). Oxford: Elsevier Science Ltd.
Bordalo, A. A., & Vieira, M. E. C. (2005). Spatial variability of phytoplankton, bacteria and viruses in the mesotidal salt wedge Douro Estuary (Portugal). Estuarine, Coastal
and Shelf Science, 63(1), 143-154.
Brusseau, M. L., Matthias, A. D., Musil, S. A., & Bohn, H. L. (2019). Environmental and Pollution Science. In M. L. Brusseau, I. L. Pepper, & C. P. Gerba (Eds.),
Environmental and Pollution Science (Third Edition) (pp. 47-59): Academic
Press.
Carrola, J., Santos, N., Rocha, M. J., Fontainhas-Fernandes, A., Pardal, M. A., Monteiro, R. A., & Rocha, E. (2014). Frequency of micronuclei and of other nuclear abnormalities in erythrocytes of the grey mullet from the Mondego, Douro and Ave estuaries--Portugal. Environ Sci Pollut Res Int, 21(9), 6057-6068.
Cole, C. V., Duxbury, J., Freney, J., Heinemeyer, O., Minami, K., Mosier, A., Paustian, K., Rosenberg, N., Sampson, N., Sauerbeck, D., & Zhao, Q. (1997). Global estimates of potential mitigation of greenhouse gas emissions by agriculture.
Nutrient Cycling in Agroecosystems, 49(1), 221-228.
Cox, P. M., Betts, R. A., Jones, C. D., Spall, S. A., & Totterdell, I. J. (2000). Acceleration of global warming due to carbon-cycle feedbacks in a coupled climate model.
Nature, 408(6809), 184-187.
Cui, M., Ma, A., Qi, H., Zhuang, X., & Zhuang, G. (2015). Anaerobic oxidation of methane: an "active" microbial process. MicrobiologyOpen, 4(1), 1-11.
de Wilde, H. P. J., & de Bie, M. J. M. (2000). Nitrous oxide in the Schelde estuary: production by nitrification and emission to the atmosphere. Marine Chemistry,
69(3), 203-216.
Elliott, M., & Whitfield, A. K. (2011). Challenging paradigms in estuarine ecology and management. Estuarine, Coastal and Shelf Science, 94(4), 306-314.
EPA. (2019). Greenhouse Gas Emissions | US EPA. Retrieved from www.epa.gov/ghgemissions/overview-greenhouse-gases
Fenchel, T., King, G. M., & Blackburn, T. H. (2012). Chapter 1 - Bacterial Metabolism. In T. Fenchel, G. M. King, & T. H. Blackburn (Eds.), Bacterial Biogeochemistry
(Third Edition) (pp. 1-34). Boston: Academic Press.
Ferrón, S., Ortega, T., Gómez-Parra, A., & Forja, J. M. (2007). Seasonal study of dissolved CH4, CO2 and N2O in a shallow tidal system of the bay of Cádiz (SW Spain). Journal of Marine Systems, 66(1-4), 244-257.
Franklin, R. B., Morrissey, E. M., & Morina, J. C. (2017). Changes in abundance and community structure of nitrate-reducing bacteria along a salinity gradient in tidal wetlands. Pedobiologia, 60, 21-26.
Gonçalves, E. P. R., Soares, H. M. V. M., Boaventura, R. A. R., Machado, A. A. S. C., & Esteves da Silva, J. C. G. (1994). Seasonal variations of heavy metals in sediments and aquatic mosses from the Cávado river basin (Portugal). Science
of The Total Environment, 142(3), 143-156.
Gredilla, A., Stoichev, T., Fdez-Ortiz de Vallejuelo, S., Rodriguez-Iruretagoiena, A., de Morais, P., Arana, G., de Diego, A., & Madariaga, J. M. (2015). Spatial distribution of some trace and major elements in sediments of the Cavado estuary (Esposende, Portugal). Mar Pollut Bull, 99(1-2), 305-311.
Gwenaël, A., & Niels, I. (2002). Methane dynamics in a shallow non-tidal estuary (Randers Fjord, Denmark). Marine Ecology Progress Series, 230, 171-181. Hashimoto, S., Gojo, K., Hikota, S., Sendai, N., & Otsuki, A. (1999). Nitrous oxide
emissions from coastal waters in Tokyo Bay. Marine Environmental Research,
47(3), 213-223.
Houghton, J. (2009). Global Warming: The Complete Briefing (4 ed.): Cambridge University Press.
Hu, E., Sutitarnnontr, P., Tuller, M., & Jones, S. B. (2018). Modeling temperature and moisture dependent emissions of carbon dioxide and methane from drying dairy cow manure.
Hu, M., Penuelas, J., Sardans, J., Huang, J., Li, D., & Tong, C. (2019). Effects of nitrogen loading on emission of carbon gases from estuarine tidal marshes with varying salinity. Sci Total Environ, 667, 648-657.
IPCC. (2007a). Agriculture. In Climate Change 2007: Mitigation. . Retrieved from Cambridge University Press, Cambridge, United Kingdom and New York, NY, USA:
IPCC. (2007b). Climate Change 2007: The Science Basis. Retrieved from Cambridge University Press, New York, USA:
IPCC. (2013). Climate Change. The Physical Science Basis. Retrieved from Cambridge University Press, United Kingdom and New York, USA:
IPCC. (2014a). Anthropogenic and Natural Radiative Forcing. In C. Intergovernmental Panel on Climate (Ed.), Climate Change 2013 – The Physical Science Basis:
Working Group I Contribution to the Fifth Assessment Report of the Intergovernmental Panel on Climate Change (pp. 659-740). Cambridge:
IPCC. (2014b). Climate Change 2014: Synthesis Report. Contribution of Working
Groups I, II anf III to the Fifth Assessment Report of the Intergovernmental Panel on Climate Change (978-92-9169-143-2). Retrieved from
IPCC. (2018). Global Warming of 1.5°C. Retrieved from Cambridge University Press, New York, USA:
Lashof, D. A., & Ahuja, D. R. (1990). Relative contributions of greenhouse gas emissions to global warming. Nature, 344(6266), 529-531.
Levin, L. A., Boesch, D. F., Covich, A., Dahm, C., Erséus, C., Ewel, K. C., Kneib, R. T., Moldenke, A., Palmer, M. A., Snelgrove, P., Strayer, D., & Weslawski, J. M. (2001). The Function of Marine Critical Transition Zones and the Importance of Sediment Biodiversity. Ecosystems, 4(5), 430-451.
Li, X., Gao, D., Hou, L., & Liu, M. (2019). Salinity stress changed the biogeochemical controls on CH4 and N2O emissions of estuarine and intertidal sediments. Sci
Total Environ, 652, 593-601.
Martens, D. A. (2005). Encyclopedia of Soils in the Environment. In D. Hillel (Ed.),
Encyclopedia of Soils in the Environment (pp. 378-382). Oxford: Elsevier.
Middelburg, J. J., Klaver, G., Nieuwenhuize, J., Markusse, R. M., Vlug, T., & van der Nat, F. J. W. A. (1995). Nitrous oxide emissions from estuarine intertidal sediments.
Hydrobiologia, 311(1), 43-55.
Middelburg, J. J., Nieuwenhuize, J., Iversen, N., Høgh, N., de Wilde, H., Helder, W., Seifert, R., & Christof, O. (2002). Methane distribution in European tidal estuaries.
Biogeochemistry, 59(1), 95-119.
Moreira, S. M., Moreira-Santos, M., Guilhermino, L., & Ribeiro, R. (2006). An in situ postexposure feeding assay with Carcinus maenas for estuarine sediment-overlying water toxicity evaluations. Environmental Pollution, 139(2), 318-329. North, G. R. (2015). Encyclopedia of Atmospheric Sciences. In G. R. North, J. Pyle, & F.
Zhang (Eds.), Encyclopedia of Atmospheric Sciences (Second Edition) (pp. 80-86). Oxford: Academic Press.
Pritchard, D. W. (1967). What is an estuary: physical viewpoint.
Prosser, J. I. (2005). Encyclopedia of Soils in the Environment. In D. Hillel (Ed.),
Encyclopedia of Soils in the Environment (pp. 31-39). Oxford: Elsevier.
Rasmussen, R. A., & Khalil, M. A. K. (1983). Global production of methane by termites.
Nature, 301(5902), 700-702.
Sanches, L. F., Guenet, B., Marinho, C. C., Barros, N., & de Assis Esteves, F. (2019). Global regulation of methane emission from natural lakes. Scientific Reports,
Skiba, U. (2008). Encyclopedia of Ecology. In S. E. Jørgensen & B. D. Fath (Eds.),
Encyclopedia of Ecology (pp. 866-871). Oxford: Academic Press.
Soares, H. M. V. M., Boaventura, R. A. R., Machado, A. A. S. C., & Esteves da Silva, J. C. G. (1999). Sediments as monitors of heavy metal contamination in the Ave river basin (Portugal): multivariate analysis of data. Environmental Pollution,
105(3), 311-323.
Streletskiy, D., Anisimov, O., & Vasiliev, A. (2015). Snow and Ice-Related Hazards, Risks, and Disasters. In J. F. Shroder, W. Haeberli, & C. Whiteman (Eds.), Snow
and Ice-Related Hazards, Risks and Disasters (pp. 303-344). Boston: Academic
Press.
Sturm, K., Grinham, A., Werner, U., & Yuan, Z. (2016). Sources and sinks of methane and nitrous oxide in the subtropical Brisbane River estuary, South East Queensland, Australia. Estuarine, Coastal and Shelf Science, 168, 10-21. Tang, S., Ma, L., Wei, X., Tian, D., Wang, B., Li, Z., Zhang, Y., & Shao, X. (2019).
Methane emissions in grazing systems in grassland regions of China: A synthesis. Science of The Total Environment, 654, 662-670.
Teixeira, C., Magalhães, C., Boaventura, R. A. R., & Bordalo, A. A. (2010). Potential rates and environmental controls of denitrification and nitrous oxide production in a temperate urbanized estuary. Marine Environmental Research, 70(5), 336-342. Teixeira, C., Magalhaes, C., Joye, S. B., & Bordalo, A. A. (2013). The role of salinity in
shaping dissolved inorganic nitrogen and N(2)O dynamics in estuarine sediment-water interface. Mar Pollut Bull, 66(1-2), 225-229.
Teixeira, C., Magalhães, C., Joye, S. B., & Bordalo, A. A. (2012). Potential rates and environmental controls of anaerobic ammonium oxidation in estuarine sediments.
Aquatic Microbial Ecology, 66(1), 23-32.
Tremblay, A., Varfalvy, L., Roehm, C., & Garneau, M. (2005). Greenhouse Gas
Emissions - Fluxes and Processes (Vol. 1). Springer-Verlag Berlin Heidelberg:
Springer-Verlag Berlin Heidelberg.
Upstill-Goddard, R. C., Barnes, J., Frost, T., Punshon, S., & Owens, N. J. P. (2000). Methane in the southern North Sea: Low-salinity inputs, estuarine removal, and atmospheric flux. Global Biogeochemical Cycles, 14(4), 1205-1217.
Vieira, J., & Bordalo, A. (2000). The Douro estuary (Portugal): a mesotidal salt wedge.
Oceanologica Acta, 23(5), 585-594.
Vieira, J., Pinho, J., & Duarte, A. (1998). Eutrophication vulnerability analysis: A case study. Water Science and Technology, 37(3), 121-128.
Welti, N., Hayes, M., & Lockington, D. (2016). Seasonal nitrous oxide and methane emissions across a subtropical estuarine salinity gradient. Biogeochemistry, 132.
Wuebbles, D. J., & Hayhoe, K. (2002). Atmospheric methane and global change.
Earth-Science Reviews, 57(3), 177-210.
Yoon, S., Carey, J. N., & Semrau, J. D. (2009). Feasibility of atmospheric methane removal using methanotrophic biotrickling filters. Applied Microbiology and
Biotechnology, 83(5), 949-956.
Zhou, M., Wang, X., Wang, Y., & Zhu, B. (2018). A three-year experiment of annual methane and nitrous oxide emissions from the subtropical permanently flooded rice paddy fields of China: Emission factor, temperature sensitivity and fertilizer nitrogen effect. Agricultural and Forest Meteorology, 250-251, 299-307.