Tillage Method Changes in the North China Plain
Shenzhong Tian1, Tangyuan Ning1*, Hongxiang Zhao1, Bingwen Wang1, Na Li1, Huifang Han1, Zengjia Li1, Shuyun Chi2*
1State Key Laboratory of Crop Biology, Shandong Key Laboratory of Crop Biology, Shandong Agricultural University, Taian, Shandong PR, China,2College of Mechanical and Electronic Engineering, Shandong Agricultural University, Taian, Shandong PR, China
Abstract
The objective of this study was to quantify soil methane (CH4) and nitrous oxide (N2O) emissions when converting from
minimum and no-tillage systems to subsoiling (tilled soil to a depth of 40 cm to 45 cm) in the North China Plain. The relationships between CH4 and N2O flux and soil temperature, moisture, NH4+-N, organic carbon (SOC) and pH were
investigated over 18 months using a split-plot design. The soil absorption of CH4appeared to increase after conversion from
no-tillage (NT) to subsoiling (NTS), from harrow tillage (HT) to subsoiling (HTS) and from rotary tillage (RT) to subsoiling (RTS). N2O emissions also increased after conversion. Furthermore, after conversion to subsoiling, the combined global
warming potential (GWP) of CH4and N2O increased by approximately 0.05 kg CO2ha21for HTS, 0.02 kg CO2ha21for RTS
and 0.23 kg CO2ha21for NTS. Soil temperature, moisture, SOC, NH4+-N and pH also changed after conversion to subsoiling.
These changes were correlated with CH4uptake and N2O emissions. However, there was no significant correlation between
N2O emissions and soil temperature in this study. The grain yields of wheat improved after conversion to subsoiling. Under
HTS, RTS and NTS, the average grain yield was elevated by approximately 42.5%, 27.8% and 60.3% respectively. Our findings indicate that RTS and HTS would be ideal rotation tillage systems to balance GWP decreases and grain yield improvements in the North China Plain region.
Citation:Tian S, Ning T, Zhao H, Wang B, Li N, et al. (2012) Response of CH4and N2O Emissions and Wheat Yields to Tillage Method Changes in the North China
Plain. PLoS ONE 7(12): e51206. doi:10.1371/journal.pone.0051206
Editor:Ben Bond-Lamberty, DOE Pacific Northwest National Laboratory, United States of America ReceivedAugust 3, 2012;AcceptedOctober 29, 2012;PublishedDecember 6, 2012
Copyright:ß2012 Tian et al. This is an open-access article distributed under the terms of the Creative Commons Attribution License, which permits unrestricted use, distribution, and reproduction in any medium, provided the original author and source are credited.
Funding:This work was financially supported by the Nature Science Fund of China (30900876 and 31101127), the National Science and Technology Research Projects of China (2012BAD14B17), and Special Research Funding for Public Benefit Industries (Agriculture) of China (201103001). The funders had no role in study design, data collection and analysis, decision to publish, or preparation of the manuscript.
Competing Interests:The authors have declared that no competing interests exist. * E-mail: [email protected] (TN); [email protected] (SC)
Introduction
CH4and N2O play a key role in global climate change [1]. The
emission of gas from disturbed soils is an especially important contributory factor to global change [2]. N2O is emitted from
disturbed soil, whereas CH4is normally oxidized by aerobic soils,
making them sinks for atmospheric CH4in dry farmland systems
[3]. According to estimates of the IPCC [4], CH4and N2O from
agricultural sources account for 50% and 60% of total emissions, respectively. Therefore, it is critical to reduce emissions of greenhouse gases (GHG) from agricultural sources. Many studies have reported that soil tillage has significant effects on CH4and
N2O emissions from farmland because the production,
consump-tion and transport of CH4and N2O in soil are strongly influenced
by tillage methods [5–8].
The North China Plain is one of the most important grain production regions of China. Harrow tillage (HT), rotary tillage (RT) and no-tillage (NT) are frequently used conservation tillage methods in this region because they not only improve crop yield but also enhance the utilization efficiency of soil moisture and nutrients [8–12]. However, successive years of shallow tillage (10– 20 cm) exacerbate the risk of subsoil compaction, which not only leads to the hardening of soil tillage layers and an increase in soil bulk density, but also reduced crop root proliferation, limited water and nutrient availability and reduced crop yield [13].
Subsoiling is an effective method that is used to break up the compacted hardpan layer every 2 or 4 years in HT, RT or NT systems [14,15]. Subsoiling significantly increases soil water content and temperature and decreases soil bulk density as well [16,17]. These rotation tillage systems are currently utilized in the North China Plain. Soil moisture and temperature are two factors controlling CH4 and N2O emissions [18–22]. In addition, CH4
and N2O emissions are normally associated with N application (as
fertilizer) under wet conditions [23].
Collectively, reasonable soil tillage methods may reduce GHG emissions and may be important for developing sustainable agricultural practices [24]. However, it is unclear how conversion to subsoiling would affect CH4and N2O emissions and whether
subsoiling increases or reduces GHG emissions and the GWP of these agricultural techniques. In addition, there is little informa-tion on the soil factors affecting CH4 and N2O emissions after
Materials and Methods
Ethics Statement
The research station of this study is a department of Shandong Agricultural University. This study was approved by State Key Laboratory of Crop Biology, Shandong Key Laboratory of Crop Biology, Shandong Agricultural University.
Study Site
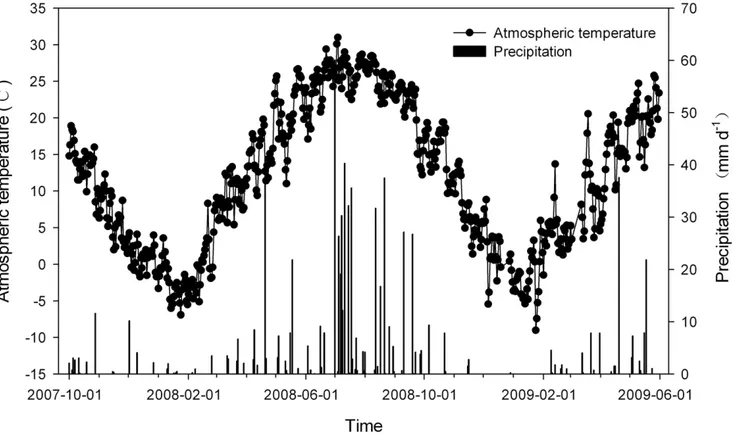
The study was conducted at Tai’an (Northern China, 36u099N, 117u099E), which is characteristic of the North China Plain. The average annual precipitation is 786.3 mm, and the average annual temperature is 13.6uC, with the minimum (21.5uC) and maximum (27.5uC) monthly temperatures in January and July, respectively. The annual frost-free period is approximately 170– 220 days in duration, and the annual sunlight time is 2462.3 hours. The soil is loam with 40% sand, 44% silt and 16% clay. The characteristics of the surface soil (0–20 cm) were measured as follows: pH 6.2; soil bulk density 1.43 g cm23; soil organic matter 1.36%; soil total nitrogen 0.13%; and soil total phosphorous 0.13%. The meteorological data during the experiment are shown in Figure 1.
Experimental Design
The experiment was designed as HT, RT and NT farming methods that started in 2004. In 2008, each plot was bisected, with one half maintained using the original tillage method as the control and the other half converted to subsoiling, resulting in six treatment plots: HT and HT conversion to subsoiling (HTS); RT and RT conversion to subsoiling (RTS); and NT and NT conversion to subsoiling (NTS) in a split-plot design with three
replicates. Each replicate was 35 m long and 4 m wide. After maize was harvested in each plot, straw was returned to the soil by one of the six following tillage operations:
HT - disking with a disc harrow to a depth of 12 cm to 15 cm, RT - rototiller plowing to a depth of 10 cm to 15 cm, NT - no tillage,
HTS, RTS, and NTS - plowed using a vibrating sub-soil shovel to a depth of 40 cm to 45 cm,
The experimental site was cropped with a rotation of winter wheat (Triticum aestivumLinn.) and maize (Zea mays L.). The wheat was sown in mid-October immediately after tilling the soil and was harvested at the beginning of June the following year. The maize was sown directly after the wheat harvest and was harvested in early October. During the wheat growth period, fertilizer was used at a rate of 225 kg N ha21, 150 kg ha21P2O5and 105 kg ha21
K2O, and 100 kg N ha21was used as topdressing in the jointing
stage with 160 mm of irrigation water. During the maize growth period, 120 kg N ha21, 120 kg ha21P2O5and 100 kg ha2
1
K2O
were used as a base fertilizer, and 120 kg N ha21 was used as topdressing in the jointing stage.
CH4and N2O Sampling and Measurements
CH4and N2O content was measured using the static
chamber-gas chromatography method [25]. The duration of chamber-gas sample collection was based on the diurnal variations in this region: the collection of CH4occurred from 9:00 a.m. to 10:00 a.m., and N2O
was collected between 9:00 a.m. and 12:00 p.m. from October 10, 2007, to May 19, 2009 at approximately 1-month intervals [26]. Both CH4and N2O were sampled at 5 minutes, 20 minutes and
35 minutes after chamber closing. Simultaneously, the atmospher-ic temperature, the temperature in the statatmospher-ic chamber, the land
Figure 1. The atmospheric temperature and precipitation at the experiment site. The data were collected by the agricultural meteorological station approximately 500 m from the experiment field.
doi:10.1371/journal.pone.0051206.g001
surface temperature and the soil temperature at a depth of 5 cm were determined after collecting samples.
The samples were measured using a Shimadzu GC-2010 gas chromatograph. CH4 was measured using a flame ionization
detector with a stainless steel chromatography column packed with a 5A molecular sieve (2 m long); the carrier gas was N2. The
temperatures of the column, injector and detector were 80uC, 100uC and 200uC, respectively. The total flow of the carrier gas was 30 ml min21, the H2flow was 40 ml min2
1
, and the airflow was 400 ml min21. N2O was measured using an electron capture
detector with a Porapak-Q chromatography column (4 m long); the carrier gas was also N2. The temperatures of the column,
injector and detector were 45uC, 100uC and 300uC, respectively. The total flow of the carrier gas was 40 ml min21, and the tail-blowing flow was 40 ml min21. The gas fluctuations were calculated by the gas concentration change in time per unit area. Emission changes in CH4and N2O were calculated using the
following formula [25]:
F~ 60
HMP
8:314(273zT) dc
dt
whereFis the change in gas emission or uptake (mg?m22?h21); 60
is the conversion coefficient of minutes and hours; H is the height (m); M is the molar mass of gas (g?mol21); P is the atmospheric pressure (Pa); 8.314 is the Ideal Gas Constant (J mol21K21); T is the average temperature in the static chamber (uC); anddc/dtis the line slope of the gas concentration change over time.
Figure 2. A to C CH4flux variations of H, R, and N after subsoiling in different periods; D to F N2O flux variations of H, R, and N after
subsoiling in different periods. ain Fig. 2 is the wheat growth stage of 2007 to 2008;bis the maize growth stage of 2008 to 2009; c is the wheat growth stage of 2008 to 2009. Arrows indicate time of subsoiling. Dotted lines distinguish the growth period of wheat and maize. * indicatesP,0.05 and **indicatesP,0.01 between subsoiling and the control.
doi:10.1371/journal.pone.0051206.g002
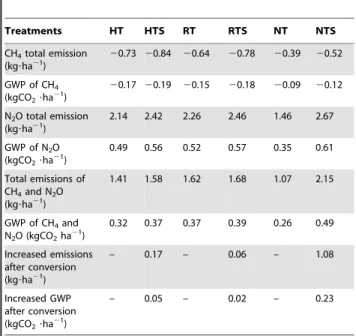
Table 1.GWP and total changes in CH4and N2O after
subsoiling (2008.10,2009.05).
Treatments HT HTS RT RTS NT NTS
CH4total emission
(kg?ha21) 2
0.73 20.84 20.64 20.78 20.39 20.52
GWP of CH4
(kgCO2?ha21)
20.17 20.19 20.15 20.18 20.09 20.12
N2O total emission
(kg?ha21) 2.14 2.42 2.26 2.46 1.46 2.67
GWP of N2O
(kgCO2?ha21)
0.49 0.56 0.52 0.57 0.35 0.61
Total emissions of CH4and N2O
(kg?ha21)
1.41 1.58 1.62 1.68 1.07 2.15
GWP of CH4and
N2O (kgCO2ha21)
0.32 0.37 0.37 0.39 0.26 0.49
Increased emissions after conversion (kg?ha21)
– 0.17 – 0.06 – 1.08
Increased GWP after conversion (kgCO2?ha21)
– 0.05 – 0.02 – 0.23
Total emissions of CH4and N2O (kg?ha21),N2O total emission flux added
CH4total emission flux;GWP of CH4and N2O (kgCO2?ha21),GWP of N2O
added GWP of CH4;Increased emissions after conversion (kg?ha21),
difference of total emission of CH4and N2O before and after conversion;
Increased GWP after conversion (kgCO2?ha21),difference of GWP of CH4
and N2O before and after conversion.
GWP of CH4and N2O
The global warming potentials (GWP) were determined by measuring CH4and N2O emissions. The GWP of CH4and N2O
are 25 and 298 times higher, respectively, than that of CO2(the
GWP of CO2is 1) [27] and are calculated as follows:
GWP CHð 4Þ~
TF CHð 4Þ|25
100
GWP Nð 2OÞ~
TF Nð 2OÞ|298
100
whereGWP(CH4)is the GWP of CH4(kg CO2ha2 1
);TF(CH4)is
the total uptake of CH4 (kg CO2 ha2 1
a21); 25 is the GWP coefficient of CH4; 100 is the time scale of climate change (a); GWP(N2O)is the GWP of N2O (kg CO2 ha2
1
);TF(N2O)is the
total emission of N2O (kg CO2ha2 1
a21); and 298 is the GWP coefficient of N2O.
Soil Factor Measurements
The meteorological data during the experiment were obtained from an agricultural weather station in the experimental area. To evaluate the relation between soil temperature and moisture and CH4and N2O emissions, we measured soil temperature at a depth
of 5 cm and the soil moisture in the 0–20 cm soil layers simultaneously using a soil temperature, moisture and electric conductivity instrument (WET brand, made in the UK) as the temperature and moisture data collection tool. The soil samples were collected using a soil sampler with five replicates in each different tillage treatment and were dried and triturated after mixing. This sample was used to determine the SOC, NH4+-N and
pH using the Potassium Dichromate Heating Method, the UV Colorimetric Method and the Potentiometry Method, respectively [28].
Grain Yield
The grain yield of winter wheat was sampled from the 1.5 m6
6 m portion in the central area of each plot.
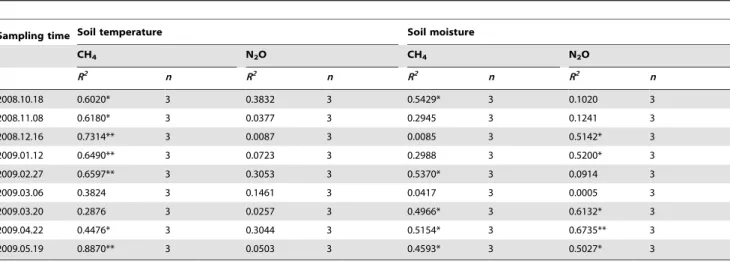
Table 2.Correlation analysis between changes in CH4and N2O with soil temperature and soil moisture per sampling time.
Sampling time Soil temperature Soil moisture
CH4 N2O CH4 N2O
R2 n R2 n R2 n R2 n
2008.10.18 0.6020* 3 0.3832 3 0.5429* 3 0.1020 3
2008.11.08 0.6180* 3 0.0377 3 0.2945 3 0.1241 3
2008.12.16 0.7314** 3 0.0087 3 0.0085 3 0.5142* 3
2009.01.12 0.6490** 3 0.0723 3 0.2988 3 0.5200* 3
2009.02.27 0.6597** 3 0.3053 3 0.5370* 3 0.0914 3
2009.03.06 0.3824 3 0.1461 3 0.0417 3 0.0005 3
2009.03.20 0.2876 3 0.0257 3 0.4966* 3 0.6132* 3
2009.04.22 0.4476* 3 0.3044 3 0.5154* 3 0.6735** 3
2009.05.19 0.8870** 3 0.0503 3 0.4593* 3 0.5027* 3
*P,0.05, **P,0.01.
doi:10.1371/journal.pone.0051206.t002
Figure 3. A Linear regression between the CH4uptake fluxes
and SOC, B Linear regression between the CH4uptake fluxes
and soil pH.Arrows indicate the regression equation between the CH4 uptake fluxes and soil organic carbon, soil pH. *indicatesP,0.05. doi:10.1371/journal.pone.0051206.g003
Statistical Analyses
The data were analyzed using analyses of variance and the SPSS 17.0 Statistical Analysis System and were mapped using Sigma Plot 10.0. The mean standard deviation and least significant difference were calculated for comparison of the treatment means.
Results
CH4and N2O
Differences in CH4flux were observed when converting from
HT to HTS, from RT to RTS and from NT to NTS (Figs. 2 A to
C). The soil absorption of CH4increased in different periods after
conversion to subsoiling compared with the control. The soil absorption of CH4increased from 13.53mg?m22?h21under HT
to 16.72mg?m22?h21under HTS, from 15.59mg?m22?h21under RT to 18.20mg?m22?h21under RTS and from 9.01mg?m22?h21
under NT to 11.36mg?m22?h21 under NTS, respectively.
However, N2O emission also increased after subsoiling (Fig. 2 D
to F), which increased from 49.07mg?m22?h21 under HT to
54.05mg?m22?h21 under HTS and from 47.49mg?m22?h21
under RT to 53.60mg?m22?h21 under RTS. Compared with
the above two treatments, however, the N2O emissions from the Figure 4. A Linear regression between the N2O emission fluxes and soil NH4+-N, B Linear regression between the N2O emission
soil after conversion to NTS increased significantly, from 30.92mg?m22?h21under NT to 55.15mg?m22?h21under NTS.
GWP of CH4and N2O
CH4 uptake increased under HTS, RTS and NTS;
conse-quently, the GWP of CH4decreased using these tilling methods
compared with HT, RT and NT. However, the GWP of N2O
increased under HTS, RTS and NTS (Table 1). Overall, therefore, the GWPs of the CH4 and N2O emissions taken
together increased from 0.32 kg CO2ha21under HT to 0.37 kg
CO2 ha21 under HTS, from 0.37 kg CO2 ha21 under RT to
0.39 kg CO2ha21under RTS and from 0.26 kg CO2ha21under
NT to 0.49 kg CO2ha21under NTS, respectively.
Correlation Analysis between CH4and N2O and Soil
Factors
Soil temperature significantly affected the CH4uptake in soils,
especially in lower (i.e., December, R2= 0.7314,P,0.01; January, R2= 0.6490,P,0.01; February, R2
= 0.6597, P,0.01) or higher (i.e., May, R2= 0.8870,P,0.01) temperatures (P,0.01) (Table 2). At other sampling times, however, temperature did not affect on CH4uptake, and soil moisture became a main influencing factor
on the absorption of CH4by the soils, especially in wet soil, such as
after rain (R2= 0.5154, P,0.05) and irrigation (R2
= 0.5154,
P,0.05), when CH4 absorption was significantly limited
(R2= 0.5429,P,0.05). Higher soil moisture generally promoted the emission of N2O (R2= 0.6735, P,0.01), but there was no
obvious correlation between soil temperature and N2O emissions.
In this study, SOC was also correlated with greater CH4uptake
(R2= 0.12,P,0.05) (Fig. 3 A), whereas higher soil pH limited its absorption in the soil (R2= 0.14,P,0.05) (Fig. 3 B).
The emission of N2O was correlated with higher soil NH4+-N
content (R2= 0.27, P,0.01) (Fig. 4 A), while, similar to CH4, a
higher pH in soil strongly limited the emission of N2O (R2= 0.38, P,0.01) (Fig. 4 B).
Variation of Soil Factors
The soil factors under HTS, RTS and NTS changed after subsoiling. The soil temperature at a depth of 5 cm rose under
HTS, RTS and NTS compared with the temperatures under HT, RT and NT (Fig. 5 A to C). Soil temperature variations followed atmospheric temperature changes, but the average soil tempera-ture during sampling period increased from 13.5uC under HT to 15.3uC under HTS, from 14.4uC under RT to 16.2uC under RTS and from 13.1uC under NT to 15.1uC under NTS, respectively. However, soil moisture decreased in the soil at 0–20 cm when converting to subsoiling that in the order of RTS.HTS.NTS (Fig. 5 D to F). The most obvious decrease, by 15.74%, occurred under the NTS treatment, while HTS and RTS decreased by 10.34% and 14.85%, respectively. The soil NH4+-N content
increased with subsoiling that was NTS.HTS.RTS. Moreover, two peaks occurring on October 18, 2008, and April 22, 2009 (Fig. 5 G to I), due to the application of nitrogenous base fertilizer and topdressing fertilizer.
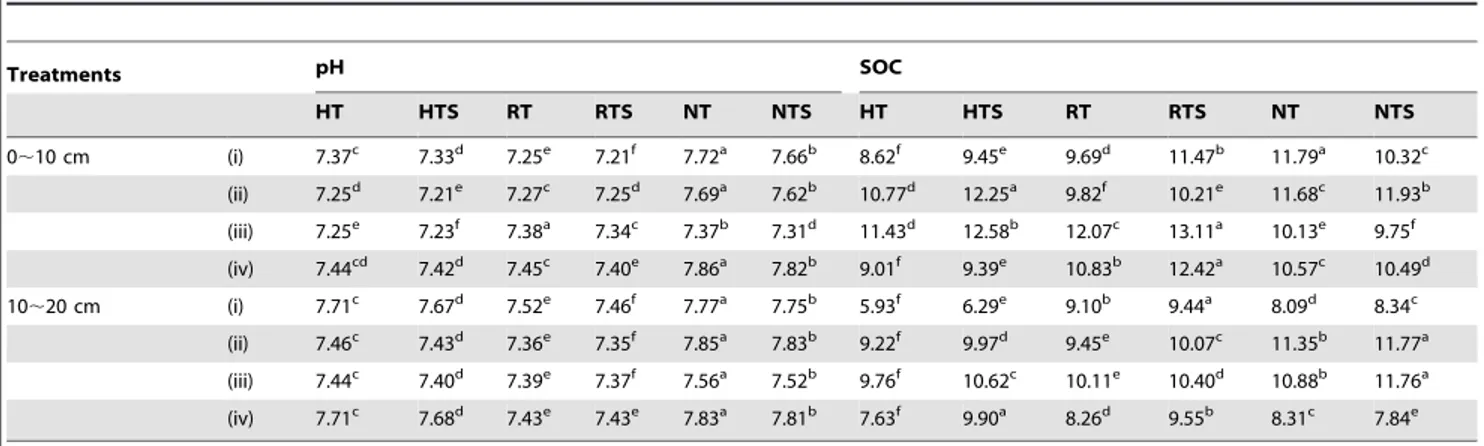
The CH4 uptake and N2O emission were correlated with the
content of soil pH and SOC (Table 3). The pH value decreased after conversions, but with the pH under the NTS treatment being higher than that of the HTS and RTS treatments not only at 0,10 cm but also at 10,20 cm. Conversely, SOC content
increased under HTS, RTS and NTS, with the highest values was under RTS, followed by NTS and then HTS. SOC was higher in the soil at 0–10 cm than at 10–20 cm.
Grain Yield
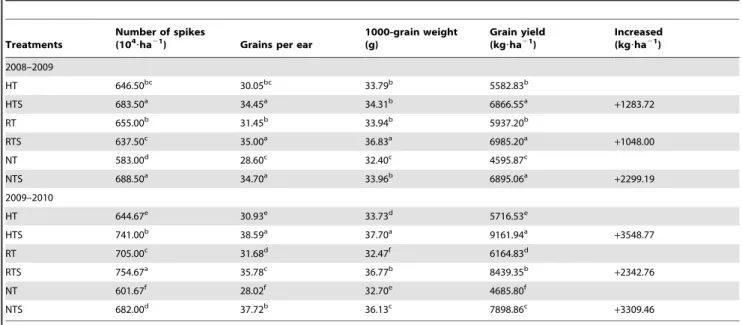
The highest wheat yields under RT were 5937.20 kg ha21in 2009 and 6164.83 kg ha21in 2010, which were only 3.8% greater than those under HT and NT (Table 4). However, the wheat yields under HTS, RTS and NTS improved significantly (P,0.01) than the control, not only in 2009 but also in 2010. The average yield of the two years increased by approximately 2416.25 kg ha21, 1695.38 kg ha21and 2804.33 kg ha21 with subsoiling compared with that under HT, RT and NT, respectively. The increases of average yield were not only related to the number of spikes, which increased by 596104ha21 after conversions as
determined by the average of the three conversion treatments, but were also correlated with the grains per ear and 1000-grain weight, which increased by an average of 6.0 grains and 2.8 g, respectively.
Figure 5. A to C Variation of Soil temperature at a 5 cm depth (uC) after subsoiling; D to F Variation of Soil water content at a 0,20 cm depth (%) after subsoiling; G to I Variation of Soil NH4+-N at a 0,20 cm depth (mg?kg21) after subsoiling.Arrows and the dotted line indicate time of subsoiling.
doi:10.1371/journal.pone.0051206.g005
Table 3.Soil pH and SOC variations after conversion to subsoiling.
Treatments pH SOC
HT HTS RT RTS NT NTS HT HTS RT RTS NT NTS
0,10 cm (i) 7.37c 7.33d 7.25e 7.21f 7.72a 7.66b 8.62f 9.45e 9.69d 11.47b 11.79a 10.32c
(ii) 7.25d 7.21e 7.27c 7.25d 7.69a 7.62b 10.77d 12.25a 9.82f 10.21e 11.68c 11.93b
(iii) 7.25e 7.23f 7.38a 7.34c 7.37b 7.31d 11.43d 12.58b 12.07c 13.11a 10.13e 9.75f
(iv) 7.44cd 7.42d 7.45c 7.40e 7.86a 7.82b 9.01f 9.39e 10.83b 12.42a 10.57c 10.49d
10,20 cm (i) 7.71c 7.67d 7.52e 7.46f 7.77a 7.75b 5.93f 6.29e 9.10b 9.44a 8.09d 8.34c
(ii) 7.46c 7.43d 7.36e 7.35f 7.85a 7.83b 9.22f 9.97d 9.45e 10.07c 11.35b 11.77a
(iii) 7.44c 7.40d 7.39e 7.37f 7.56a 7.52b 9.76f 10.62c 10.11e 10.40d 10.88b 11.76a
(iv) 7.71c 7.68d 7.43e 7.43e 7.83a 7.81b 7.63f 9.90a 8.26d 9.55b 8.31c 7.84e
Discussion
Effect of Conversion to Subsoiling on CH4Uptake and
N2O Emissions
Long periods of shallow or no-tillage have resulted in an increase in soil bulk density and compacted hardpan in this region, especially in the subsoil [29,30], while subsoiling changed the soil structure, allowing increased gas diffusion in the soil. In this study, soils under HT conversion to HTS, RT conversion to RTS and NT conversion to NTS increased CH4absorption and
strength-ened the sink capacity of the soils (Fig. 2 A to C); however, these conversions also promoted the emission of N2O (Fig. 2 D to F).
This increase may be due to changes in soil conditions as a result of conversion to tillage (Fig. 5). For example, the increase in CH4
absorption after conversion was mainly correlated with soil temperature, soil moisture, soil pH and SOC content according to the correlation analysis (Fig. 3 and Table 2), which is consistent with some previous studies [31–33]. A higher temperature and greater SOC may be advantageous to increasing the amount of CH4absorbed by the soil (Table 2, Fig. 3A) [34,35]. However, soil
moisture and pH were two limiting factors in our study (Table 2, Fig. 3B) that had negative effects on CH4absorption in the soils
[36].
At the same time, subsoiling would reduce subsoil compaction, and some have found improved permeability of soil to increased soil methane sinks [37] and higher bulk density to limit gas diffusion from the soil to the atmosphere, prolonging methane transfer pathways and thereby reducing CH4 and O2 diffusion
between the soil and the atmosphere [38]. Sometimes, although increased soil tillage may slightly decrease CH4uptake [39], this
effect is small and can be largely ignored [6,40].
The conditions for the aeration of the soil profile were reduced after irrigation [41,42] that increases emissions of the greenhouse gas N2O through denitrification in farmland [22], the N2O
emission peaks also coincided with higher moisture and NH4+-N
content in this study (Fig. 2 D to F, Table 2, Fig. 4A), the emissions of N2O were significantly affected by soil moisture and NH4+-N
content in each treatment. Some studies have indicated that there
is a significant linear relationship between N2O emissions and soil
moisture and nitrogenous fertilizer [21,22]. In addition, there was no significant correlation between N2O emission and soil
temperature in this study, and similar results were found by Koponen et al. [43]. In contrast, other studies found that at low temperatures, N2O emissions may be hindered by soil N and water
content [44,45]. However, in different experimental sites, N2O
emission was often related to increased soil temperature [46,47]. These studies demonstrated that when soil moisture and N fertilization were not limiting factors to N2O emission, the rate of
N2O emission increased as soil temperature increased [22].
Similarly, soil pH also influenced N2O production in soil
(Fig. 4B). N2 was mainly produced through denitrification when
the soil pH was neutral, and the N2O/N2ratio increased when soil
pH decreased [48]. In our study, when soil pH values decreased with irrigation, N2O emissions significantly increased, however,
there was no relation to N2O emission in periods of without
irrigation, so soil pH does not directly cause soil GHG emissions [36] but via affected the action of microbes [49]. On the other hand, the predominant form of nitrogen is NO3-N or NH4-N after
sufficient mixed between soil and straw through tillage, which may produced little N2O in soil, particularly near the soil surface, with
an important influence on N2O emissions [12].
Therefore, the CH4 uptake and N2O emissions under HTS,
RTS and NTS were higher than those under HT, RT and NT, respectively, due to the effect of subsoiling. Moreover, the emission differences of CH4and N2O between HTS, RTS and NTS were
largely due to the original tillage systems, because they had different background value of soil environment factors, these soil factors change extent after conversion highly affected on CH4and
N2O emissions among treatment in this study. Therefore, the
variations in CH4 uptake and N2O emissions correlated with
subsoiling are mainly due to alterations in soil conditions resulting from subsoiling, including soil temperature, moisture, NH4+-N,
SOC and pH.
Table 4.The wheat yield variations of HT, RT and NT after subsoiling from 2008–2010.
Treatments
Number of spikes (104?ha21
) Grains per ear
1000-grain weight (g)
Grain yield (kg?ha21
)
Increased (kg?ha21
)
2008–2009
HT 646.50bc 30.05bc 33.79b 5582.83b
HTS 683.50a 34.45a 34.31b 6866.55a
+1283.72
RT 655.00b 31.45b 33.94b 5937.20b
RTS 637.50c 35.00a 36.83a 6985.20a
+1048.00
NT 583.00d 28.60c 32.40c 4595.87c
NTS 688.50a 34.70a 33.96b 6895.06a
+2299.19 2009–2010
HT 644.67e 30.93e 33.73d 5716.53e
HTS 741.00b 38.59a 37.70a 9161.94a
+3548.77
RT 705.00c 31.68d 32.47f 6164.83d
RTS 754.67a 35.78c 36.77b 8439.35b
+2342.76
NT 601.67f 28.02f 32.70e 4685.80f
NTS 682.00d 37.72b 36.13c 7898.86c +3309.46
Different small letter meansP,0.05. doi:10.1371/journal.pone.0051206.t004
GWP of CH4and N2O after Conversion to Subsoiling
Although there was a negative effect on the GWP of N2O after
conversion to subsoiling, the increased CH4 absorption by soils
partially counteracted this negative effect. The total GWP of CH4
and N2O increased slightly compare with the original tillage
systems, especially under HTS and RTS (Table 1). Some previous studies reported that no-tillage is a better tillage system at mitigating GHG emissions [6,50], and the lowest GWP of CH4
and N2O was only measured under NT in this study. However,
the GWP of CH4and N2O would increase if NT was converted to
NTS.
Yield Variation after Conversion to Subsoiling
In this study, the fields where the HT, RT and NT methods were previously used showed only slight improvements in wheat grain yields between two years (Table 4), possibly due to the subsoil hardpan. However, under HTS, RTS and NTS, the number of spikes, grains per ear and 1000-grain weight significantly increased, which is in agreement with other reports in which subsoiling was found to be an effective method to increase wheat production [51–53].
Conclusions
Significant variations were measured in CH4 and N2O
emissions after conversion to subsoiling in the North China Plain. While the uptake of CH4 improved greatly, N2O emissions also
increased after subsoiling. As a result, we demonstrated that the GWP would increase if converted from minimum or no-tillage to subsoiling, especially from no-tillage. Soil temperature, moisture, SOC, NH4+-N and pH also varied and were strongly related to
CH4uptake and N2O emissions. In addition, the original tillage
systems had an important effect on soil factors and GWP variations after conversion to subsoiling. Therefore, the results of our study provide evidence that conversion from rotary tillage to subsoiling (RTS) or harrow tillage to subsoiling (HTS) had a lower GWP for CH4 and N2O compared with conversion from
no-tillage to subsoiling (NTS), while the grain yields under both RTS and HTS increase. Therefore, we suggest that these two rotation tillage systems be developed in this region.
Author Contributions
Conceived and designed the experiments: ST TN ZL HH SC. Performed the experiments: ST HZ BW NL. Analyzed the data: ST TN. Contributed reagents/materials/analysis tools: ST TN. Wrote the paper: ST TN.
References
1. Forster P, Ramaswamy V, Artaxo P, Berntsen T, Betts R, et al. (2007) Changes in atmospheric constituents and in radiative forcing. In: Solomon S, Qin D, Manning M, Chen Z, Marquis M, et al., eds. Climate Change 2007: The Physical science basis. Contribution of working group I to the fourth assessment report of the intergovernmental panel on climate change. Cambridge University Press, Cambridge, United Kingdom and New York, NY, USA.
2. Bouwman AF (1990) Exchange of greenhouse gases between terrestrial ecosystems and the atmosphere. In: Bouwman AF, eds. Soils and the Greenhouse Effect. Wiley, Chichester, pp. 61–127.
3. Goulding KWT, Hu¨tsch BW, Webster CP, Willison TW, Powlson DS (1995) The effect of agriculture on methane oxidation in the soil. Philip Transaction Royal Society London A 351: 313–325.
4. IPCC (2001) Climate change 2001, The scientific basis–contribution of work group I to the third assessment report of IPCC. Cambridge University Press, Cambridge.
5. Bruce CB, Albert S, John P, Parker (1999) Fields N2O, CO2and CH4fluxes in
relation to tillage, compaction and soil quality in Scotland. Soil and Tillage Research 53: 29–39.
6. Six J, Ogle SM, Breidt FJ, Conant RT, Mosier AR, et al. (2004) The potential to mitigate global warming with no-tillage management is only realized when practised in the long term. Global Change Biology 10: 155–160.
7. Lee J, Six J, King AP, Van Kessel C, Rolston DE (2006) Tillage and field scale controls on greenhouse gas emissions. Journal of Environment Quality 35: 714– 725.
8. Bhatia A, Sasmal S, Jain N, Pathak H, Kumar R, et al. (2010) Mitigating nitrous oxide emission from soil under conventional and no-tillage in wheat using nitrification inhibitors. Agriculture Ecosystem & Environtment 136: 247–253. 9. Zhang HL, Gao WS, Chen F, Zhu WS (2005) Prospects and present situation of
conservation tillage. Journal of China Agriculture University 10: 16–20. 10. Chatskikh D, Olesen JE (2007) Soil tillage enhanced CO2and N2O emissions
from loamy sand soil under spring barley. Soil and Tillage Research 97: 5–18. 11. Elder JW, Lal R (2008) Tillage effects on gaseous emissions from an intensively farmed organic soil in North Central Ohio. Soil and Tillage Research 98: 45–55. 12. Bai XL, Zhang HL, Chen F, Sun GF, Hu Q, et al. (2010) Tillage effects on CH4
and N2O emission from double cropping paddy field. Transactions of the CSAE
26: 282–289.
13. Xu YC, Shen QR, Ran W (2002) Effects of no-tillage and application of manure on soil microbial biomass C, N, and P after sixteen years of cropping. Acta Pedologica Sinica 39: 89–96.
14. Bowen HD (1981) Alleviating mechanical impedance. In: Arkin GF, Taylor HM, eds. Modifying the Root Environment to Reduce Crop Stress. Published by the ASAE. St. Joseph, MI, pp. 21–57.
15. Balbuena HR, Aragon A, McDonagh P, Claverie J, Terminiello A (1998) Effect of three different tillage systems on penetration resistance and bulk density. In: Proceedings of the IV CADIR (Argentine Congress on Agricultural Engineer-ing), vol. 1. pp.197–202.
16. Huang M, Li YJ, Wu JZ, Chen MC, Sun JK (2006) Effects of subsoiling and mulch tillage on soil properties and grain yield of winter wheat. Journal of Henan University Science and Technology 27: 74–77.
17. Qin HL, Gao WS, Ma YC, Ma L, Yin CM (2008) Effects of Subsoiling on Soil Moisture under No-tillage 2 Years Later. Science of Agriculture Sinica 41: 78– 85.
18. Bradford MA, Ineson P, Wookey PA (2001) Role of CH4oxidation, production
and transport in forest soil CH4flux. Soil Biology & Biochemistry 33: 1625–163.
19. Watanabe T, Kimura M, Asakawa S (2007) Dynamics of methanogenic archaeal communities based on rRNA analysis and their relation to methanogenic activity in Japanese paddy field soils. Soil Biology & Biochemistry 39: 2877–2887. 20. Zheng XH, Wang MX, Wang Y, She R, Shangguan X, et al. (1997) CH4and
N2O emissions from rice paddy fields in Southeast China. Scientia atmospherica
Sinica 21: 231–237.
21. Merino P, Artetxe A, Castellon A, Menendez S, Aizpurua A, et al. (2012) Warming potential of N2O emissions from rapeseed crop in Northern Spain.
Soil & Tillage Research, 123: 29–34.
22. Gregorich EG, Rochette P, Vandenbygart AJ, Angers DA (2005) Greenhouse gas contributions of agricultural soils and potential mitigation practices in Eastern Canada. Soil and Tillage Research 83: 53–72.
23. Clayton H, Arah JRM, Smith KA (1994) Measurement of nitrous oxide emissions from fertilised grassland using closed chambers. Journal of Geophys-ical Research 99: 16599–16607.
24. Paustian K, Andren O, Janzen HH, Lal R, Smith P, et al. (1997) Agricultural soil as a C sink to offset CO2emissions. Soil Use and Management 13: 230–244.
25. Robertson G (1993) Fluxes of nitrous oxide and other nitrogen trace gases from intensively managed landscapes: a global perspective. In: Harpwr LA, Mosier AR, Duxbury JM, Rolston DE, (eds) Agricultural ecosystem effects on trace gases and global climate change. ASA Special Publication No. 55. ASA, CSSA, SSSA, Madison, wi 95–108.
26. Tian SZ, Ning TY, Chi SY, Wang Y, Wang BW, et al. (2012) Diurnal variations of the greenhouse gases emission and their optimal observation duration under different tillage systems. Acta. Ecol. Sinica. 32, 879–888.
27. IPCC (2007) Climate change 2007: The physical science basis. Contribution of working group I to the fourth assessment report of the intergovernmental panel on climate change. Cambridge University Press, Cambridge, United Kingdom and New York, NY, USA.
28. Bao SD (2000) Soil and Agricultural Chemistry Analysis. China Agriculture Press, Beijing.
29. Han B, Li ZJ, Wang Y, Ning TY, Zheng YH, et al. (2007) Effects of soil tillage and returning straw to soil on wheat growth status and yield. Transactions of the CSAE 23: 48–53.
30. Ahmad S, Li C, Dai G, Zhan M, Wang J, et al. (2009) Greenhouse gas emission from direct seeding paddy field under different rice tillage systems in central China. Soil and Tillage Research 106: 54–61.
31. Qi YC, Dong YS, Zhang S (2002) Methane fluxes of typical agricultural soil in the north china plain. Rural Ecology Environment 18: 56–60.
32. Wu FL, Zhang HL, Li L, Chen F, Huang FQ, et al. (2008) Characteristics of CH4Emission and Greenhouse Effects in Double Paddy Soil with Conservation
Tillage. Science Agriculture Sinica 419: 2703–2709.
33. Dijkstra FA, Morgan JA, von Fischer JC, Follett RF (2011) Elevated CO2and
warming effects on CH4uptake in a semiarid grassland below optimum soil
34. Wang ZP, Han XG, Li LH (2005) Methane emission from small wetlands and implications for semiarid region budgets. Journal of Geophysical Research 110(D13): Art. No. D13304.
35. Bayer CL, Gomes J, Vieira FCB, Zanatta JA, Piccolo MC, et al. (2012) Methane emission from soil under long-term no-till cropping systems. Soil & Tillage Research, 124: 1–7.
36. Ouyang XJ, Zhou GY, Huang ZL, Peng SJ, Liu JX, et al. (2005) The incubation experiment studies on the influence of soil acidification on greenhouse gases emission. China Environment Science 25: 465–470.
37. Dong YH, Ou YZ (2005) Effects of organic manures on CO2and CH4fluxes of
farmland. Chinese Journal of Applied Ecology 16: 1303–1307.
38. Ball BC, Scott A, Parker JP (1999) Field N2O, CO2and CH4fluxes in relation to
tillage, compaction and soil quality in Scotland. Soil and Tillage Research 53: 29–39.
39. Hu¨tsch BW (1998) Tillage and land use effects on methane oxidation rates and their vertical profiles in soil. Biology and Fertilizer of Soils 27: 284–292. 40. Robertson GP, Paul EA, Harwood RR (2000) Greenhouse gases in intensive
agriculture: Contributions of individual gases to the radiative forcing of the atmosphere. Science 289: 1922–1925.
41. Czyz EA (2004) Effects of traffic on soil aeration, bulk density and growth of spring barley. Soil & Tillage Research. 79, 153–166.
42. Berisso FE, Schjønning P, Keller T, Lamande M, Etana A, et al. (2012) Persistent effects of subsoil compaction on pore size distribution and gas transport in a loamy soil. Soil & Tillage Research 122: 41–45.
43. Koponen HT, Flojt L, Martikainen PJ (2004) Nitrous oxide emissions from agricultural soils at low temperatures: a laboratory microcosm study. Soil Biology & Biochemistry 36: 757–766.
44. Conen F, Dobbie KE, Smith KA (2000) Predicting N2O emissions from
agricultural land through related soil parameters. Global Change Biology 6: 417–426.
45. Sehy U, Ruser R, Munch J C (2003) Nitrous oxide fluxes from maize fields: relationship to yield, site-specific fertilization, and soil conditions. Agriculture Ecosystem & Environment 99: 97–111.
46. Groffman PM, Hardy JP, Driscoll CT, Fahey TJ (2006) Snow depth, soil freezing, and fluxes of carbon dioxide, nitrous oxide and methane in a northern hardwood forest. Global Change Biology 12: 1748–1760.
47. Rachhpal S, Jassal T, Andrew B, Real R, Gilbert E (2011) Effect of nitrogen fertilization on soil CH4 and N2O fluxes, and soil and bole respiration.
Geoderma 162: 182–186.
48. Daum N, Schenk MK (1998) Influence of nutrient solution pH on N2O and N2
emissions from a soilless culture system. Plant and Soil 203: 279–287. 49. Robertson LA, Kuenen JG (1991) Physiology of nitrifying and denitrifying
bacteria. In: Rogers JE and Whitman WBC, (eds) Microbial production and consumption of greenhouse gases: Methane, Nitrogan oxides and Halo methane. American Society for microbiology Washington D. C., 189–199.
50. Lal R (2004b) Soil carbon sequestration impacts on global climate change and food security. Science 304: 1623–1627.
51. He J, Li HW, Gao HW (2006) Subsoiling effect and economic benefit under conservation tillage mode in Northern China. Transactions of the CSAE 22: 62– 67.
52. Gong XJ, Qian CR, Yu Y, Zhao Y, Jiang YB, et al. (2009) Effects of Subsoiling and No-tillage on Soil Physical Characters and Corn Yield. Journal of Maize Science 17: 134–137.
53. Huang M, Wu JZ, Li YJ, Yao YQ, Zhang CJ, et al. (2009) Effects of different tillage management on production and yield of winter wheat in dryland. Transactions of the CSAE 25: 50–54.