Proceedings IRG Annual Meeting (ISSN 2000-8953)
© 2019 The International Research Group on Wood Protection
IRG/WP 19-20650
THE INTERNATIONAL RESEARCH GROUP ON WOOD PROTECTION Section 2 Test Methodology and Assessment
Validation by micro-computed tomography of an assessment
method to measure the residual strength of anobiids infested timber
João L. Parracha1,2, Manuel F. Pereira3, António Maurício3, Paulina Faria1,4, Lina Nunes1,5
1LNEC, National Laboratory for Civil Engineering, Structures Department,
Av. do Brasil, 101, 1700-066 Lisbon, Portugal
2FCT-NOVA, Faculty of Science and Technology, New University of Lisbon,
2829-516, Caparica, Portugal
3CERENA, Centro de Recursos Naturais e Ambiente, Instituto Superior Técnico,
University of Lisbon, 1049-001, Lisbon, Portugal
4CERIS, Civil Engineering Research and Innovation for Sustainability, Instituto Superior Técnico,
University of Lisbon, 1049-001, Lisbon, Portugal
5CE3C, Centre for Ecology, Evolution and Environmental Changes, Azorean Biodiversity Group,
University of Azores, 9700-042, Angra do Heroísmo, Azores, Portugal
Paper prepared for the IRG50 Scientific Conference on Wood Protection Quebec City, Quebec, Canada
12-16 May 2019 IRG SECRETARIAT Box 5604 SE-114 86 Stockholm Sweden www.irg-wp.co Disclaimer
The opinions expressed in this document are those of the author(s) and are not necessarily the opinions or policy of the IRG Organization.
Validation by micro-computed tomography of an assessment method to
measure the residual strength of anobiids infested timber
João L. Parracha1,2, Manuel F. Pereira3, António Maurício3, Paulina Faria1,4, Lina Nunes1,5
1 LNEC, National Laboratory for Civil Engineering, Structures Department,
Av. do Brasil, 101, 1700-066 Lisbon, Portugal, j.parracha@campus.fct.unl.pt ; linanunes@lnec.pt
2 FCT-NOVA, Faculty of Science and Technology, New University of Lisbon,
2829-516, Caparica, Portugal, mpr@fct.unl.pt
3 CERENA, Centro de Recursos Naturais e Ambiente, Instituto Superior Técnico,
University of Lisbon, 1049-001 Lisbon, Portugal, mfct@tecnico.ulisboa.pt ; pcd2045@ist.utl.pt
4CERIS, Civil Engineering Research and Innovation for Sustainability, Instituto Superior Técnico,
University of Lisbon, 1049-001 Lisbon, Portugal
5CE3C, Centre for Ecology, Evolution and Environmental Changes, Azorean Biodiversity Group,
University of Azores, 9700-042, Angra do Heroísmo, Azores, Portugal
ABSTRACT
In this article a quantitative correlation study of pine timber structural elements, which have been subject to attack by anobiids, is presented. The main objective of the study was to establish a valid empirical correlation between the lost material percentage (consumed by beetles) and original/residual apparent density. Since the beetles’ attack produces a diffuse damage with a set of tunnels in random directions and sizes, this makes quantification more difficult. Micro-computed tomography (μ-XCT) was used to enable better assessment of material degradation state by quantifying the loss of density as this parameter is highly correlated with mechanical properties of timbers and thus central for the assessment. The results showed an experimental high correlation (r2=0.60) between original apparent density and lost material percentage and an even higher correlation (r2=0.83) between residual apparent density and lost material percentage. The results confirm the applicability of μ-XCT to define the relevant parameters for anobiid damage being this knowledge of fundamental importance for future validation of relevant non-destructive and semi-destructive techniques. After the μ-XCT study, screw withdrawal and shear parallel to the grain tests have been made in pine degraded timber. Screw withdrawal force and shear strength values were related with density loss (r2=0.82 for screw withdrawal; r2=0.78 for shear strength parallel to grain). A novel assessment method for evaluating the impact of anobiid damage on timber degraded structural elements based in four major steps is proposed enabling a more quantitative assessment of the structural soundness of the remaining timber.
Keywords: anobiids infestation, micro-computed tomography, density loss, damage assessment, in situ screw withdrawal
1. INTRODUCTION
Timber has been used in the construction industry over the years being known as one of the oldest construction materials. However, due to its biological origin, this natural material is susceptible to biodeterioration, which is frequently caused by agents like fungi and insects (Eaton and Hale
3
1993). In temperate countries, like Portugal and other Mediterranean countries, the insects that cause most problems to timber structures are termites (Blattodea, Termitoidae) or wood boring beetles (Coleoptera) of which several representatives of the anobiid family play a major role in the deterioration problems of older or antique structures. These beetles’ attack is normally limited to sapwood though with some exceptions (EN 350, 2016) and the damage caused is easily recognizable on the outside from the size and the shape of the emergency holes and the type of frass (Bravery et al. 1992).
A structural assessment is certainly required in cases of insect damage and actions must be taken to guarantee an adequate safety level. The correct identification of the responsible insects is essential to better set up valid diagnosis and remediation strategies. Nevertheless, due to a diffuse damage created by these insects with a set of tunnels starting and developing in more or less random places and directions, the assessment of the structural soundness of the remaining timber becomes more difficult. The damage caused by anobiids is a usual justification for partial or complete replacement of structures since it is difficult to assess the structural soundness of the remaining timber (Cruz et al. 2015). However, degraded structural elements are often wrongly assessed as not having any residual strength and thus replaced. Most of the times happen that there is no need to remove or replace those elements since the structural safety is still guaranteed or can be achieved with selective strengthening (Nunes et al. 2019).
In structures with historical interest, the replacement approach is not ideal since it is frequently very difficult to remove and replace by similar timber the structural degraded elements without cultural loss. In this case, normally, the effect of anobiids’ attack is considered by assuming a significantly reduced timber cross section or reduced mechanical properties for that cross sections (Cruz and Machado 2013). This may although be too conservative, as even the insect damaged-layer can often be able to resist load.
Several studies have been made (e.g. Cruz and Machado 2013, Gilfillan and Gilbert 2001, Nunes et al. 2019) with the objective to evaluate the impact of anobiid damage on timber structures. However, the degradation intensity on the structure was mostly inferred from an examination of the surface appearance. This visual approach is not completely representative of the real degradation state as the intensity of the internal holes tends to be much greater than that on the surface (Gilfillan and Gilbert 2001). Then, it is important to know the percentage of lost material (consumed by beetles) as well as the loss of density, in order to conclude on structural safety. Knowledge of timber original and residual apparent density is of fundamental importance to assess timber soundness as these parameters are highly correlated with timbers mechanical properties. Micro-computed tomography (μ-XCT) was used as a 3D microscope to assess the anobiids’ tunnelling process result (visualizing its spatial distribution and morphology) and calculate void’s volume (lost material). By knowing this percentage of lost material, the loss of density can be estimated. After that, the loss of density can be correlated with timber mechanical properties via screw withdrawal and shear parallel to the grain tests enabling a valid quantitative assessment of the timber elements residual strength and, therefore, contributing to reduce unnecessary replacement, to boost eco-efficient interventions and to provide foundations required to perform experimental modelling tests.
The use of computed tomography (CT) has been increasing in recent years with the study of different materials where non-destructive analysis is warranted. In the case of wood, several studies have been carried out recently. Fuchs et al. 2014, Himmi et al. 2014, Kigawa et al. 2009 used CT to detect termite or beetle damage in wood. Watanabe et al. 2015 used CT to observe the boring process inside infested bamboo specimens while Charles et al. 2018 used CT to quantify voids created by shipworms. Despite this, the use of CT has not reached its full potential, as
4
researchers are often unfamiliar with the methodology and the technique itself (du Plessis et al. 2017).
This paper is separated into two parts. In the first, the main objective was to evaluate the impact of anobiid damage on pine timber structures by establishing a correlation between lost material percentage (obtained using μ-XCT) and original/residual apparent density. The second part aimed at developing a method for an in situ assessment of infested timber structural elements based on a screw withdrawal test. A further objective is to improve the efficiency and applicability of μ-XCT for the study of wood by describing and presenting the various steps required during the study. 2. EXPERIMENTAL PROGRAMME
2.1 Sampling
Timber samples used in this study came from a beam of maritime pine (Pinus pinaster Aiton) retrieved from a mid-20th century roof structure of a residential building located in Lisbon, Portugal. It should be noted that maritime pine continues to be one of the major sources of wood in Portugal. The beam presented varying degrees of infestation restricted to the sapwood and mainly caused by insects identified as anobiids (Coleoptera, Anobiidae). Furthermore, frass characteristics as well as the size of tunnels and the presence of cocoons inside the wood allowed the identification of Nicobium castaneum Olivier has the main species responsible for the degradation, although the presence of other anobiid species cannot be excluded.
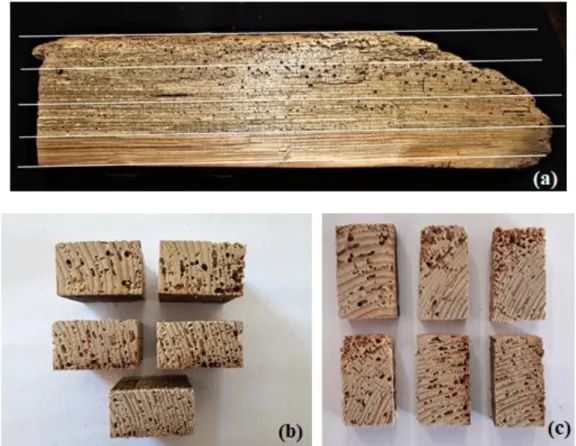
The beam was then divided in 4 segments (3 presenting degradation and the heartwood (Fig. 1a) and 17 samples of approximately 40 × 20 × 40 mm3 were cut (Fig 1b). After that, and because these initial samples cannot be submitted to a procedure like micro-computed tomography due to their relatively large size, samples were cut again in order to obtain 17 “new” paired samples with approximately 40 × 20 × 10 mm3 (Fig 1c).
5
Figure 1: Sampling: (a) timber beam initially divided in 4 segments; (b) some of the 17 samples resulting from the first cut of the beam (samples approximately 40 × 20 × 40 mm3) and (c) some of the 17 “new”
paired samples resulting from the second cutting process (samples approximately 40 × 20 × 10 mm3).
All the samples were conditioned in a climatic room at a temperature of 20±2ºC and a relative humidity (RH) of 65±5% and maintained in this condition until required for mechanical testing of micro-computed tomography scanning procedure (EN 408, 2010).
2.2 Micro-computed tomography study
Micro-computed tomography (μ-XCT) study follows a general process with the application of the following major steps: 1) representative sample preparation/selection; 2) acquisition process; 3) reconstruction process; 4) rendering; 5) analysis of the results (quantitative/qualitative) and 6) interpretation of such results.
The samples were scanned using a compact desktop with micrometric range resolution, μ-XCT Skyscan 1172 microtomograph (Bruker Instruments, Inc., Billerica, Massachustets), using computer-controlled tomography acquisition, processing, reconstruction and analysis software packages (http://bruker-microct.com/products/1172.htm).
The parameters used in the scanning procedure (acquisition) were optimised considering the studied material, the maximum possible resolution (18.09 μm) for the selected samples and the required output parameters (wood – skeleton and voids – empty spaces). Concerning the acquisition process, the best choice of the scanner settings is of fundamental importance since this choice affect substantially image quality. Therefore, these settings must be selected considering the aim of the problem to be studied and the physical, geometrical and operating constraints of the scanner. In this study, the voltage selected for the X-ray source was 60 kV and an aluminium filter with a tick of 0.5 mm was used. The X-ray source was operated at 165 μA and the samples were image through 180 degrees of rotation at 0.7-degree increment’ steps. The total acquisition time
6
for each sample was approximately 1.5 h with a total of 288 acquired images. These acquisition parameters were applied to the study of all 17 samples.
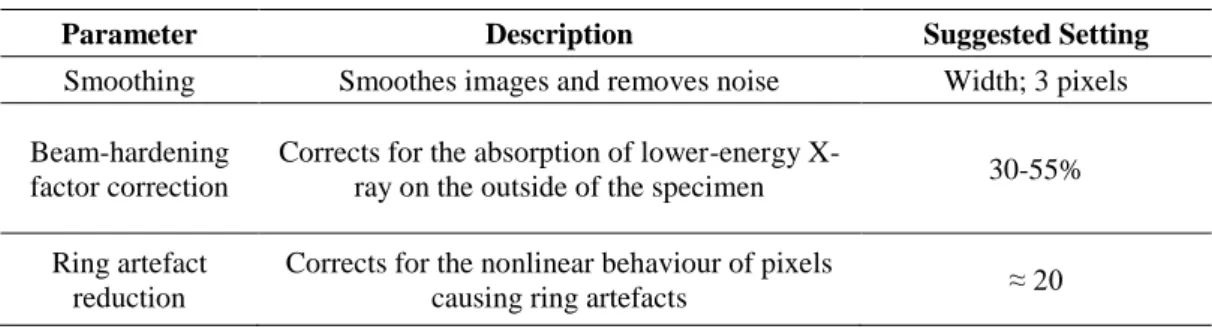
Reconstruction process follows the scanning procedure (acquisition) and here the 3D volume is reconstructed from the 2D digital radiography image stacks previously acquired. For the reconstruction process, the NRecon software from Bruker was used. Table 1 presents the reconstruction parameters used in this study that were applied for the reconstruction of all studied samples. At the end of reconstruction process, it was possible to visualize the 3D object using a visualization program (e.g. CTVox software, provided by Bruker) (Fig. 2).
Table 1: Reconstruction parameters adopted using NRecon software.
Parameter Description Suggested Setting
Smoothing Smoothes images and removes noise Width; 3 pixels Beam-hardening
factor correction
Corrects for the absorption of lower-energy
X-ray on the outside of the specimen 30-55% Ring artefact
reduction
Corrects for the nonlinear behaviour of pixels
causing ring artefacts ≈ 20
After the reconstruction procedure, the images can be finally analysed and parametrized to obtain quantitative information (the values of the parameters of interest – wood and voids). This process is highly dependent on the software used as well as the experience of the operator. For this study, CTAn software from Bruker was used in complementary with ImageJ software (https://imagej.nih.gov/ij/), provided by NIH, for image processing and calculation. In this case study, the segmentation step is one of the most important imaging treatments to be performed in this phase and consists in validly transforming the original images (obtained after reconstruction), in a scale of 256 grey levels, into simpler binary images (Fig. 3). These images are used to separate the parameters of interest for the subsequent calculation process. For this reason, this step must be carried out with a special attention, so that the study is not misrepresented, mistaking, for example, wood with voids or voids with noise, inevitably created during the acquisition and reconstruction procedures.
7
Figure 2: Reconstructed 3D object. Visualization using CTVox software.
Figure 3: Images of the various steps related with μ-XCT methodology: (a) scanning procedure (acquisition); (b) after reconstruction process; (c) analysis – binary image and (d) binary treated image
ready for calculation.
2.3 Data analysis
The output parameters are exported from CTAn software in a form of a txt file. In this file, among the various output parameters values that can be estimated, two of them can be highlighted: total volume, referring to the volume of the sample (wood and voids) and wood volume, relating to the wood itself (skeleton). These parameters correspond to those of interest previously defined, as voids volume will correspond to the difference between total volume and wood volume. Wood apparent density was assessed at 12% moisture content according to ISO 13061-1 (2014). Original apparent density is obtained by Eq. 1.
8 𝜌𝑜𝑟𝑖𝑔𝑖𝑛𝑎𝑙 = 𝑚
𝑤𝑣 (1)
Residual apparent density is obtained by Eq. 2. 𝜌𝑟𝑒𝑠𝑖𝑑𝑢𝑎𝑙 = 𝑚
𝑡𝑣 (2)
In Eq. 1 and 2, 𝑚 indicates the sample weigh, in kg and 𝑤𝑣 and 𝑡𝑣, in m3, represent the wood volume and the total volume, respectively.
Statistical analysis was performed using R studio, version 3.5.0 (The R Foundation for Statistical Computing). The interpretation of the coefficients of determination (r2) was made according with the principle adopted by the Joint Committee on Structural Safety for the coefficient of correlation (r). The following interpretation was adopted: 0.8 ≤ r (high); 0.6 ≤ r < 0.8 (medium); 0.4 ≤ r < 0.6 (low); 0.2 ≤ r < 0.4 (very low) and; 0 ≤ r < 0.2 (no correlation).
2.3 Methods
2.3.1 Screw withdrawal perpendicular to grain
Screw withdrawal tests were carried out considering the method specified in EN 1382 (2000) and conducted in a universal testing machine (Schimazu AG-250KNIS-MO), capable of measuring the load applied with an accuracy of 1% in the range 1kN to 250 kN. A metal screw with an outer diameter of 6 mm and a length of 60 mm was used. The screw was inserted in the direction perpendicular to the grain and no distinction was made between the radial and tangential directions since the results do not differ significantly (Gilfillan and Gilbert, 2001).
In this study, four screw withdrawal tests were performed at four different places of the beam before the first cutting process. The tests were carried out in an attempt to reproduce in situ conditions since the final objective of this research study is to enable the use of this semi-destructive tests to estimate the loss of density on timber structural elements cause by anobiids infestation. Before measurements, a pre-drilled hole of 4 mm in diameter was made and the penetration length of the screws was 20 mm to enable a comparative profile of strengths at a range of depths. The samples that were submitted to μ-XCT and those that were tested to shear parallel to the grain, due to their relatively small size, cannot be submitted to a semi-destructive test such as is the case of the screw withdrawal test. Therefore, the timber places along the beam where the screw withdrawal test was performed were not used in samples that would be submitted to μ-XCT scanning procedure or shear tests.
2.3.2 Shear parallel to grain
Shear parallel to the grain tests were performed according to EN 408 (2010) and were conducted under deformation-control at a rate of 1 mm min-1 in a universal testing machine (Schimadzu), with a load cell of 250 kN. The machine can measure the applied load with an accuracy of 1% in the range of 1 kN to 250 kN. Shear strength parallel to the grain corresponded to the maximum load attained on 40 × 20 × 30 mm3. The load was applied at a constant rate so that the maximum load was attained in the interval 300 ± 120 seconds.
9 𝑓𝑣 =
𝐹𝑚𝑎𝑥 × cos (14°)
𝑙 × 𝑏 (4)
in which 𝑓𝑣 is the shear strength parallel to the grain (N/mm2), 𝐹𝑚𝑎𝑥 is the maximum shear load (N) and 𝑙 × 𝑏 is the influence area (mm2). The test was performed in nine samples (three samples for each three proposed degradation level). The glue used in these tests was an epoxy glue Araldite® with a maximum tension strength of 320 kg/cm2 in 48 hours.
3. RESULTS AND DISCUSSION 3.1 Micro-computed tomography
As stated before, after the reconstruction process, it is possible to visualize the acquired reconstructed-rendered object model perspective images using a visualization program (i.e. CTVox software, provided by Bruker) (Fig. 2 and 3). This visualization is very important during the μ-XCT study. The final 2D binary treated images stacks must be used to reconstruct a 3D volume before the calculation procedure. This volume must be compared with the first object acquired (after the reconstruction process) to ensure that the study was not misrepresented during the application of the various μ-XCT methodology inherent steps.
According to the results obtained using micro-computed tomography (parameters of interest), the samples were distributed over three levels of degradation: level 1 (< 10% lost material); level 2 (10 to 20% of lost material); level 3 (>20% lost material). A Shapiro-Wilk test has confirmed the normality of the results (p-value = 0.276). In Table 2 the obtained results are presented.
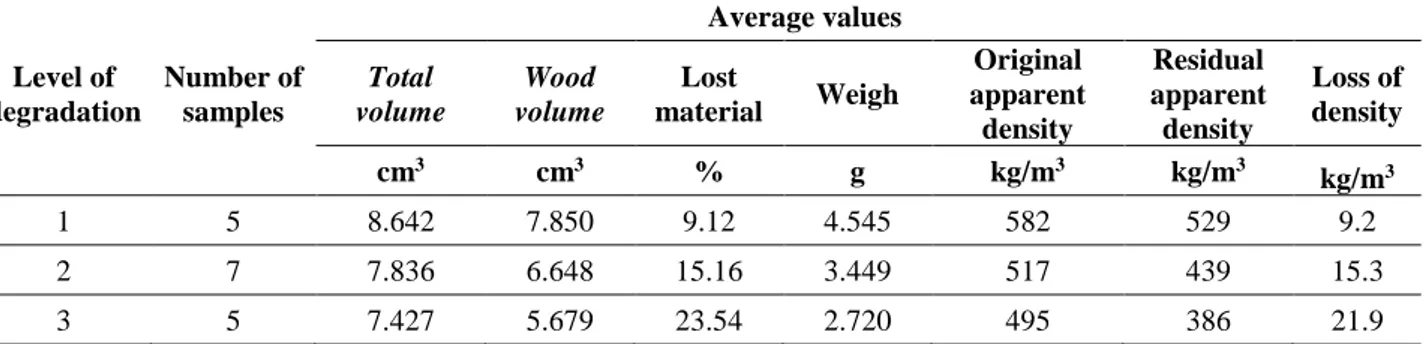
Table 2: Output parameters’ values, sample weigh and apparent densities per level of degradation.
Average values Level of degradation Number of samples Total volume Wood volume Lost material Weigh Original apparent density Residual apparent density Loss of density cm3 cm3 % g kg/m3 kg/m3 kg/m3 1 5 8.642 7.850 9.12 4.545 582 529 9.2 2 7 7.836 6.648 15.16 3.449 517 439 15.3 3 5 7.427 5.679 23.54 2.720 495 386 21.9
The obtained results for apparent densities (original and residual) decrease with increasing percentage of lost material, as expected. With regards to the proposed level definition, the highest density loss occurred for level 3, with a loss of 21.9 ± 1.4%. For levels 1 and 2, the loss of density was 9.2 ± 0.64 % and 15.3 ± 3.5 %, respectively. Considering all samples, it was obtained an average loss of density of 80 ± 24 kg/m3 (15.4 ± 5.5%), an average original theoretical density of 529±53 kg/m3 and an average residual density of 449 ± 70 kg/m3.
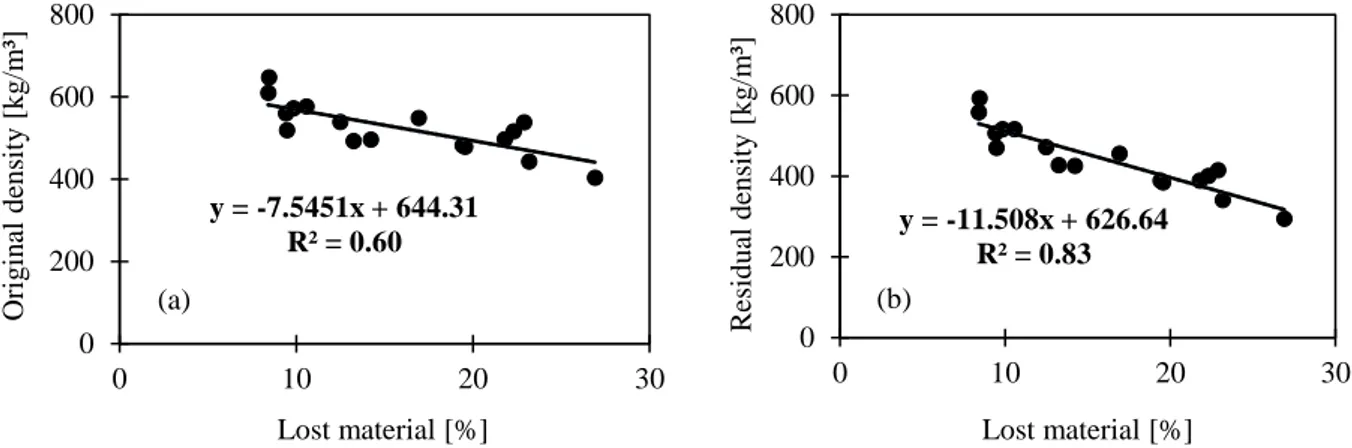
The obtained results indicate a medium correlation (r2 = 0.60) between lost material percentage and original timber density, which becomes higher (r2 = 0.83) when comparing lost material percentage and residual density (Fig.4). The results show that the higher the density, the lower the percentage of lost material, as expected. The obtained results suggest it is very likely that timber density is a determinant of the quality of timber but also supports the claim that μ-XCT methodology was well applied in this research study.
10
Figure 4: Correlation between original apparent density and lost material percentage (a) and residual apparent density and lost material percentage (b).
3.2 Screw withdrawal perpendicular to grain
The average results obtained for screw withdrawal perpendicular to the grain are lower than those observed in previous studies (Gilfillan and Gilbert, 2001; Nunes et al., 2019). However, the level of deterioration caused on timber by the beetles seem visually to be much higher. The values of C.V are relatively large which can be explained by the differences found in the level of degradation along the beam. The results are presented in Table 3, where CV is the coefficient of variation. Table 3: Screw withdrawal test results.
Parameter
Values
Average (μ) Minimum Maximum Standard deviation (σ) C.V (%)
Fmáx [kN] 0.46 0.28 0.69 0.19
41.7
f [N/mm2] 6.62 3.99 9.86 2.76
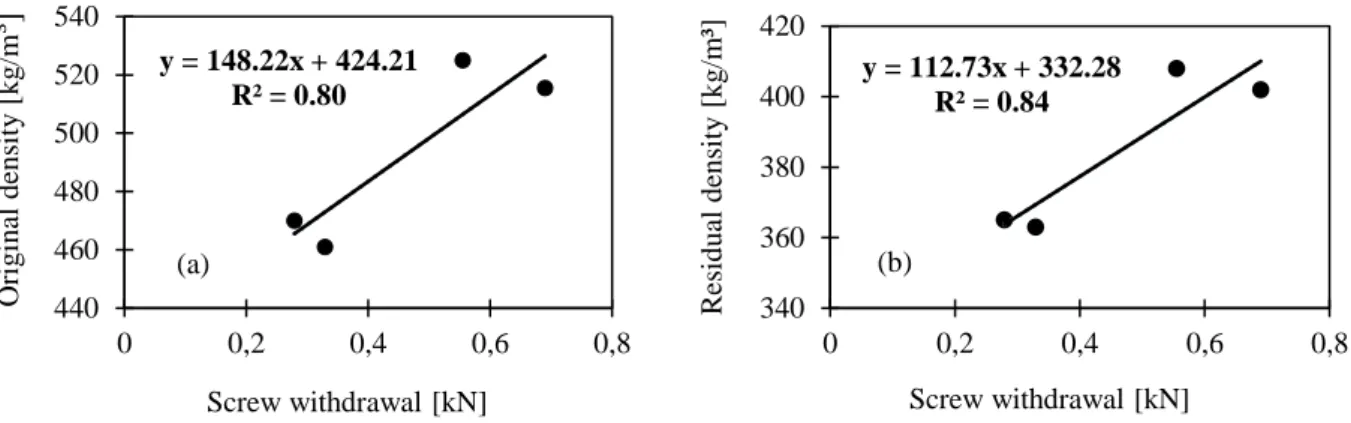
The Fig. 5 shows the obtained correlations between densities (original and residual) and the screw withdrawal forces. It should be noted that the four places along the beam where the screw withdrawal tests were performed, were not submitted to μ-XCT or shear tests, as previously stated. So, the real density values for that particular test places is still unknown. This, however, is not a substantial problem, since the values used in the correlations of Fig. 5 are those that have been estimated for the samples near the screw withdrawal test site.
The results show a high correlation (r2 = 0.80) for original density and an even higher correlation (𝑟2 = 0.84) for residual density (Fig. 5). As is to be expected, higher values of density lead to greater values of screw withdrawal forces.
y = -7.5451x + 644.31 R² = 0.60 0 200 400 600 800 0 10 20 30 Or ig in al d en sity [ k g /m ³] Lost material [%] y = -11.508x + 626.64 R² = 0.83 0 200 400 600 800 0 10 20 30 R esid u al d en sity [ k g /m ³] Lost material [%] (a) (b)
11
Figure 5: Correlation between screw withdrawal force and original apparent density (a) and screw withdrawal force and residual apparent density (b).
3.3 Shear parallel to grain
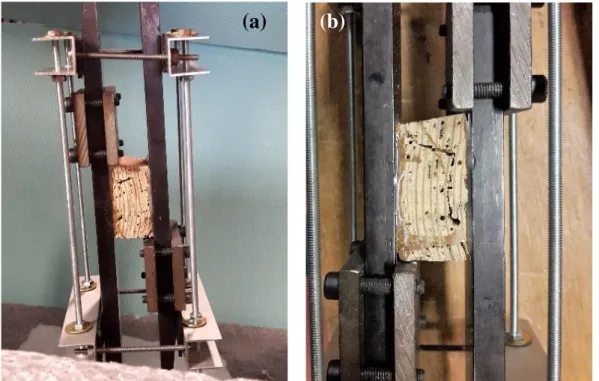
The following Table 4 presents the results obtained for shear parallel to the grain tests. Fig. 6 presents the obtained correlations between densities (original and residual) and the shear strength. This figure indicates a medium correlation (r2 = 0.75) for original density and a high correlation (r2 = 0.82) for residual density. These coefficients of determination suggest that the shear parallel to the grain test applied on timber degraded by anobiids can be likely to be quite explanatory of the behaviour of the material at breaking. This is because the tunnels formed by beetles are preferentially formed in the early wood and tend to progress tangent to adjacent late wood (Nunes et al., 2019). It is in this direction and in zones with greater concentration of tunnels that the material has a greater tendency to break (Fig. 7). The samples crushed easily realising a large amount of bore dust, which indicates the high level of degradation of timber.
Table 4: Shear parallel to the grain test results.
Parameter
Values
Average (μ) Minimum Maximum Standard deviation (σ) C.V (%)
Fmáx kN 1.3 0.5 2.3 0.54
40.9
𝒇𝒗 N/mm2 2.4 0.8 4.3 1.11
Fig. 6: Correlations between shear strength and original apparent density (a) shear strength and residual apparent density. y = 148.22x + 424.21 R² = 0.80 440 460 480 500 520 540 0 0,2 0,4 0,6 0,8 Or ig in al d en sity [ k g /m ³] Screw withdrawal [kN] y = 112.73x + 332.28 R² = 0.84 340 360 380 400 420 0 0,2 0,4 0,6 0,8 R esid u al d en sity [ k g /m ³] Screw withdrawal [kN] y = 0.0202x - 8.24 R² = 0.75 0 1 2 3 4 5 450 500 550 600 650 Sh ea r str en g th [ MP a] Original density [kg/m³] y = 0.0146x - 4.13 R² = 0.82 0 1 2 3 4 5 350 400 450 500 550 600 Sh ea r str en g th [ MP a] Residual density [kg/m³] (a) (b) (a) (b)
12
Fig. 7: Shear parallel to the grain test being performed (a) and rupture of a sample by shear test (b).
3.4 Description of the semi-destructive assessment method proposed
The proposed procedure applies the concept introduced by Gilfillan and Gilbert (2001), however with some changes. The method is based on the maximum force required to withdraw a screw which is inserted on the timber’ surface in a direction perpendicular to the grain. No distinction was made between the radial and the tangential directions since the results are not expected to differ significantly (Gilfillan and Gilbert, 2001).
In this article, two relationships estimated for deteriorated timber elements are shown. These correlations can be used to estimate density loss of degraded maritime pine elements (Fig. 5) and its associated shear strength parallel to the grain (Fig. 6) via the maximum screw withdrawal force, determined in situ.
The procedure, based on laboratory tests, can be briefly summarised in the following steps: • A preliminary visual inspection of each timber member for the identification of the most
degraded zones and to identify the presence of defects (knots, fissures, slope of the grain) must be conducted. The in situ visual inspection is recognised by several authors as the first step for the assessment of a timber structure (Cruz et al., 2015; Kasal and Anthony, 2002; Feio and Machado, 2015). Italian standard UNI 11119 (2004) refers to the principles that must be applied during the inspection procedure as well as the necessary conditions for such diagnosis inspection. The screw withdrawal test should not be performed in places where the presence of defects was detected. The results will be affected by the presence of such defects (i.e. when the screw is in or around knots, the provided results will be higher) (Kloiber et al., 2015).
• Identification of the screw withdrawal test positions. Screw withdrawal test provide a local parameter, so tests must be applied to multiple locations, and the average result should be used to estimate member properties (Tannert et al., 2014). However, if the structure has historic interest, this approach can be difficult to perform because the damage to the structure
13
must be kept to a minimum. This fact reinforces the importance of the visual inspection (point 1).
• During the performance of the screw withdrawal test, the type of screw, the outer diameter of that screw, the penetration length, the penetration direction and the pre-drilling must be checked. The results of the present research are only applied if the setup conditions described in section 2.3.1 are followed. Any change in the application of the technique will lead to the production of anomalous results. Using the correlations of Fig. 5 to estimate density loss (due to the degradation caused by anobiids) as a function of the screw withdrawal force. • Once the loss of density is obtained can be correlated with shear strength parallel to the grain
using correlations of Fig. 6. At the end it can be concluded on the residual resistance and thus contribute to a better quantitative assessment of the structural elements.
4. CONCLUSIONS
This research had two main objectives: to evaluate the impact of anobiid damage on pine timber structures by: (1) using micro-computed tomography to establish a valid empirical correlation between the lost material percentage and original/residual apparent density; (2) proposing a novel assessment method for evaluating the impact of anobiid damage on timber structural elements. Regarding the first objective, the results showed a medium experimental correlation between lost material percentage and original apparent density. A higher experimental correlation was obtained when comparing lost material percentage and residual apparent density. These results allow to confirm that μ-XCT methodology was well applied in this study as well as that timber apparent density is a likely determinant of the quality as it is experimentally highly correlated with mechanical properties.
Concerning the second objective, a novel assessment method is proposed and based in four major steps: visual inspection of each deteriorated timber member; semi-destructive prediction of the density loss based on a screw withdrawal test performed in situ; using correlations of Fig. 5 to estimate the loss of density; using correlations of Fig. 6 to predict shear strength parallel to the grain and thus to conclude on the residual resistance.
Although good results were obtained for degraded timber elements, the method was developed in laboratory though it is important that the technique can be used in situ. For this purpose, the experimental work now needs to be extended using portable devices available to measure screw withdrawal resistance. When in situ, the screws should be pulled slowly and steadily, according to the methods used on laboratory. This extension is also important to the validation of the proposed method, as well as to estimate and verify valid correlations for other species.
5. ACKNOWLEDGMENTS
The authors gratefully acknowledge the support given by Portuguese Foundation for Science and Technology (FCT) within research projects: PTDC/EPH-PAT/4684/2014 (DB-HERITAGE – Database of building materials with historical and heritage interest), PTDC/ECM-EST/1072/2014 (Pro-Timber – Probabilistic assessment of existing timber structures) and Pest-OE/CTE/UI4028/2011 (CERENA).
14 6. REFERENCES
Bravery, A F, Berry, R W, Carey, J K, Cooper, D E (1992): Recognising wood rot and insects damage in buildings. Building Research Establishment, Garston.
Charles, F, Coston-Guarini, J, Guarini, J, Lantoine, F (2018) It’s what’s inside that counts: computer-aided tomography for evaluating the rate and extent of wood consumption by shipworms. Journal of Wood Science 64(4), 427-435.
Cruz, H and Machado, J S (2013) Effects of beetle attack on the bending and compression strength properties of pine wood. Advanced Materials Research, 778, 145-151.
Cruz, H, Yeomans, D, Tsakanika, E, Macchioni, N, Jorissen, A, Touza, M, Mannucci, M and Lourenço, P (2015) Guidelines for on-site assessment of historic timber structures. International Journal of Architectural Heritage, 9(3), 277-289.
Eaton, R A, Hale, M D C (1993): Wood: Decay, Pests and Protection. Chapmman & Hall, London. EN 408:2010. Timber structures – Structural timber and glued laminate timber – Determination of some physical and mechanical properties. European Comitte for Standardization, Brussels. EN 350:2016. Durability of wood and wood-based products – Testing and classification of the durability to biological agents of wood and wood-based materials. European Committee for Standardization, Brussels.
EN 1382:2000. Timber structures – Test methods: Withdrawal capacity of timber fasteners. European Committee for Standardization, Brussels.
Feio A, Machado JS (2015) In-situ assessment of timber structural elements: Combining information from visual strength grading and NDT/SDT methods – A review. Construction and Building Materials 101, 1157-1165.
Fuchs, A, Schreyer, A, Feuerbach, S, Korb, J (2004) A new technique for termite monitoring using computer tomography and endoscopy. International Journal Pest Management, 50, 63-66. Gilfillan JR, Gilbert SG (2001) Development of a technique to measure the residual strength of woodworm infested timber. Construction and Building Materials, 15, 381-388.
Himmi, S K, Yoshimura, T, Yanase, Y, Oya, M, Torigoe, T, Imazu, S (2014) X-ray tomography analysis of the initial structure of the royal chamber and the nest-founding behaviour of the drywood termite Incisitermes minor. Journal of Wood Science, 60, 453-460.
ISO 16061-1:2014. Physical and mechanical properties of wood – Test methods for small clear wood specimens – Part 1: Determination of moisture content for physical and mechanical tests, International Organization for Standardization, Genève.
Joint Committee on Structural Safety: Probabilistic model code. Part 3.5 – timber. ISBN:978-3-909386-79-6. Available via: www.jcss.ethz.ch/publications_pmc.html
Kasal B, Anthony RW (2002) Advances in situ evaluation of timber structures. Progress in Structural Engineering and Materials 6(2), 94-103.
15
Kigawa, R, Torigoe, T, Imazu, S, Honda, M, Harada, M, Komine, Y, Kawanobe W (2009) Detection of insects in wooden objects by X-ray CT scanner (in Japanese). Science for Conservation 48, 223-231.
Kloiber M, Drdácký M, Machado JS, Piazza M, Yamagushi N (2015) Prediction of mechanical properties by means of semi-destructive methods: A review. Construction and Building Materials 101, 1215-1234.
Nunes, L, Parracha, J L, Faria, P, Palma, P, Pereira, M F C, Maurício, A (2019) Towards an assessment tool of anobiid damage of pine timber structures. In: IABSE Symposium – Towards a Resilient Build Environment Risk and Asset Management, Guimarães, Portugal.
Tannert T, Anthony R, Kasal B, Kloiber M, Piazza M, Riggio M, Rinn F, Widmann R, Yamagushi N (2014) In situ assessment of structural timber using semi-destructive techniques. Materials and Structures 47, 767-785.
Watanabe, H, Yanase, Y, Fujii, Y (2015) Evaluation of larval growth process and bamboo consumption of the bamboo powder-post beetle Dinoderus minutus using X-ray computed tomography. Journal of Wood Science 61, 171-177.