Abstract. A fast, simple, low cost and general technique for estimating fuel surface area-to-volume ratio was developed. It requires the knowledge of particle density, the determination of fuel weight before and after immersion in water, and theoretical thickness of the adsorbed water pellicle that is assumed constant. Estimates by the technique were consistent and in good agreement with published surface area-to-volume ratios for the same fuels obtained through commonly used methods, and its performance is judged appropriate for the current fire behaviour modeling needs. The water immersion technique was applied to five common shrub species in Portugal. Limitations and possibilities for improvement of the newly developed technique are discussed.
Keywords: Fuel, Surface area-to-volume ratio, Shrubs, Fire behavior, Portugal.
Introduction
Surface area-to-volume ratio is the fuel property that best describes particle geometry and the relative dimensions of the fuel-complex elements. It is a critical parameter in fuel characterization because it strongly influences the components of flammability (Anderson 1970): ignitability, sustainability and combustibility; a fourth component - consumability - is considered by Martin et al. (1993). Large surface area-to-volume ratios increase the rates of energy and mass exchange with the gaseous phase, leading to lower ignition delays and higher rates of fire spread (Chandler et al. 1983).
Surface area-to-volume ratio has a major role in the fire model of Rothermel (1972), appearing in several terms of the spread equation where it accounts for the rate and completeness of fuel consumption, rate of energy release, efficiency of fuel preheating and response to wind. Therefore, fuel surface area-to-volume ratio must be quantified in order to use the fire behavior prediction tools based on Rothermel's model, like BEHAVE (Burgan & Rothermel 1984, Andrews 1986, Andrews & Chase 1989) and FARSITE (Finney 1995).
Surface area-to-volume ratio is commonly assessed through the methods developed by Brown (1969, 1970a, 1970b), which rely on simple geometric models to describe fuel particle shape. Fuel dimensions are measured at low moisture levels after air-drying, but sometimes the evaluation is done on fresh (Countryman 1982, Papió & Trabaud 1990, Marsden-Smedley 1993) or ovendry (Sylvester & Wein 1981, Daligault 1991) material. Only diameter measurements are required to calculate the surface area-to-volume ratio of stalks, twigs and branches, because they are assimilated to cylinders whose terminal area is neglected. Flat leaves are idealized as right prisms (ignoring the area on the edge) and measured in thickness. Some authors consider conical (Countryman & Philpot 1970, Papió & Trabaud 1990), elliptical (Fujioka & Fujii 1980) and triangular (Sylvester & Wein 1981) shapes for specific fuels. Accuracy of the estimates given by this method greatly depends on the degree of departure from the assumed geometry, configuration irregularity and surface roughness (Brown 1970b, Countryman & Philpot 1970).
Surface area-to-volume ratio can be determined by separate measurements of surface area and volume. Volume is calculated from physical measurement, if geometry is favorable, or by liquid displacement which is more accurate (Countryman & Philpot 1970, Johnson 1984). The surface area of broadleaf foliage can be measured with planimetrical techniques that give projected area (Countryman 1982, Papió & Trabaud 1990, Valette & Portier 1992), and consequently disregard texture irregularity. A common approach in plant physiology studies is to establish mathematical relations between surface area and other leaf characteristics, like biomass (e.g. Waring et al. 1978, 1980, Cregg 1992).
Planimetric methods are poorly suited to estimate surface area when particles are predominantly tridimensional, but a regression between projected area and total area can be established (Cregg 1992). This consideration also holds for the geometrical approaches, unless great additional efforts are made to exactly measure the particles (e.g. Daligault 1991).
The best solution to deal with tridimensional and lengthy fine fuels, such as conifer needles, is to evaluate surface area-to-volume ratio by measuring the perimeter-to-area ratio of a cross-section, which can be achieved through photomicrography (Brown 1970b, Brown 1972, Hough & Albini 1978) or image analysis (Ferreira 1992, Hernando et al. 1995). This indirect procedure should be followed by the definition of a shape factor to convert thickness measurements to surface-area-to-volume ratios (Brown 1970b, Hough & Albini 1978).
Johnson (1984) developed a simple and rapid method to determine pine needles surface area, requiring only the displaced volume and cumulative length of a needle sample. The
technique assumes that the shape of a needle cross section depends only on the number of needles per fascicle, which is an erroneous supposition (Hernando et al. 1995).
Shrub and grass fuels occur as assemblages of particles different in size and shape whose average surface area-to-volume ratio cannot be estimated directly. Overall values for a plant are calculated by weighting the surface area-to-volume ratios of the individual components by dry weight (Brown 1970b, Fujioka & Fujii 1980, Sylvester & Wein 1981), surface area (Countryman & Philpot 1970, Pereira et al. 1995), volume (Brown 1970a) or length (Cheney et al. 1993).
The available methods to estimate surface area-to-volume ratio are time consuming, inadequate to take into account the morphological peculiarities of many sclerophylous fuels (the geometrical and planimetrical approaches) or require equipment not always accessible or affordable (cross-sectional analysis). The development of a generic, rapid and low cost technique to evaluate fuel surface area-to-volume ratio is the main objective of this study.
Theory
When a fuel particle is withdrawn from water after a previous immersion, a certain amount of liquid is adsorbed to its surface. This volume of water (Vw, cm3) is a function of particle
surface area (S, cm2) and thickness of the adsorbed water pellicle (t, cm):
Expression (1) can be solved for the fuel particle surface area:
Since water density equals 1 g cm-3, the former equation is equivalent to:
where W1 and W2 are the fuel particle weights (g) before and after immersion.
where ρp is the fuel particle density or specific gravity (g cm-3).
The association of expressions (3) and (4) results in a surface area-to-volume ratio (σ, cm
-1) equation :
Equation (5) will be effective if the quantity of adsorbed water is only a function of surface area. As a working hypothesis it was assumed that surface tension variability between distinct fuels is not important enough to induce significantly different water adsorptions. Note that the water pellicle thickness (t) is not regarded as an intact film covering the plant surface with an uniform depth, but rather as a theoretical average value. Water fluxes through forests are modeled using the same approach (Running & Coughlan 1988, Arp & Yin 1992, Keane et al. 1996), by means of a canopy interception coefficient assumed constant for all species and equivalent to our t.
Methods
Technique development
The first experimental step in technique development was to test the independence of water adsorption from fuel surface characteristics. Woody fuels of four shrub species (Chamaespartium tridentatum (L.) P. Gibbs, Erica australis L., Erica umbelatta Loefl. and Halimium ocymoides (Lam.) Willk., both live and dead, were used. Surface texture of these species' stems is quite different: E. umbelatta is strongly irregular and fissured and H. ocymoides is very smooth while the other two species have intermediate roughness.
Twigs, branches and stems closely resembling cylinders were selected from the collected shrubs, covering the natural variability in diameters. The fuel pieces were allowed to dry at laboratory ambient conditions for two weeks and then oven-dried for 24 h at 60o C. Because particle density changes with moisture content, ovendry material was measured to ensure more consistency in equation (5) results, where all terms must be referenced to the same moisture content. A few trials with Erica umbelatta were performed to compare the changes that occur in particle density, surface area, volume and surface area-to-volume ratio when fuel passes from the airdry to the ovendry condition.
where d and l are, respectively, the average particle diameter and the particle length.
Diameters and lengths of the fuel pieces were measured with a digital caliper to the nearest 0.1 mm, and d was calculated averaging the measurements at five mm intervals along the piece length. After determining its weight (W1) the fuel piece was handled with tweezers and
maintained under water in a tub for five seconds. Adhesion of air bubbles was prevented by keeping the particle in movement while submerged. After displacing the material from water and before weighing it for W2, it was necessary to remove some water in excess at its surface. The
standardized procedure used for this purpose was to place the fuel inside a common household centrifugation device (a salad spinner measuring 35 cm in diameter) that was rotated five times.
The individual values of t for each fuel piece (n=112) were computed combining equations (3) and (6):
In order to establish a comparison basis with other methods, the water immersion technique was applied to fuels for which published surface area-to-volume ratios are available: eucalyptus dead leaves, dead needles of four pine species, live portions of two shrubs and one forb. Fuel particle density was obtained by water displacement following the detailed description of Daligault (1991). Five observations for density and fifteen for surface area-to-volume ratio were recorded per fuel type.
Technique application
The water immersion technique was used to evaluate surface area-to-volume ratios of five important species of Northern Portugal shrubland and forest understory: Chamaespartium tridentatum, Erica australis, E. umbelatta, Calluna vulgaris (L.) Hull and Halimium ocymoides. Two diameter classes were considered, <2.5 mm and 2.5-6 mm, in agreement with fuel characterization standards in the frame of an European project (Valette et al. 1996). The overall value for fine fuel (diameter <6 mm) known as characteristic surface area-to-volume ratio (σchar) was also estimated for each species. Sixty individual stems of the two dominant species
(Chamaespartium tridentatum and Erica umbelatta) were collected in mature communities. σchar
The same procedure was used in the remaining species but only ten stems were cut. No attempts were made to separate dead and live material. Plants had to be fractioned before immersion due to their size; the sum of the subsample weights for each stem were entered in the surface area-to-volume ratio equation.
Results and Discussion
Technique development
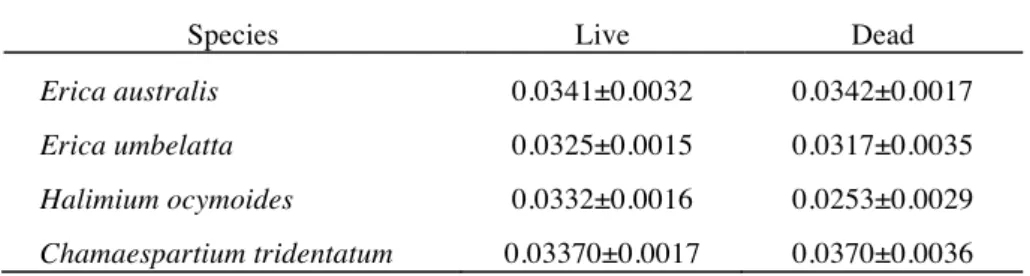
The t values for each fuel condition and species are displayed in Table 1. Factorial analysis of variance showed that t was not significantly affected by live or dead fuel condition (p=0.54), species (p=0.10) or their interaction (p=0.13). Therefore t was not influenced by the distinct surface characteristics of the studied shrub species. Based upon the data, there is no evidence that water was absorbed by dead fuels while immersed; in fact, the time spent under water is considerably less than when determining particle density or volume by the water displacement method.
The average t value was 0.0329±0.0007 cm. This figure is quite comparable to the canopy rain interception constant of 0.05 cm used by Running & Coughlan (1988), Arp & Yin (1992) and Keane et al. (1996), which is approximately equal to 0.025 cm for the whole surface area of a leaf. Substitution on equation (5) resulted in the final surface area-to-volume ratio equation:
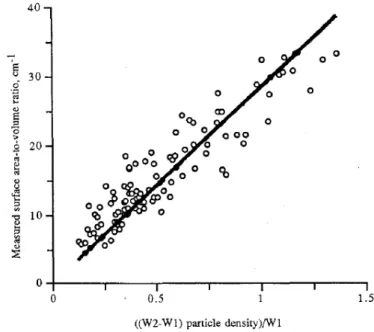
The slope of a regression (without intercept) between surface area-to-volume ratio and ((W2-W1)ρp)/W1 can be interpreted as the inverse of the water pellicle thickness (Fig. 1). There
is a strong linear relationship (r2=0.86, p<0.0001) between the variables and data scatter remains constant throughout the examined range of surface area-to-volume ratio.
No significant correlations (p>0.05, n=112) were found between water pellicle thickness and physical descriptors of the fuel pieces (Table 2). Therefore t is not related to surface area-to-volume ratio.
Particle density, surface area, volume and surface area-to-volume ratio change from airdry to ovendry fuel condition (Table 3). Data are limited but enough to notice that ovendrying causes shrinkage and lowers particle density. Surface area-to-volume ratio increases, since reduction in volume is higher than in surface area. Previously live fuel pieces suffer a higher rate of modification, as expected, but the difference is small. Despite moderate moisture contents in the
air-dried condition, the increase in σ was modest - the maximum value registered for live fuel was 4.9%. Brown (1976) verified diameter reductions ranging between 7% and 23% after air-drying fresh shrub stems. So only minor differences in surface area-to-volume ratio are to be expected between the air-dried and the oven-dried condition.
Fig. 1. Surface area-to-volume-ratios of the data used to develop the water immersion method plotted against
((W2-W1)ρp)/W1 (all species and conditions, n=112). The slope of the regression line (y=28.309x, r2=0.86, p<0.0001) can be interpreted as the inverse of the water pellicle thickness, t.
Published surface area-to-volume ratios (σ1) and the results attained for the same fuels with the water immersion method (σ2) are presented in Table 4, together with particle densities. There is no evidence of a systematic pattern of surface area-to-volume ratio underestimation or overestimation by the water immersion technique. The difference between σ1 and σ2 (referenced to σ1) was generally low, averaging 9.3% in absolute percent deviation. Nevertheless, the difference for Pinus halepensis needles and Rosmarinus officinalis finer twigs exceeded 20%.
The results for the three Mediterranean pine species are especially interesting, since they enable comparisons with a geometrical approach method (Daligault 1991), a cross-sectional analysis (Hernando et al. 1995), and a combination of both for Pinus pinaster (Fernandes 1991). P. pinaster displays similar values of σ1 (estimated through the three methods) and σ2. The water immersion results for Pinus pinea and P. halepensis are ranked between the other two methods; assuming that the image analysis technique used by Hernando et al. (1995) is the most
accurate, it can be hyphothesized that the procedures employed by Daligault (1991) overestimated surface area-to-volume ratios in those thinner fuels, probably through measurement errors caused by needle compression in the caliper.
Erica arborea characteristic surface area-to-volume ratios estimated by physical measurement (Pereira et al. 1995) and with the water immersion method are very similar. Papió & Trabaud (1990) accept that the planimetry technique they used to estimate foliar surface area of Rosmarinus officinalis led to underestimation, because the lamina folds under the leaf were ignored. In this case σ2 (leaves and branches <2.5 mm) exceeds σ1 (leaves) by 4%, which is an excellent result, since this shrub has pubescent and waxy leaves that could prevent water adsorption.
Physical fuel properties of one species' individual particles are relatively constant, but it is known they can vary with geographical location (Sackett 1980, Daligault 1991, Hernando et al. 1995), age (Hough & Albini 1978) or canopy position (Fernandes 1991, Cregg 1992, Ferreira 1992). Also, few σ1 values refer to oven-dried particles. Therefore, entirely conclusive
statements about the water immersion technique effectiveness cannot be drawn. Still, a direct comparison between the developed technique and the simple method of Johnson (1984) was attempted. Surface area-to-volume ratio of Pinus pinaster dead needles determined by Johnson's method was largely underestimated in relation both to σ1 and σ2, which discouraged further utilization of Johnson's approach.
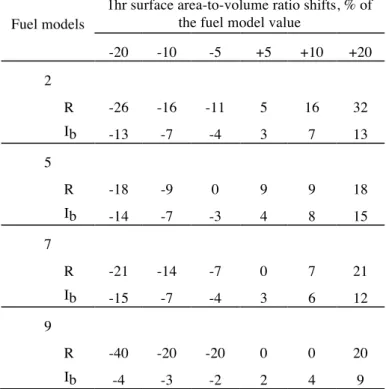
The resolution of fuel inputs to fire behaviour models must match the desired accuracy of the output. The sensitivity of BEHAVE system to surface area-to-volume ratio was examined through the TSTMDL program (Burgan & Rothermel 1984). Rate of spread and fireline intensity were simulated for the standard NFFL fuel models 2, 5 and 9 (Anderson 1982); because long-needle pine stands with flammable understory are very representative of Southern Europe, model 7 was also included. The 1-hr surface area-to-volume ratio was varied by 5, 10 and 20% below and above the fuel model values, keeping the other fuel parameters constant. Predictions were obtained setting the environmental inputs to typical summer conditions. Results are reported in Table 5.
The non-linearity of fire behaviour models prevents sound statements about the quantitative relationship between input and output accuracies (Albini 1976a) which is visible in the simulation results. It is also apparent that sensitivity to surface area-to-volume ratio depends of fuel type, and that rate of spread is more affected than fireline intensity.
The average absolute difference between σ1 and σ2 was less than 10%. Assuming this
difference as an error, the corresponding error in fire behaviour estimation would range from 0 to 20% in rate of spread, and from 3 to 8% in fireline intensity. Suppression possibilities can be directly drawn from fireline intensity (Andrews & Rothermel 1982), which is useful in many fire management situations. Only in the case of fuel model 2 would an error in σ estimation cause an error in the assigned fire severity class.
However, considerations about fuel input accuracy become secondary in real life circumstances, where the dominant source of error in fire behaviour prediction is the deviation from Rothermel's model assumptions of environmental uniformity (Albini 1976a). Those premises are met when testing the model's inherent accuracy, outcoming in successful predictions, although non-explained variation in rate of spread can range from 8% to 57% (Andrews 1980). The major problems are to be expected when live fuels are important (Catchpole & Catchpole 1991) and in mixed fuel complexes of different sized particles (Catchpole et al. 1993). The averaging techniques associated with fuel characterization (e.g. see Brown 1981 for a discussion on bulk density) and fuel model development (e.g. Hough & Albini 1978), and the fact that fuel model parameters can and should be adjusted to observed fire behaviour (Burgan & Rothermel 1984) further minimize the importance of inaccuracies in fuel description, and allow the employment of the water immersion technique in surface area-to-volume ratio evaluation.
Technique application
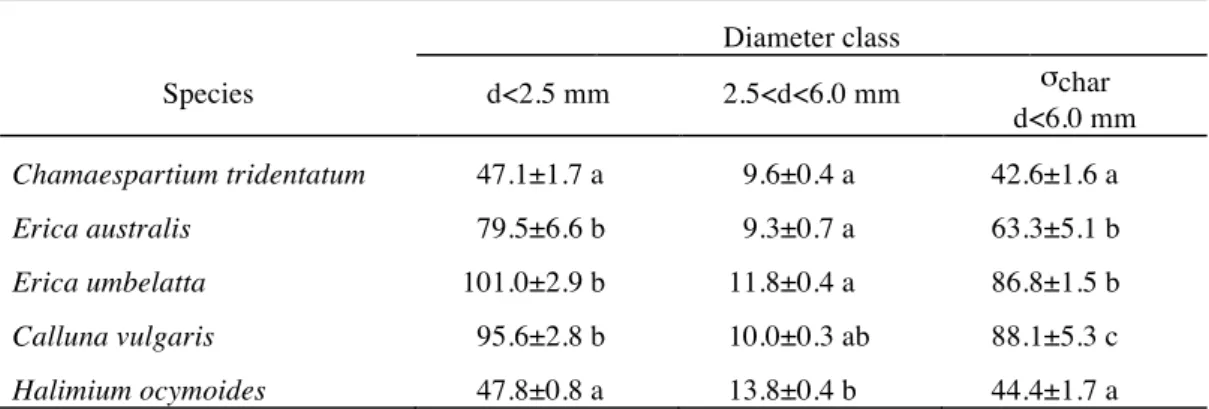
Table 6 presents the fuel particle densities used to calculate surface area-to-volume ratio by size class of the studied shrub species. The major differences in σ between species (Table 7) are displayed by the finer elements (<2.5 mm); the coarser Chamaespartium tridentatum and Halimium ocymoides contrast with the thinner ericaceous species. Distinction becomes difficult in the 2.5-6.0 mm diameter class, which is a trend commonly found in the literature (Hough & Albini 1978, Papió & Trabaud 1990, Fernandes & Pereira 1993). The characteristic surface area-to-volume ratio (σchar) is more meaningful, since it provides an overall value for fine fuel. There
was a two-fold difference between species, and the finer particles account for the main exposed surface area: σchar is only 7 to 20% lower than the <2.5 mm size class values.
Different foliar morphologies and canopy structures of the heath species explain their different surface area-to-volume ratios. Calluna vulgaris and Erica umbelatta are finely ramified low shrubs, while Erica australis is a tall plant, with broader leaves directly inserted in relatively
thick branches. Low foliar density in Halimium ocymoides and coarse false leaves in Chamaespartium tridentatum apparently preclude these species from having high σ values.
Surface area-to-volume ratios of these five species are included in the range of values reported for plants of other shrub communities in Mediterranean regions (Rothermel & Philpot 1973, Countryman 1982, Papió & Trabaud 1990, Fernandes & Pereira 1993, Pereira et al. 1995) or elsewhere (Lindenmuth & Davies 1973, Hough & Albini 1978, Sylvester & Wein 1981, Brown 1982, Marsden-Smedley 1993). Those authors also observed that surface area-to-volume ratios can vary widely between species within the same vegetation type.
Surface area-to-volume ratios of the studied shrubs reflect the balance between dead and live fine material in mature plants. A higher level of resolution could have been achieved with individual estimations for dead and live fuels, but average values are sufficient for use with the fire behaviour model.
Conclusions
The water immersion technique relies on assumptions that are conducive to unfavorable comparisons with the methods currently used to evaluate surface area-to-volume ratio. However, the results show that this approach is sensitive to fuels with different shape and size. The estimates given by the method are consistent and good and fulfill the fire behaviour modeling needs, particularly when considered from the management point of view.
The water immersion technique offers two immediate advantages over the standard methods: (1) rapid, simple and inexpensive execution; (2) flexibility, with utilization feasible in all types of particles, regardless of their geometrical complexity. Furthermore, the method has two attractive features than can result in accuracy gains: (3) it doesn't rely on simplified descriptions of fuel geometry; and (4) enables direct determination of the characteristic σ of an heterogeneous complex of particles, avoiding the morosity and subjectivity of the linear intercept techniques described by Brown (1971) and Pereira et al. (1995), and the inconsistency of calculating an average weighted by surface area (Albini 1976b, Catchpole et al. 1993).
The best results are likely to be attained when the technique is applied to individual elements of homogeneous density. The need to determine fuel particle density can be viewed as a disadvantage, but this parameter is also a fuel flammability descriptor and it is easily measured through the standard water displacement technique. The water immersion technique can be used at any fuel moisture level, providing that particle density determination takes place at the same moisture content.
Water adsorption was not affected by the nature of particle surface, but the technique should be applied cautiously to hairy or waxy coated plants. Additional precision can be achieved by enlarging the number of observations, to compensate for variations both in water adsorption and water removal. Users should determine their own water pellicle thickness value, which depends on the procedures followed after removing fuel from water. Technical improvements can be accomplished by the addition of wetting agents to water in order to break surface tension and prevent air bubble trapping, and by a more consistent way to remove water.
The water immersion technique is not suited for fuels whose small size restrains appropriate handling, like short conifer needles and single shrub leaves. Certain plants have leaves that become easily detached when dry, so some of them can be lost in the water and cause underestimation of the surface area-to-volume ratio.
The generalization of this technique is possible and recommended. Nevertheless, some prudence is required and calibration or combination by double sampling with measurements from standard procedures is advisable.
Acknowledgments. This research was supported by the EEC Program nº EV5V-CT94-0473 and by a grant of the Junta Nacional de Investigação Científica e Tecnológica (JNICT) under contract PRAXIS XXI / BM / 2015 / 94. Thanks go to Dr. Kevin Ryan, Dr. Hermínio Botelho and Dr. Penelope Morgan for their comments. The criticism of three anonymous reviewers greatly improved an earlier version of this manuscript.
References
Albini, F.A. 1976a. Estimating wildfire behavior and effects. United States Department of Agriculture, Forest Service, General Technical Report INT-30, Intermountain Forest and Range Experiment Station, Ogden, Utah. 92 pages.
Albini, F.A. 1976b. Computer-based models of wildland fire behaviour: a user's manual. United States Department of Agriculture, Forest Service, Intermountain Forest and Range Experiment Station, Ogden, Utah. 68 pages. Anderson, H.E. 1970. Forest fuel ignitability. Fire Technology 6(4): 312-319.
Anderson, H.E. 1982. Aids to determining fuel models for estimating fire behavior. United States Department of Agriculture, Forest Service, General Technical Report INT-122, Intermountain Forest and Range Experiment Station, Ogden, Utah. 22 pages.
Andrews, P.L. 1980. Testing the fire behavior model. In: Proceedings of the 6th Conference on Fire and Forest Meteorology, Seattle, Washington, April 22-24, 1980, pages 70-77. Society of American Forests, Washington D.C.
Andrews, P.L. 1986. BEHAVE: fire behavior prediction and fuel modeling system - BURN subsystem, part 1. United States Department of Agriculture, Forest Service, General Technical Report INT-194, Intermountain Forest and Range Experiment Station, Ogden, Utah. 130 pages.
Andrews, P.L. and C. Chase. 1989. BEHAVE: fire behavior prediction and fuel modeling system - BURN subsystem, part 2. United States Department of Agriculture, Forest Service, General Technical Report INT-260, Intermountain Forest and Range Experiment Station, Ogden, Utah. 93 pages.
Andrews, P.L. and R.C. Rothermel. 1982. Charts for interpreting wildland fire behavior characteristics. United States Department of Agriculture, Forest Service, General Technical Report INT-131, Intermountain Forest and Range Experiment Station, Ogden, Utah. 21 pages.
Arp, P.A. and X. Yin. 1992. Predicting water fluxes through forests from monthly precipitation and mean monthly air temperature records. Canadian Journal of Forest Research 22: 864-877.
Brown, J.K. 1969. Porosity of cheatgrass fuel related to weight. United States Department of Agriculture, Forest Service, Research Note INT-97, Intermountain Forest and Range Experiment Station, Ogden, Utah. 4 pages. Brown, J.K. 1970a. Physical fuel properties of ponderosa pine forest floors and cheatgrass. United States
Department of Agriculture, Forest Service, Research Paper INT-74, Intermountain Forest and Range Experiment Station, Ogden, Utah. 16 pages.
Brown, J.K. 1970b. Ratios of surface area to volume for common fine fuels. Forest Science 16(1): 101-105.
Brown, J.K. 1971. A planar intersect method for sampling fuel volume and surface area. Forest Science 17(1): 96-102.
Brown, J.K. 1972. Field test of a rate-of-spread model in slash fuels. United States Department of Agriculture, Forest Service, Research Paper INT-290, Intermountain Forest and Range Experiment Station, Ogden, Utah. 10 pages.
Brown, J. K. 1976. Estimating shrub biomass from basal stem diameters. Canadian Journal of Forest Research 6(2): 153-158.
Brown, J. K. 1981. Bulk densities of nonuniform surface fuels and their application to fire modeling. Forest Science 27(4): 667-683.
Brown, J.K. 1982. Fuel and fire behavior prediction in big sagebrush. United States Department of Agriculture, Forest Service, Research Paper INT-116, Intermountain Forest and Range Experiment Station, Ogden, Utah. 24 pages.
Burgan, R. and R. Rothermel. 1984. BEHAVE: Fire behavior prediction and fuel modeling system - FUEL Subsystem. United States Department of Agriculture, Forest Service, General Technical Report INT-167, Intermountain Forest and Range Experiment Station, Ogden, Utah. 126 pages.
Catchpole, E.A and W.R. Catchpole. 1991. Modeling moisture damping for fire spread in a mixture of live and dead fuels. International Journal of Wildland Fire 1(2): 101-106.
Catchpole, E.A., W.R. Catchpole and R.C. Rothermel. 1993. Fire behavior experiments in mixed fuel complexes. International Journal of Wildland Fire 3(1): 45-57.
Chandler, C., P. Cheney, P. Thomas, L. Trabaud, and D. Williams. 1983. Fire in Forestry. Vol I: Forest Fire Behavior and Effects. John Wiley & Sons, New York. 450 pages.
Cheney, N.P., J.S. Gould and W.R. Catchpole. 1993. The influence of fuel, weather and fire shape variables on fire-spread in grasslands. International Journal of Wildland Fire 3(1): 31-44.
Countryman, C.M. 1982. Physical characteristics of some Northern California brush fuels. United States Department of Agriculture, Forest Service, General Technical Report PSW-61, Pacific Southwest Forest and Range Experiment Station, Berkeley, California. 8 pages.
Countryman, C.M. and C.W. Philpot. 1970. Physical characteristics of chamise as a wildland fuel. United States Department of Agriculture, Forest Service, Research Paper PSW-66, Pacific Southwest Forest and Range Experiment Station, Berkeley, California. 16 pages.
Cregg, B.M. 1992. Leaf area estimation of mature foliage of Juniperus. Forest Science 38(1): 61-67.
Daligault, O. 1991. Caracteristiques physiques des aiguilles de pin. Institut National de la Recherche Agronomique, Laboratoire de Recherches Forestères Méditerranéennes, Doc. PIF9112, Avignon. 17 pages.
Fernandes, P.M. 1991. Caracterização do combustível florestal em ecossistemas de Pinus pinaster Ait.: aplicação do Sistema BEHAVE. Relatório final de estágio, Universidade de Trás-os-Montes e Alto Douro, Vila Real. 106 pages.
Fernandes, P.M. and J.P. Pereira. 1993. Caracterização de combustíveis na serra da Arrábida. Silva Lusitana 1(2): 237-260.
Ferreira, P.F. 1992. Ratio superfície/volume em agulhas de Pinus pinaster Ait. Um contributo na predição do comportamento do fogo. Relatório do trabalho de fim de curso. Universidade Técnica de Lisboa, Instituto Superior de Agronomia, Lisboa. 59 pages.
Finney, M.A. 1995. FARSITE Fire Area Simulator version 1.0. User's guide and technical documentation. System for Environmental Management, Missoula, Montana.
Fujioka, F. M. and D. M. Fujii. 1980. Physical characteristics of selected fine fuels in Hawaii - some refinements on surface area-to-volume calculations. United States Department of Agriculture, Forest Service, Research Note PSW-348, Pacific Southwest Forest and Range Experimental Station, Berkeley, California.
Hernando, C., M. Guijarro and J.A. Santos. 1995. Determinación de la relación superficie/volumen de las acículas muertas. Revista de Investigación Agraria. Serie Sistemas y Recursos Forestales.
Hough, W.A. and F.A. Albini. 1978. Predicting fire behavior in palmetto-galberry fuel complexes. United States Department of Agriculture, Forest Service, Research Paper SE-174, Southeastern Forest Experiment Station, Asheville, North Carolina. 44 pages.
Johnson, J.D. 1984. A rapid technique for estimating total surface area of pine needles. Forest Science 30(4): 913-921.
Keane, R.E., P. Morgan and S.W. Running. 1996. FIRE-BGC - a mechanistic ecological process model for simulating fire succession on coniferous forest landscapes on the Northern Rocky Mountains. United States Department of Agriculture, Forest Service, Research paper INT-RP-484, Intermountain Forest and Range Experiment Station, Ogden, Utah. 122 pages.
Lindenmuth, A.W. and J.R. Davies. 1973. Predicting fire spread in Arizona's oak chaparral. United States Department of Agriculture, Forest Service, Research Paper RM-101, Rocky Mountain Forest and Range Experiment Station, Fort Collins, Colorado. 11 pages.
Marsden-Smedley, J.B. 1993. Fuel characteristics and fire behaviour in Tasmanian buttongrass moorlands. Parks and Wildlife Service, Department of Environment and Land Management, Hobart, Australia. 96 pages.
Martin, R.E., D.A. Gordon, M.E. Gutierrez, D.S. Lee, D.M. Molina, R.A. Schroeder, D.B. Sapsis, S.L. Stephens and M. Chambers. 1993. Assessing the flammability of domestic and wildland vegetation. Pages 130-137 in Proceedings of the 12th Conference on Fire and Forest Meteorology, Jekyll Island, Georgia, October 26-28. Papió, C. and L. Trabaud. 1990. Structural characteristics of fuel components of five Mediterranean shrubs. Forest
Ecology and Management 35:249-259.
Pereira, J. M. C., N. M. S. Sequeira and J. M. B. Carreiras. 1995. Structural properties and dimensional relations of some Mediterranean shrub fuels. International Journal of Wildland Fire 5(1): 35-42.
Rothermel, R. 1972. A mathematical model for predicting fire spread in wildland fuels. United States Department of Agriculture, Forest Service, Research Paper INT-115, Intermountain Forest and Range Experiment Station, Ogden, Utah. 40 pages.
Rothermel, R.C. and C.W. Philpot. 1973. Fire in wildland management: predicting changes in chaparral flammability. Journal of Forestry 7(10): 640-643.
Running, S.W. and J.C. Coughlan. 1988. A general model of forest ecosystem processes for regional applications. I. Hydrologic balance, canopy gas exchange and primary production processes. Ecological Modeling 42: 125-154. Sackett, S.S. 1980. Woody fuel particle size and specific gravity of Southwestern tree species. United States
Department of Agriculture, Forest Service, Research Note RM-389, Rocky Mountain Forest and Range Experiment Station, Fort Collins, Colorado. 4 pages.
Sylvester, T.W. and R.W. Wein. 1981. Fuel characteristics of arctic plant species and simulated plant community flammability by Rothermel's model. Canadian Journal of Botany 59: 898-907.
Valette, J.C., J.A. Vega, H. Botelho, D. Gillon, C. Hernando and J. Ventura. 1996. Forest fire prevention through prescribed burning: prediction of effects on trees. In: Proceedings of the 13th Conference on Fire and Forest Meteorology, Lorne, Australia, October 27-31, 1996.
Valette, J.C. and D. Portier. 1992. Caracteristiques physiques des feuilles de Quercus pubescens. Institut National de la Recherche Agronomique, Laboratoire de Recherches Forestières Méditerranéennes, Doc. PIF9216, Avignon. 10 pages.
Waring, R.H., W.G. Thies and D. Muscato. 1980. Stem growth per unit of leaf area: a measure of tree vigor. Forest Science 26(1): 112-117.
Waring, R.H., W.H. Emmingham, H.L. Gholz and C.C. Grier. 1978. Variation in maximum leaf area of coniferous forests in Oregon and its ecological significance. Forest Science 24(1): 131-140.
Table 1. Water pellicle thickness (cm, mean ± standard error) by fuel species and condition.
Species Live Dead
Erica australis 0.0341±0.0032 0.0342±0.0017 Erica umbelatta 0.0325±0.0015 0.0317±0.0035 Halimium ocymoides 0.0332±0.0016 0.0253±0.0029 Chamaespartium tridentatum 0.03370±0.0017 0.0370±0.0036
Table 2. Range in physical characteristics of the fuel pieces used to develop the water immersion method and their
correlations with water pellicle thickness (t).
Fuel descriptor Range r p value
ρp, g cm-3 0.45-0.98 -0.08 0.39
l, mm 3.2-32.3 0.05 0.59
d, mm 1.2-8.9 -0.08 0.39
S, mm2 294-2333 -0.10 0.27
V, mm3 98-3116 -0.13 0.18
ρp, particle density; l, length; d, average diameter; S - surface area; V - volume.
Table 3. Particle density (ρp), surface area (S), volume (V) and surface area-to-volume ratio (σ) average percentual
differences* between air-dried (moisture contents tabulated) and oven-dried Erica umbelatta twigs.
Fuel condition content, % Moisture ρp S V σ
Live (n=3) 18.8 -13.7 -3.8 -7.7 3.7
Dead (n=3) 16.1 -10.6 -2.4 -4.9 2.4
Table 4. Comparison of surface area-to-volume ratio (cm-1) estimates by current methods (σ1) and the water
immersion method (σ2, mean ± standard error; particle density ρp, g cm-3) for several fuels.
Species Reference and fuel condition 1 σ1 σ2 Differ.2 (%) ρp Eucalyptus sp. Brown (1970b) - AD 61.8 56.9±2.1 a - 0.65 Pinus ponderosa Brown (1970b) - AD 57.6 53.8±1.8 6.6 0.56 Pinus pinea Hernando et al. (1995) - AD 57.8 b 64.7±2.2 -11.9 0.69
Daligault (1991) - OD 72.4 10.6
Pinus halepensis Hernando et al. (1995) - AD 79.7 b 87.4±3.5 -9.7 0.79
Daligault (1991) - OD 111.1 21.1
Pinus pinaster Hernando et al. (1995) - AD 48.2 b 46.4±2.2 3.7 0.66
Daligault (1991) - OD 46.0 c -0.9
Fernandes (1991) - AD 49.9 c 7.0
Pteridium aquilinum Burgan & Rothermel (1984) - N >82 94.0±6.0 - 0.30 Rosmarinus officinalis Papió & Trabaud (1990) - F 46.8 d 48.6±2.0 e -3.8 0.54 30.2 f 37.6±2.2 f -24.5 0.68 Erica arborea Pereira et al. (1995) - AD 69 g 66.9±2.6 g 2.9 0.50 1 AD - airdry; OD - ovendry; F - fresh; N - not given. All σ2 values refer to ovendry fuel.
2 Difference = ((σ1-σ2)/σ1) x 100 a Eucalyptus globulus.
b Average of 2 or more locations belonging to different geographical regions. c Average of 2 or more locations.
d leaves; e leaves and branches <2.5 mm diameter; f branches <2.5 mm diameter. g characteristic surface area-to-volume ratio.
Table 5. Sensitivity* of BEHAVE system fire behaviour predictions to 5, 10 and 20 percent variation in 1-hr
surface area-to-volume ratios for selected NFFL fuel models.
Fuel models
1hr surface area-to-volume ratio shifts, % of the fuel model value
-20 -10 -5 +5 +10 +20 2 R -26 -16 -11 5 16 32 Ib -13 -7 -4 3 7 13 5 R -18 -9 0 9 9 18 Ib -14 -7 -3 4 8 15 7 R -21 -14 -7 0 7 21 Ib -15 -7 -4 3 6 12 9 R -40 -20 -20 0 0 20 Ib -4 -3 -2 2 4 9
Simulation conditions: moisture contents - 6% (1-hr), 7% (10-hr and 100-hr) and 100% (live); slope - 30%; midflame windspeed - 10 km h-1.
R - rate of spread; Ib - fireline intensity.
* Difference = ((Pm-Pi)/Pi) x 100; Pm- prediction with the model 1-hr surface area-to-volume ratio, Pi - prediction with modified 1-hr surface area-to-volume ratio.
Table 6. Fuel particle density (g cm-3) by species and diameter class. Diameter class Species d<2.5 mm 2.5<d<6.0 mm d<6.0 mm Chamaespartium tridentatum 0.61 0.76 0.64 Erica australis 0.43 0.78 0.58 Erica umbelatta 0.32 0.79 0.49 Calluna vulgaris 0.23 0.79 0.44 Halimium ocymoides 0.28 0.75 0.47
Table 7. Fuel surface area-to-volume ratio (cm-1, mean ± standard error) by species and diameter class.
Diameter class Species d<2.5 mm 2.5<d<6.0 mm σchar d<6.0 mm Chamaespartium tridentatum 47.1±1.7 a 9.6±0.4 a 42.6±1.6 a Erica australis 79.5±6.6 b 9.3±0.7 a 63.3±5.1 b Erica umbelatta 101.0±2.9 b 11.8±0.4 a 86.8±1.5 b Calluna vulgaris 95.6±2.8 b 10.0±0.3 ab 88.1±5.3 c Halimium ocymoides 47.8±0.8 a 13.8±0.4 b 44.4±1.7 a
Means followed by the same letter in a column are not significantly different (p<0.05) according to Tukey's HSD test.