Braz. J. of Develop.,Curitiba, v. 6, n.5, p.29235-29250 may. 2020. ISSN 2525-8761
Performance of soybean due to variability in the spatial distribution of plants
Desempenho da soja devido à variabilidade na distribuição espacial de plantas
DOI:10.34117/bjdv6n5-393
Recebimento dos originais: 25/04/2020 Aceitação para publicação: 20/05/2020
Carlos André Bahry
Doutor em Ciência e Tecnologia de Sementes - Universidade Federal de Pelotas Instituição: Universidade Tecnológica Federal do Paraná
Endereço: Estrada p/ Boa Esperança, km 04, s/n, Comunidade São Cristóvão, Dois Vizinhos - PR E-mail: [email protected]
Andrei Daniel Zdziarski
Mestre em Agronomia – Universidade Tecnológica Federal do Paraná Instituição: GDM – Departamento Pesquisa Brasil – Divisão Cerrado Norte Endereço: Av. Campo Grande, n.1126, Bairro Industrial, Lucas do Rio Verde - MT
E-mail: [email protected]
João Paulo Oliveira Mezzomo
Discente do Curso de Agronomia - Universidade Tecnológica Federal do Paraná Instituição: Universidade Tecnológica Federal do Paraná
Endereço: Via do Conhecimento, s/n - KM 01 - Fraron, Pato Branco – PR E-mail: [email protected]
Lucas Vinícius Dallacorte
Mestrando do Programa de Pós-Graduação em Agronomia - Universidade Tecnológica Federal do Paraná
Instituição: Universidade Tecnológica Federal do Paraná
Endereço: Via do Conhecimento, s/n - KM 01 - Fraron, Pato Branco – PR E-mail: [email protected]
Anelise Tessari Perboni
Doutora em Fisiologia Vegetal – Universidade Federal de Pelotas Instituição: Universidade Tecnológica Federal do Paraná
Endereço: Estrada p/ Boa Esperança, km 04, s/n, Comunidade São Cristóvão, Dois Vizinhos - PR E-mail: [email protected]
Adriano Brutscher
Discente do Curso de Agronomia - Universidade Tecnológica Federal do Paraná Instituição: Universidade Tecnológica Federal do Paraná
Endereço: Estrada p/ Boa Esperança, km 04, s/n, Comunidade São Cristóvão, Dois Vizinhos - PR E-mail: [email protected]
Paulo Fernando Adami
Braz. J. of Develop.,Curitiba, v. 6, n.5, p.29235-29250 may. 2020. ISSN 2525-8761 Instituição: Universidade Tecnológica Federal do Paraná
Endereço: Estrada p/ Boa Esperança, km 04, s/n, Comunidade São Cristóvão, Dois Vizinhos - PR E-mail: [email protected]
ABSTRACT
The not uniform distribution of soybean plants in the sowing line can be detrimental to the agronomic performance of the crop. The aim of this work was to evaluate the effects of the variable spatial distribution of soybean plants in the sowing line on grain yield and yield components. The experiments were carried out in the Southwest of Paraná, São João and Itapejara D'Oeste cities, in the 2014/15 crop year. Five spatial distribution levels for plants were established for cultivars NS 5445 IPRO® and NS 5959 IPRO® (0, 25, 50, 75 and 100% of the variation coefficient), with 0% being the equidistant distribution of plants in the sowing line, for a population of 300,000 plants ha-1. The other percentages include the variations adopted. The analyzed variables were plant height, first pod insertion, pods per plant, grains per plant, grains per pod, thousand grain mass, grain size by sieve analysis and grain yield. The adopted experimental design was random blocks with four replicates. No statistical difference was observed for the variable spatial distribution of plants in yield components, for both cultivars. The cultivar NS 5445 showed grain yield higher than the cultivar NS5959, in both places. The highest grain yield was observed in the municipality of São João. The variation in the spatial distribution of the plants in the sowing line did not influence the productivity of both cultivars, due to their phenotypic plasticity.
Keywords: coefficient of variation, equidistant distribution of plants, Glycine max, grain yield,
quality at sowing.
RESUMO
A distribuição desuniforme das plantas de soja na linha de semeadura pode ser prejudicial ao desempenho agronômico da cultura. O objetivo do trabalho foi avaliar os efeitos da distribuição espacial variável das plantas de soja na linha de semeadura sobre a produtividade de grãos e componentes de rendimento. Os experimentos foram realizados em dois municípios do Sudoeste do Paraná, São João e Itapejara D'Oeste, na safra 2014/15. Foram estabelecidos cinco níveis de distribuição espacial para plantas para as cultivares NS 5445 IPRO® e NS 5959 IPRO® (0, 25, 50, 75 e 100% do coeficiente de variação), sendo 0% a distribuição equidistante de plantas na linha de semeadura, para uma população de 300.000 plantas ha-1. As demais percentagens contemplam as variações adotadas. As variáveis analisadas foram altura da planta, inserção de primeira vagem, vagens por planta, grãos por planta, grãos por vagem, massa de mil grãos, tamanho de grãos, por análise de peneira, e rendimento de grãos. O delineamento experimental adotado foi de blocos casualizados, com quatro repetições. Não foi observada diferença estatística da variável distribuição espacial das plantas nos componentes do rendimento, para ambas as cultivares. A cultivar NS 5445 apresentou rendimento de grãos maior que a cultivar NS5959, em ambos os locais. A maior produtividade de grãos foi observada no município de São João. A variação na distribuição espacial das plantas na linha de semeadura não influenciou a produtividade de ambas as cultivares, devido à sua plasticidade fenotípica.
Palavras-chave: coeficiente de variação, distribuição equidistante das plantas, Glycine max,
Braz. J. of Develop.,Curitiba, v. 6, n.5, p.29235-29250 may. 2020. ISSN 2525-8761
1 INTRODUCTION
In soybean production, sowing is one of the key success factors for the establishment of the plants and productivity of the crop (Copetti, 2015). According to Sangoi et al. (2010) the arrangement of plants, which is defined during sowing, can be changed according to the population, row spacing and the spatial distribution of plants in the row.
Any faults in the uniformity of spacing between plants in the row can influence the productivity of soybean (Tourino et al., 2002; Pinto, 2010). Plants badly distributed in the row drive to the inefficient use of available resources. The accumulation of plants in some points can result in higher and less branched plants with a lower individual production and a reduced stem diameter that can lead to lodging.
In contrast, empty spaces in the row can facilitate the growth of weeds that can lead to the establishment of smaller soybean plants (Pinheiro Neto et al., 2008; Copetti, 2015) and the possible insertion of lower pods.
The longitudinal distribution of seeds is mainly affected by the speed of the seeders (Delafosse, 1986). In this regard, studies have found that an increased soybean-seeding rate is associated with a reduction in planting uniformity (Bertelli et al., 2016). According to the classification proposed by Tourino and Klingensteiner (1983), quality sowing occurs when the distribution of 90% to 100% of the seeds is within a range of acceptable spacing (equidistant) between plants; good performance is obtained when there is a variation of 75 to 90% of seeds with acceptable spacing; regular performance occurs when the variation is 50% to 75%; and low quality or unsatisfactory seeding occurs when less than 50% of the seeds are distributed with acceptable spacing. In a work conducted by Cortez et al. (2006), it was observed that increasing the speed of soybean sowing reduced the acceptable spaces between plants in the row and increased the proportion of flawed and double spaces. The final plant stands, however, was not affected. This finding was also observed by Dias et al. (2009) and Jasper et al. (2011).
Studies that evaluate the variability of plant distribution in the row of soybean crops are scarce, especially in terms of correlating the quality of sowing and final grain productivity. The opposite is observed in the cultivation of corn, which has been extensively studied (Sangoi et al., 2010).
The aim of this study was to evaluate the influence of varied spatial distribution of soybean plants in the row on the components of yield and productivity of two cultivars of different maturity groups, in two sites in the state of Paraná, Brazil.
Braz. J. of Develop.,Curitiba, v. 6, n.5, p.29235-29250 may. 2020. ISSN 2525-8761
2 MATERIAL AND METHODS
Field experiments were sowing in October 2014, under no-till system, in two environments of Brazil, in the cities of São João, Paraná state, latitude 25°49'40"S, longitude 52°43'31" and altitude of 750 meters, and in Itapejara D'Oeste, Paraná state, latitude 25°58'43 "S, longitude 52°48'47" and altitude of 670 meters. The climate of the region of these Brazil cities is classified as humid subtropical (cfa), according to Köppen.
The cultivars used were the NS 5445 Intacta RR2 PRO® and NS 5959 Intacta RR2 PRO®. Cultivar NS 5445 is super precocious and has a relative maturity group rating of 5.4. Cultivar NS 5959 is precocious and has a relative maturity group rating of 5.9. Both cultivars have indeterminate growth and a good potential for branching.
Fertilization was performed according to soil analysis (Tab. 1), with a direct seeder-fertilizer
applying 330 kg ha-1 of the formulated NPK 02-18-18. After fertilization, manual sowing with the
help of wooden jigs to distribute the seeds in the row accurately, at a distance of 0.03 m between seeds was performed.
TABLE 1. Chemical characterization of the soil in the 0-20 cm layer, prior to installation of the trials in São João/PR and Itapejara D'Oeste/PR, Brazil.
São João/PR OM* pH P H+Al K Ca Mg CTC g dm-3 CaCl2 mg dm-3 ---cmolcdm-3--- 37.53 4.90 39.02 4.96 0.50 6.4 2.4 14.26 Itapejara D’Oeste/PR MO pH P H+Al K Ca Mg CTC g dm-3 CaCl2 mg dm-3 ---cmolcdm-3--- 42.89 4.90 38.36 5.35 0.33 5.90 2.10 13.68
The levels of spatial distribution were applied when the plants were in the phenological stages V1 and V2. These levels consisted of five variability levels of spatial distribution of the plants in the row (0, 25, 50, 75, and 100% of the coefficient of variation - CV), of which 0% of the CV refers to the equidistant distribution of the plants in the row for a population of 300,000 plants ha-1, by thinning; that is, 7.4 cm between plants. In the applied distribution variations, it was followed by Brazilian Association of Technical Standards - ABNT (1984), applying the concepts of flawed spacing and double or multiple spacing, to maintain the same population of plants.
Braz. J. of Develop.,Curitiba, v. 6, n.5, p.29235-29250 may. 2020. ISSN 2525-8761 The distribution variability levels were obtained with the help of wooden rulers designed according to the flawed and double seed spacing concept of the ABNT (1984), which dictates the following:
- Reference distance (Xref): distance between the seeds or seed groups, defined from the agricultural seeding density recommendation. The reference distance (Xref) is used to define the frequency classes of spacing between seeds.
- Multiple or double spacing: term that defines distances between the seeds of less than 0.5Xref. - Flawed spacing: term that defines a distance between seeds greater than 1.5Xref.
- Acceptable or normal spacing: term that defines distances between seeds within the limits of 0.5 and 1.5Xref.
The plots were composed of seven lines of four meters long, spaced at 0.45 m. The adopted experimental design was random blocks with four replicates. Crop management folling the technical recommendations for the culture.
The crops were harvested manually in the useful area of each plot, consisting of the five central lines, with three linear meters. The 0.5 meters at the end of each row and the lateral rows were discarded to define a border.
Ten random plants were removed from the useful area of each plot to determine the yield components: plant height, height of first pod insertion, number of pods per plant, number of grains per plant, and number of grains per pod. After this assessment, the grains of the selected plants were added to the useful plot to assess the thousand grain weight, grain size with sieve analysis, with apertures of 7.0, 6.5, 6.0, 5.5, and 5.0 mm, and grain productivity, extrapolating the results to kg ha -1, after correction for moisture to 12%.
The data were subjected to analysis of variance using the F-test to identify possible interactions between the sites, cultivars, and levels of variability of plant distribution in the sowing row, composing a three-factorial scheme. After the analysis of variance, the means were compared with use of Tukey test (P = 0.05).
3 RESULTS AND DISCUSSION
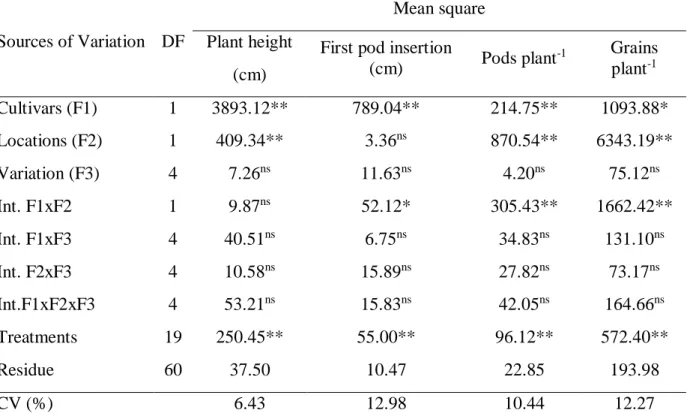
According to the analysis of variance, there was significance for plant height in the cultivar factor and the location factor. For height of the first insertion pod, number of pods per plant, and number of grains per plant, there was interaction between the factors cultivars and locations. There
Braz. J. of Develop.,Curitiba, v. 6, n.5, p.29235-29250 may. 2020. ISSN 2525-8761 was no significance or interaction in the factor variation of plant distribution in the row for any of the analyzed response variables (Tab. 2).
TABLE 2. Analysis of variance for the response variables plant height, height of first pod insertion, number of pods per plant, and number of grains per plant according to the three-factorial scheme cultivars x sites x variability in the spatial
distribution of soybean plants in the row.
Sources of Variation DF
Mean square Plant height
(cm)
First pod insertion
(cm) Pods plant -1 Grains plant-1 Cultivars (F1) 1 3893.12** 789.04** 214.75** 1093.88* Locations (F2) 1 409.34** 3.36ns 870.54** 6343.19** Variation (F3) 4 7.26ns 11.63ns 4.20ns 75.12ns Int. F1xF2 1 9.87ns 52.12* 305.43** 1662.42** Int. F1xF3 4 40.51ns 6.75ns 34.83ns 131.10ns Int. F2xF3 4 10.58ns 15.89ns 27.82ns 73.17ns Int.F1xF2xF3 4 53.21ns 15.83ns 42.05ns 164.66ns Treatments 19 250.45** 55.00** 96.12** 572.40** Residue 60 37.50 10.47 22.85 193.98 CV (%) 6.43 12.98 10.44 12.27
DF - degrees of freedom; ** significant at 1% level of probability (p< 0.01); * significant at 5% level of probability (0.01 ≤ p < 0.05); ns not significant (p ≥ 0.05).
In relation to the number of grains per pod, there was no significance and no interaction between the factors, resulting in an average of 2.5 grains per pod. For the thousand grain mass and grain yield (GY), there was an interaction between cultivars and locations, without, again, significance or interaction for the response variables according to the variability of plant distribution in the row (Tab. 3). This indicates that the uneven distribution of plants in the area, for the same population regardless of the level, did not influence the soybean yield components.
Braz. J. of Develop.,Curitiba, v. 6, n.5, p.29235-29250 may. 2020. ISSN 2525-8761
TABLE 3. Analysis of variance for the response variables number of pods per plant, thousand grain mass, and grain productivity according to the three-factorial scheme cultivars x sites x variability in the spatial distribution of soybean
plants in the row.
Sources of Variation DF
Mean square
Grains pod-1 TGM (g) Grain Yield (kg ha-1)
Cultivars (F1) 1 0.0056ns 2429.03** 3969246.40** Locations (F2) 1 0.0233ns 4698.14** 7713443.49** Varation (F3) 4 0.0093ns 30.81ns 134214.43ns Int. F1xF2 1 0.0025ns 443.68** 840040.45** Int. F1xF3 4 0.0506ns 5.22ns 78175.30ns Int. F2xF3 4 0.0427ns 10.05ns 141058.98ns Int.F1xF2xF3 4 0.0282ns 27.42ns 171686.41ns Treatments 19 0.0292ns 413.94** 769645.83** Residue 60 0.0211 35.99 103615.74 CV (%) 5.86 3.60 10.67
TGM - thousand grain mass; ** significant at 1% level of probability (p< 0.01); * significant at 5% level of probability (0.01 ≤ p < 0.05); ns not significant (p ≥ 0.05).
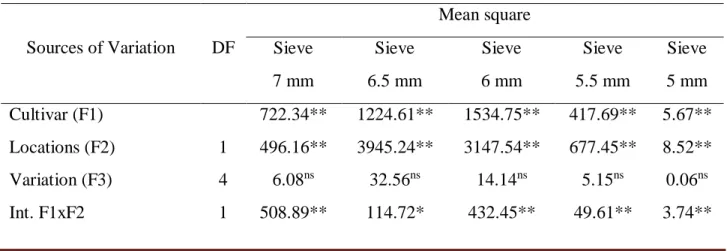
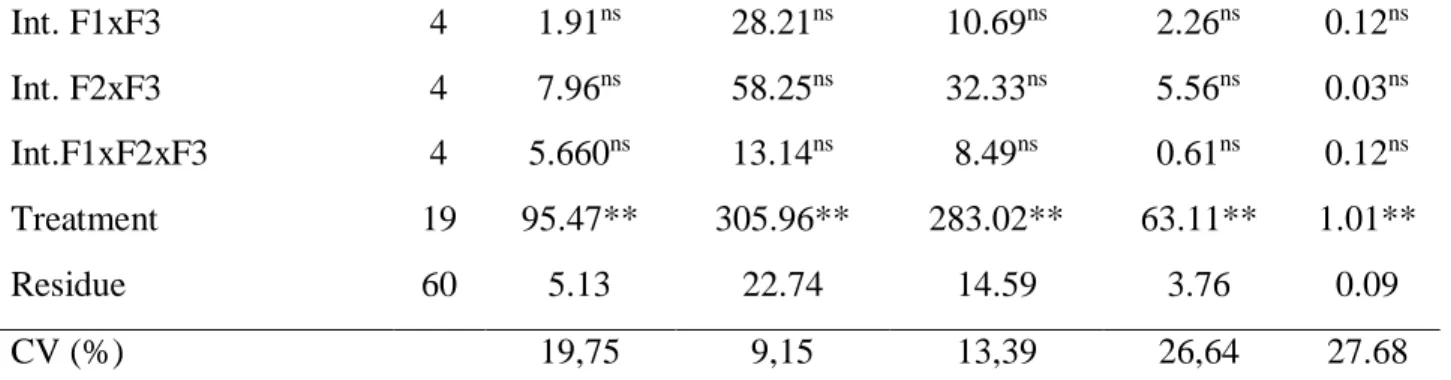
The analysis of variance of the data of grain mass using sieves with apertures of different diameters revealed an interaction only between the factors cultivar and site (Tab. 4). Grain size was not influenced by the varied distribution of the seeds in the row since no statistical significance was observed in relation to this fator.
TABLE 4. Analysis of variance for the response variable grain size according to the three-factorial scheme cultivars x sites x variability in the spatial distribution of soybean plants in the row.
Sources of Variation DF Mean square Sieve 7 mm Sieve 6.5 mm Sieve 6 mm Sieve 5.5 mm Sieve 5 mm Cultivar (F1) 722.34** 1224.61** 1534.75** 417.69** 5.67** Locations (F2) 1 496.16** 3945.24** 3147.54** 677.45** 8.52** Variation (F3) 4 6.08ns 32.56ns 14.14ns 5.15ns 0.06ns Int. F1xF2 1 508.89** 114.72* 432.45** 49.61** 3.74**
Braz. J. of Develop.,Curitiba, v. 6, n.5, p.29235-29250 may. 2020. ISSN 2525-8761 Int. F1xF3 4 1.91ns 28.21ns 10.69ns 2.26ns 0.12ns Int. F2xF3 4 7.96ns 58.25ns 32.33ns 5.56ns 0.03ns Int.F1xF2xF3 4 5.660ns 13.14ns 8.49ns 0.61ns 0.12ns Treatment 19 95.47** 305.96** 283.02** 63.11** 1.01** Residue 60 5.13 22.74 14.59 3.76 0.09 CV (%) 19,75 9,15 13,39 26,64 27.68
** significant at 1% level of probability (p< 0.01); * significant at 5% level of probability (0.01 ≤ p < 0.05); ns not significant (p ≥ 0.05).
The results of the analysis of variance presented in tables 2 and 3, more specifically for the response variables pods per plant, grains per pod, thousand grain mass, and GY, corroborate with the findings of Jasper et al. (2011). These authors found no differences for the soybean yield components with the increased speed of the tractor-seeder assembly. In this study, although a seeder was not used since sowing was manual, the proposal simulated the variability of plant distribution in the row, which can be caused by increasing the speed of the assembly or by badly adjusting the seeder.
In a study conducted by Cortez et al. (2006) it was found that increasing the speed of sowing reduced the amount of acceptable spacing and increased the amount of flawed and double spacing. On average, the results were 59.25% acceptable spacing, 22.60% flawed spacing, and 18.60% double spacing. Reis et al. (2007) agreed in part with the results observed by the above authors. They found that increasing the speed also increased the percentage of flawed and double spacing. However, this was not found for the highest sowing seed, but in the intermediate speed, 7.7 km h-1, at an amplitude between 3.8 and 9.5 km h-1.
The height of the first pod insertion was higer for cultivar NS 5959 than in cultivar NS 5445 for both trial locations. In the comparison between locations, for each isolated cultivar, no influence of the environment was detected on the evaluated trait (Tab. 5).
TABLE 5. Average height of first pod insertion according to the interaction between the factors cultivars and sites.
Cultivars
Height of first pod insertion (cm)
São João Itapejara D’Oeste
NS 5445 21.20 bA* 22.41 bA
NS 5959 29.10 aA 27.07 aA
CV (%) 12.98
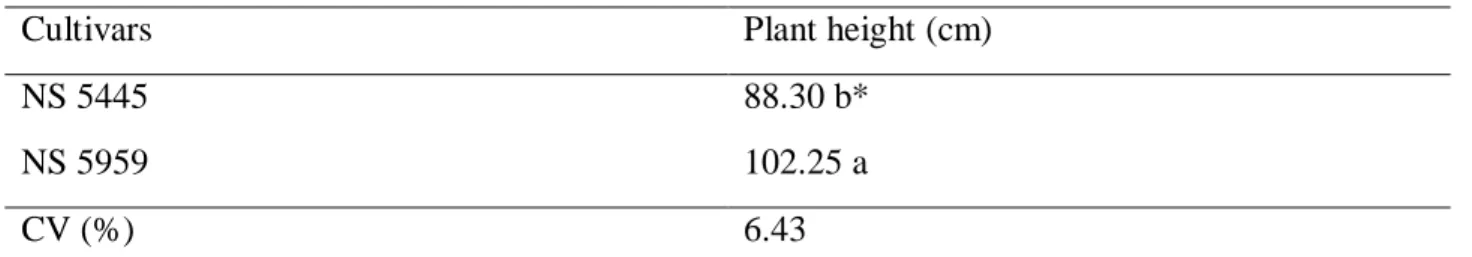
Braz. J. of Develop.,Curitiba, v. 6, n.5, p.29235-29250 may. 2020. ISSN 2525-8761 In relation to the comparison of plant height between the cultivars, the plants were higher in NS 5959 than in NS 5445 (Tab. 6). This result reveals a possible relationship with the relative maturity group (MG) of the cultivars. Cultivar NS 5959 has MG 5.9, that is, its cycle tends to be more extended than NS 5445, with MG 5.4.
TABLE 6. Average plant height for the different cultivars tested.
Cultivars Plant height (cm)
NS 5445 88.30 b*
NS 5959 102.25 a
CV (%) 6.43
*Averages followed by different letters differ from each other according to the Tukey test, at a 5% probability.
In the comparison between sites, both cultivars were higher in Itapejara D'Oeste than in São João (Tab. 7). This can be partly related to the altitude of the locations. Itapejara D'Oeste is located at a lower altitude than São João. Normally, higher altitudes tend to have lower temperatures during the culture cycle, which may contribute to the lesser growth and lower height of the plants.
TABLE 7. Average plant height for the different trial sites.
Sites Plant height (cm)
São João 93.01 b*
Itapejara D’Oeste 97.54 a
CV (%) 6.43
*Averages followed by different letters differ from each other according to the Tukey test, at a 5% probability.
The variable plant distribution in the row did not influence plant height. This result does not agree with the results found by Pinheiro Neto et al. (2008). According to the authors, the accumulation of plants in a few spots, characterized by double spacing, can lead to the development of higher plants. Contrarily, empty spaces in the row, characterized by flawed spacing, lead to the development of smaller plants.
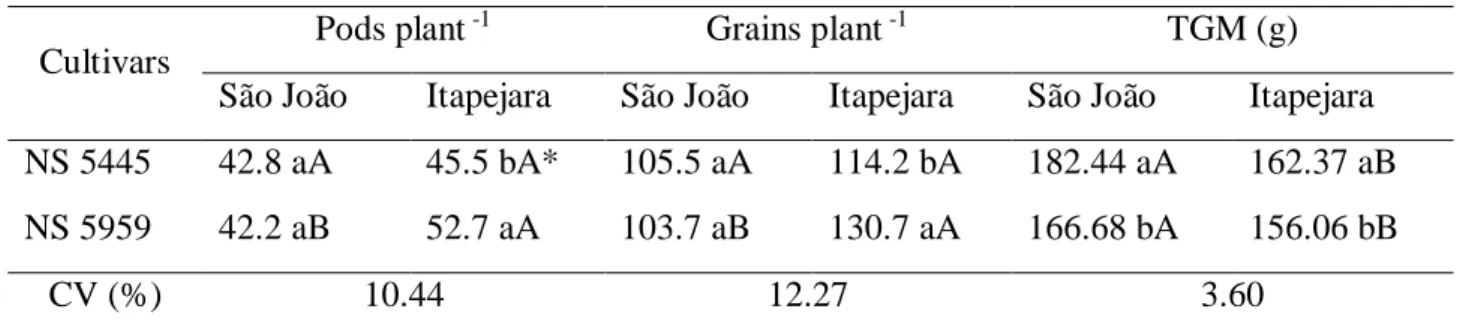
The number of pods per plant did not differ between cultivars in the municipality of São João (Tab. 8). In Itapejara D'Oeste, however, cultivar NS 5959 had a higher number of pods in comparison to NS 5445. The latter cultivar did not differ for this feature between the two locations.
Braz. J. of Develop.,Curitiba, v. 6, n.5, p.29235-29250 may. 2020. ISSN 2525-8761
TABLE 8. Average number of pods per plant, number of grains per plant, and thousand grain mass (TGM) according to the interaction between the cultivars and sites.
Cultivars
Pods plant -1 Grains plant -1 TGM (g)
São João Itapejara São João Itapejara São João Itapejara
NS 5445 42.8 aA 45.5 bA* 105.5 aA 114.2 bA 182.44 aA 162.37 aB
NS 5959 42.2 aB 52.7 aA 103.7 aB 130.7 aA 166.68 bA 156.06 bB
CV (%) 10.44 12.27 3.60
* Averages followed by different lowercase and uppercase letters in the line differ from each other according to the Tukey test, at a 5% probability.
Similarly, in the response variable number of grains per plant, no differences were observed between the cultivars in the municipality of São João. In Itapejara D'Oeste, the number of grains per plant was greater in cultivar NS 5959. In the site comparison, this same cultivar had a higher number of grains per plant in Itapejara D'Oeste than in São João.
Cultivar NS 5445 had a higher thousand grain mass compared to cultivar NS 5959, both in São João and in Itapejara D'Oeste. In the comparison between sites, for each cultivar, the thousand grain mass was greater for both materials in São João (Tab. 8).
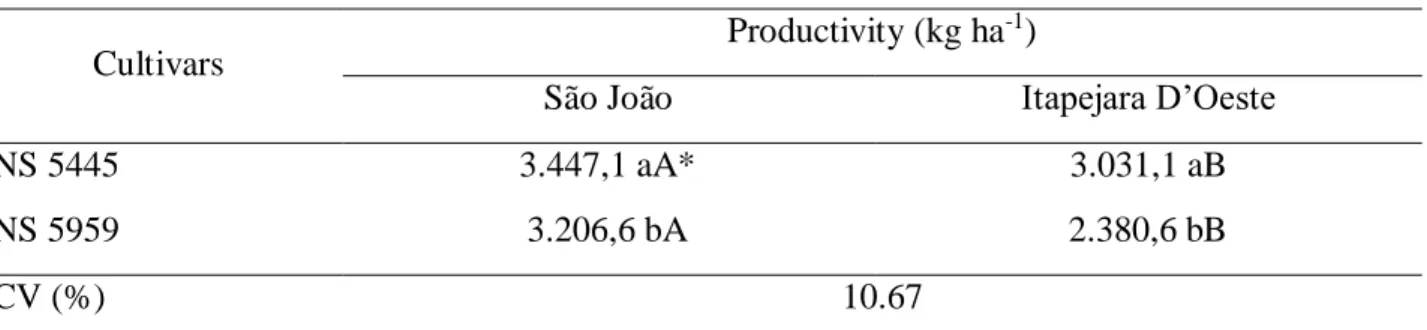
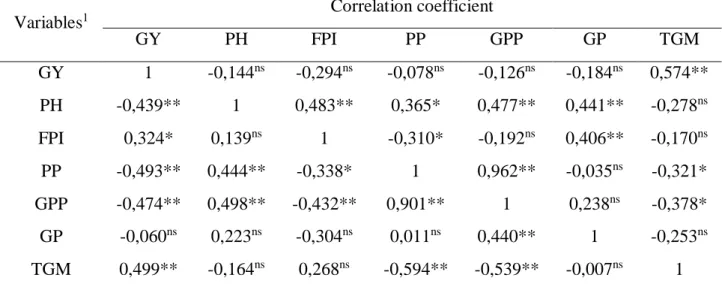
A greater grain mass is associated with appropriate conditions during the filling phase. In this case, a milder air temperature positively contributes to a lower respiratory rate of the plants and a better targeting of photoassimilates to the grains. Considering that São João has a higher altitude, usually associated with temperatures, this factor may have contributed positively to appropriate grain filling, which results in a greater mass. Moreover, another factor that contributes to greater grain mass is the smaller amount of grains per plant, as observed in cultivar NS 5445 of Itapejara D'Oeste. The occurrence of fewer grains in the plants of this cultivar may be reducing the competition of these drains by the photoassimilates produced in the leaves, resulting in a greater accumulation of biomass. GY was greater in cultivar 5445 NS in both sites (Tab. 9). In the comparison, regardless of the cultivar, the trial conducted in São João obtained a greater GY. The analysis of Pearson’s Correlation Coefficient (Tab. 10) revealed a degree of association between the studied variables and showed how the yield components relate with each other, especially how they influence the GY of the cultivars.
Braz. J. of Develop.,Curitiba, v. 6, n.5, p.29235-29250 may. 2020. ISSN 2525-8761
TABLE 9. Average grain productivity according to the interaction between cultivars and sites.
Cultivars
Productivity (kg ha-1)
São João Itapejara D’Oeste
NS 5445 3.447,1 aA* 3.031,1 aB
NS 5959 3.206,6 bA 2.380,6 bB
CV (%) 10.67
* Averages followed by different lowercase and uppercase letters in the line differ from each other according to the Tukey test, at a 5% probability.
The coefficients of correlation between GY and the yield components showed significance in the pairs GY x TGM (thousand grain mass), for cultivar NS 5445, and in the pairs GY x PH (plant height), GY x FPI (first pod insertion), GY x PP (pods per plant), GY x GPP (grains per plant), and GY x TGM, for cultivar NS 5959.
For the two studied cultivars, it was found that the number of grains and number of pods per plant negatively correlated with the thousand grain mass. In contrast, the thousand grain mass showed a positive correlation with the GY of the cultivars. Since cultivar NS 5445 had fewer pods and less grains per plant in comparison with cultivar NS 5959, we can infer that the reduction of grains and pods in the plants increased the thousand grain mass (Tab. 8), which, in turn, had a positive effect on GY.
In relation to cultivar NS 5959, the higher number of grains and pods per plant, compared to cultivar NS 5445, can justify the lower thousand grain mass. When a plant produces more grains, the photoassimilates are distributed to a greater number of drains, which can result in a lower grain mass (Mundstock and Thomas, 2005). In this study, we observed the indirect influence of the number of grains on productivity, due to its effect in the reduction of thousand grain mass. The thousand grain mass is one of the main components of productivity, and several studies have confirmed the positive correlation between these two variables (Barili et al., 2011; Dalchiavon and Carvalho, 2012).
Braz. J. of Develop.,Curitiba, v. 6, n.5, p.29235-29250 may. 2020. ISSN 2525-8761
TABLE 10. Pearson’s Correlation Coefficient between the seven evaluated variables in two soybean cultivars, NS 5445 Intact RR2 PRO® (top diagonal) and NS 5959 Intact RR2 PRO® (bottom diagonal) planted in two cities of Paraná,
Brazil. Variables1 Correlation coefficient GY PH FPI PP GPP GP TGM GY 1 -0,144ns -0,294ns -0,078ns -0,126ns -0,184ns 0,574** PH -0,439** 1 0,483** 0,365* 0,477** 0,441** -0,278ns FPI 0,324* 0,139ns 1 -0,310* -0,192ns 0,406** -0,170ns PP -0,493** 0,444** -0,338* 1 0,962** -0,035ns -0,321* GPP -0,474** 0,498** -0,432** 0,901** 1 0,238ns -0,378* GP -0,060ns 0,223ns -0,304ns 0,011ns 0,440** 1 -0,253ns TGM 0,499** -0,164ns 0,268ns -0,594** -0,539** -0,007ns 1
1 P: productivity (kg ha-1); PH: plant height (cm); FPI: first pod insertion (cm); PP: pods per plant; GPP: grains per plant; GP: grains per pod; TGM: thousand grain mass (g). ns, * * and *: not significant and significant at 1% and 5% probability via T-Test.
Table 11 shows the percentages of grain mass in sieves with apertures of different diameters used to verify the effects of the genotypes and environments on grain size. In general, for the sieves with larger apertures (7 and 6.5 mm), cultivar NS 5445 had a greater percentage of retained grain mass compared to cultivar NS 5959, in both locations. However, for the sieves with apertures of 6 mm to 5 mm in diameter, cultivar NS 5445 had lower percentages of grain retention compared to NS 5959. These results demonstrate that cultivar NS 5445 had larger grains that cultivar NS 5959, both in São João and in Itapejara D'Oeste. The greater grain size associated with the greater thousand grain mass (Tab. 8) observed in this cultivar can explain it is superior grain productivity (Tab. 9).
TABLE 11. Average percentage of grain mass in sieves of 5 mm to 7 mm, according to the interaction between cultivars and sites.
Cultivars Sieve 7 mm (%) Sieve 6.5 mm (%) Sieve 6 mm (%) Sieve 5.5 mm (%) Sieve 5 mm (%) SJ IO SJ IO SJ IO SJ IO SJ IO NS 5445 19.5 aA*
9.5aB 61.8aA 50.2aB 15.5bB 32.7bA 2.9bB 7.1bA 0.3aB 0.5bA
NS 5959 8.4
bA
Braz. J. of Develop.,Curitiba, v. 6, n.5, p.29235-29250 may. 2020. ISSN 2525-8761
CV (%) 19.75 9.15 13.39 26.64 27.68
SJ - São João; IO - Itapejara D’Oeste; *Averages followed by different lowercase and uppercase letters in the line differ from each other according to the Tukey test, at a 5% probability.
In the location comparison, the grains produced in São João had a greater grain mass in the sieves with larger apertures (7 and 6.5 mm), reaching 81.33% and 64.84% in cultivars NS 5445 and NS 5959, respectively. However, in the sieves with smaller apertures (6 mm to 5 mm), the percentages of retained grain mass in São João were lower than the percentages observed for Itapejara D'Oeste. The concentration of grains in the sieves with 7 mm and 6.5 mm apertures reveals the larger size of grains that, associated with the greater thousand grain mass (Tab. 8) recorded in São João in both cultivars, justify the superior performance in productivity of this site.
According to the data in Table 3, the variability of plant distribution in the row did not influence GY, corroborating the findings of Grubert (2016). The author adopted the same concepts of double and flawed spacing in soybean crops in his study. This result was attributed to the plasticity of the culture, which, by means of morphological changes, can compensate for variations in the row (Pires et al., 2000).
In corn crops, according to Sangoi et al. (2012), for every 10% of variation, crop productivity
drops between 64 and 83 kg ha-1, for a spacing of 0.4 m between the rows, caused by the reduced
number of grains per m². A similar result was observed by Horn (2011). However, according to both authors, this result was not observed in a spacing of 0.8 m between the lines, possibly because in this condition there was a higher number of plants per linear meter in comparison with the 0.4 m spacing. With regard to soybean, the number of plants per linear meter is superior to that of corn. Furthermore, the phenotypic plasticity of the soybean may have contributed decisively to the absence of any difference caused by the variable plant spacing.
The main purpose of this study was to quantify GY as the distribution of the plants in the row was increased by varying the acceptable spacing percentages from 0 to 100%. This characteristic is directly related to the quality of planting, which requires the use of well-adjusted seeders, preferably modern, and working at reduced speeds, to obtain a stand of plants that is as uniformly distributed as possible, and correlating this factor to productivity (Schuch and Peske, 2008). However, this was not confirmed even after using cultivars of varying relative maturity groups and installing trials in different municipalities (Tab. 3). In this study, regardless of the varied distribution of plants in the line, the soybean crops maintained a stable productivity, contrary to what many authors have observed
Braz. J. of Develop.,Curitiba, v. 6, n.5, p.29235-29250 may. 2020. ISSN 2525-8761 in corn crops (Mello et al., 2007; Sangoi et al. 2011; Santos et al., 2011). This may be related to the plasticity of soybean and its condition of compensating for flaws, with greater branching, and double spacing, resulting in a greater height, for the same population of plants.
Therefore, it is understood that, although sowing should be performed with the highest quality, soybean involves some deviations that do not reduce GY, regardless of the relative maturity group of cultivars, as observed in the present study, in which case the plasticity of the cultivars and the average productivity was ultimately considered.
4 CONCLUSION
The variable spatial distribution of plants in the row did not influence the components of yield and GY of the soybean grains, regardless of the relative maturity group of the cultivars and the evaluated sites.
Cultivar NS 5445 was more productive in both sites in comparison with cultivar NS 5959, and the highest GY for both cultivars was observed in São João.
ACKNOWLEDGMENTS
To Conselho Nacional de Desenvolvimento Científico e Tecnológico (CNPq), Coordenação de Aperfeiçoamento de Pessoal de Nível Superior (CAPES) and Apoio ao Desenvolvimento Científico e Tecnológico do Paraná (Fundação Araucária) for granting scholarships and other financial aid.
REFERENCES
Barili, L. D.; Vale, N. M. do; Morais, P. P. P.; Baldissera, J. N. da C.; Almeida, C. B. de; Rocha, F. da; Valentini, G.; Bertoldo, J. G.; Coimbra, J. L. M. and Guidolin, A. F. 2011. Correlação fenotípica entre componentes do rendimento de grãos de feijão comum (Phaseolus vulgaris L.). Semina.
Ciências Agrárias, 32(4):1263-1274. http://www.uel.br/revistas/uel/index.php/
semagrarias/article/viewFile/4813/8891.
Bertelli, G. A.; Jadoski, S. O.; Dolato, M. da L.; Rampim, L. and Maggi, M. F. 2016. Desempenho da plantabilidade de semeadoras pneumática na implantação da cultura da soja no cerrado piauiense.
Braz. J. of Develop.,Curitiba, v. 6, n.5, p.29235-29250 may. 2020. ISSN 2525-8761
Brazilian Journal of Applied Technology for Agricultural Science, 9(1):91-103.
file:///C:/Users/Carlos%20Andr%C3%A9%20Bahry/Downloads/4044-19841-1-PB.pdf.
Brazilian Association of Technical Standards – ABNT. Projeto de norma 04:015.06-004 - Semeadoras de precisão: ensaio de laboratório - método de ensaio. São Paulo. 1984. 26p.
Copetti, E. 2015. Os desafios da semeadura. Seed News, Pelotas, RS, Brazil. http://www. seednews.inf.br/_html/site/content/reportagem_capa.
Cortez, J. W.; Furlani, C. E. A.; Silva, R. P. da and Lopes, A. 2006. Distribuição longitudinal de sementes de soja e características físicas do solo no plantio direto. Engenharia Agrícola, 26(2):502-510. https://www.scielo.br/pdf/eagri/v26n2/19.pdf.
Dalchiavon, F. C. and Carvalho, M. P. 2012. Correlação linear e espacial dos componentes de produção e produtividade da soja. Semina. Ciências Agrárias, 33(2): 541-552. http://www.uel.br/ revistas/uel/index.php/semagrarias/article/viewFile/6441/10471.
Delafosse, R. M. 1986. Máquinas sembradoras de grano gruesso. Oficina Regional de 1ª FAO para a América Latina y el Caribe. Santiago-Chile. FAO. 48p.
Dias, V. de O.; Alonço, A. dos S.; Baumhardt, U. B. and Bonotto, G. J. 2009. Distribuição de sementes de milho e soja em função da velocidade e densidade de semeadura. Ciência Rural, 39:1721-1728. https://www.scielo.br/pdf/cr/v39n6/a218cr1046.pdf.
Grubert, da V. Distribuição longitudinal e produtividade de soja em sistema de integração lavoura-pecuária. Curitibanos-PR: Federal University of Santa Catarina, 2016. 23p. Course Conclusion Work (Agronomy graduation). Federal University of Santa Catarina, 2016.
Horn, D. 2011. Qualidade de plantio: uma nova abordagem. Informative report. 3:17-19. http://www.pioneersementes.com.br/media-center/artigos/126/qualidade-de-plantio-uma-nova-abordagem.
Jasper, R.; Jasper, M.; Assumpção, P. S. M.; Rocil, J.; Garcia, L. C. 2011. Velocidade de semeadura da soja. Engenharia Agrícola, 31(1):102-110. https://www.scielo.br/pdf/eagri/v31n1/ v31n1a10.pdf. Mello, A. J. R.; Furlani, C. E. A; Silva, R. P.; Lopes, A. and Borsatto, E. A. 2007. Produtividade de híbridos de milho em função da velocidade de semeadura. Engenharia Agrícola, 27(2):479-486. https://www.scielo.br/pdf/eagri/v27n2/a17v27n2.pdf.
Mundstock, C. M. and Thomas, A. L. 2005. Soja: fatores que afetam o crescimento e rendimento de grãos. 1. ed. Porto Alegre: EVANGRAF. 31p.
Pinheiro Neto, R.; Braccini, A. L.; Scapim, C. A.; Bortolotto, V. C. and Pinheiro, A. C. 2008. Desempenho de mecanismos dosadores de sementes em diferentes velocidades e condições de
Braz. J. of Develop.,Curitiba, v. 6, n.5, p.29235-29250 may. 2020. ISSN 2525-8761 cobertura de solo. Acta Scientiarum. Agronomy, 30(supl.): 611-617. https://www.scielo.br/pdf/ asagr/v30sspe/v30sspea02.pdf.
Pinto, J. F. 2010. Comportamento de plantas de soja frente a falhas e duplas dentro de uma população. Pelotas-RS. Federal University of Pelotas, 2010. 43p. Doctoral Thesis (Programa de Pós-Graduação em Ciência e Tecnologia de Sementes). Federal University of Pelotas, 2010.
Pires, J. L. F.; Costa, J. A.; Thomas, A. L. and Maehler, A. R. 2000. Efeito de populações e espaçamentos sobre o potencial de rendimento da soja durante a ontogenia. Pesquisa Agropecuária Brasileira, 35(8):1541-1547. https://www.scielo.br/pdf/pab/v35n8/v35n8a06.pdf.
Reis, E. F.; Moura, J. R.; Delmond, J. G. and Cunha, J. P. A. R. 2007. Características operacionais de uma semeadora-adubadora de plantio direto na cultura da soja (Glycine max (L.) Merril). Revista Ciências Técnicas Agropecuárias, 16(3):70-75. https://www.redalyc.org/pdf/ 932/93216315.pdf. Sangoi, L.; Schmitt, A.; Vieira, J.; Picoli, J. R. G. J.; Souza, C. A.; Casa, R. T.; Schenatto, D. E.; Giordani, W.; Boniatti, C. M.; Machado, G. C. and Horn, D. 2012. Variabilidade na distribuição espacial de plantas na linha e rendimento de grãos de milho. Revista Brasileira de Milho e Sorgo, 11(3):268-277. http://rbms.cnpms.embrapa.br/index.php/ojs/article/view/388/pdf_40.
Sangoi, L.; Schweitzer, C.; Silva, P. R. F.; Schmitt, A.; Vargas, V. P.; Casa, R. T. and Souza, C. A. 2011. Perfilhamento, área foliar e produtividade do milho sob diferentes arranjos espaciais. Pesquisa Agropecuária Brasileira, 46(5):609-616. https://www.scielo.br/pdf/pab/v46n6/ a06v46n6.pdf. Sangoi, L.; Silva, P. R. F. and Argenta, G. Estratégias de manejo do arranjo de plantas para aumentar o rendimento de grãos do milho. 1. ed. Lages-SC: GRAPHEL, 2010a. 64p.
Santos, A. J. M.; Gamero, C. A.; Oliveira, R. B. de and Villen, A. C. 2011. Análise espacial da distribuição longitudinal de sementes de milho em uma semeadora-adubadora de precisão. Bioscience Journal, 27(1):16-23. http://www.seer.ufu.br/index.php/biosciencejournal/article/ view/7355/6836. Schuch, L. O. B. and Peske, S. T. 2008. Falhas e duplos na produtividade. Revista Seed News, Pelotas/RS, 2008. http://www.seednews.inf.br/_html/site/content/reportagem_capa.
Tourino, M. C. C.; Rezende, P. M. and Salvador, N. 2002. Espaçamento, densidade e uniformidade de semeadura na produtividade e características agronômicas da soja. Pesquisa Agropecuária Brasileira, 37(8):1071-1078. https://www.scielo.br/pdf/pab/v37n8/11666.pdf.