FIRM SOCIAL CAPITAL AS COMPETITIVE ASSET:
THE CASE OF LIPARI CONSULTING
André Paulino Silva
Dissertation submitted as part of a partial requirement for the conferral of Master in Management of Services and Technology
Supervisor: Prof. Giovanni Perrone
Università Degli Studi di Palermo, Dipartimento dell'Innovazione Industriale e Digitale
Co-supervisor:
Prof. João Manuel Vilas Boas da Silva
ISCTE Business School, Departamento de Marketing, Operações e Gestão Geral
i
ABSTRACT
Social network analysis is increasingly becoming a subject of interest in many diverse areas of study. With the development of online social networks and the high volume of available information online, it is relevant to use this information to better understand how firms are connected to each other and how that can become a competitive advantage.
This dissertation aims at studying a specific firm, dividing the analysis into two different contexts. One involving the collaborators of the company and their contacts. Another looking into the direct connections of the company.
For data collection, it was used LinkedIn for the first case and information given by the firm for the second part. For the individual network, the data collection resulted in more than 13000, which resulted in around 400 companies after being filtered according to criteria such as position of the person in the company, size, age and sector of the company.
The analysis was done using descriptive statistics and the software UCINET to create the representation of the networks and then to further analyze centrality measurements.
The results indicate that this company’s collaborators have very similar profiles; that most of the connections are within 4 areas of business; that most of the contacts exist within Italy; that most of the companies are in the market between 20 to 50 years.
The conclusions taken show what kind of social capital management strategy the company has and what kind of steps it could take to further develop their business.
Key-words: Social Network Analysis; Social Capital; UCINET; Strategy; Information;
JEL Classification:
Y40 Dissertations
L14 Transactional Relationships; Contracts and Reputation; Networks L20 General
L25 Firm Performance: Size, Diversification, and Scope L80 General
iii
AKNOWLEDGMENTS
I would like to dedicate this space to all the people that, somehow, helped me to be able to finish this dissertation. The ones that kept saying just finish it so we can go for a drink, the ones that couldn’t hear me anymore saying that I must finish this, the ones that kept asking “but that isn’t done yet?”.
A special thanks to professor Giovanni Perrone, for introducing me to the company, suggesting the theme and helping with its development.
To Mariangela Piazza and Erica Mazzola for the close and constant help during my time in Palermo.
To Alessio Vella, my contact within the company that provided me with the information I needed and pushed the others to help me as well.
To everyone in Lipari Consulting for making this dissertation possible by giving me access to their connections in LinkedIn and for all their best wishes.
To professor João Vilas-Boas for keeping me aware of the time and work I still had in front of me and for contributing with all his knowledge and experience.
To all my friends that gave me all the extra information I needed but had no patience to look for it.
And a very special thanks to my parents that provided me with all the means I required to do this thesis and helped me when I needed the most.
v CONTENTS CHAPTER 1 – INTRODUCTION ... 1 1.1 THEME CONTEXTUALIZATION ... 1 1.2 MAIN OBJECTIVE ... 3 1.3 SPECIFIC OBJECTIVES ... 3 1.4 RESEARCH QUESTIONS ... 3 1.5 SCOPE ... 4 1.6 STRUCTURE ... 4
CHAPTER 2 – LITERATURE REVIEW ... 5
2.1 INTRODUCTION ... 5
2.2 SOCIAL CAPITAL ... 5
2.3 SOCIAL NETWORKS ... 6
2.4 EMBEDDEDNESS ... 6
2.5 SOCIAL NETWORK ANALYSIS (SNA) ... 7
2.6 CONCEPTS AND MEASUREMENTS IN SNA ... 9
2.7 BENEFITING FROM SOCIAL NETWORKS ... 11
2.7.1 Types of Information ... 11
2.7.2 Types of Companies ... 14
2.7.3 Benefiting from an individual’s social capital. ... 15
2.8 SNA IN HUMAN RESOURCES MANAGEMENT (HRM) ... 17
CHAPTER 3 – DATA ANALYSIS ... 19
3.1 LIPARI CONSULTING (LC) ... 19
3.2 DATA COLLECTION AND PROCESSING ... 20
3.3 PERSONNEL NETWORK ANALYSIS ... 21
3.3.1 Overall Descriptive Statistic ... 22
3.3.2 Top 10 Sectors by Age ... 24
vi
3.3.4 Individual Analysis ... 29
3.4 B2B NETWORK ANALYSIS ... 32
3.4.1 Overall Descriptive Statistics ... 33
3.4.2 Network Analysis ... 36
CHAPTER 4 – CONCLUSION ... 42
4.2 DISCUSSION ... 42
4.2.1 Recommendations ... 44
4.3 LIMITATIONS ... 45
4.3.1 Suggestions for Further Studies ... 46
REFERENCES ... 47
APPENDIX ... 53
APPENDIX 1 – TUTORIAL TO RETRIEVE INFORMATION (ITALIAN) ... 53
APPENDIX 2 – SAMPLE OF COLLECTED DATA ... 56
APPENDIX 3 – LINKEDIN: COMPANY SIZE CODES ... 57
APPENDIX 4 – COMPLETE PERSON-TO-COMPANY NETWORK ... 58
APPENDIX 5 – FULL INDIVIDUAL ANALYSIS ... 59
APPENDIX 6 - B2B NETWORK – SIZE ... 80
APPENDIX 6.1 – LEGENDS ... 81
APPENDIX 7 - B2B NETWORK - ENHANCED VERSION ... 82
vii
INDEX OF FIGURES
Figure 1 - Top 10 Countries ... 22
Figure 2 - Top 10 Sector ... 23
Figure 3 - Number of companies per age ... 23
Figure 4 - Number of companies by size ... 24
Figure 5 - Complete person-to-company network (larger version in appendix 4) ... 27
Figure 6 - Pareto Analysis by number of connections (Degree) ... 29
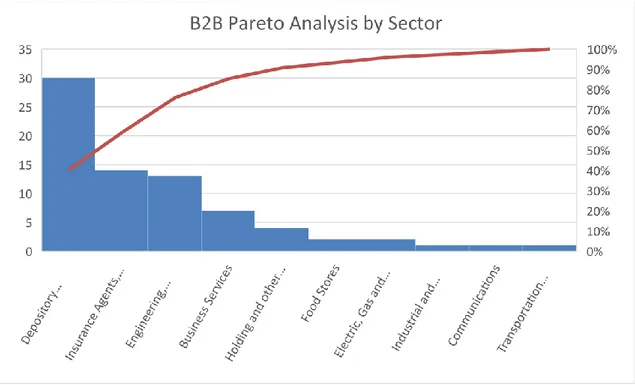
Figure 7 - B2B Pareto Analysis by Sector ... 34
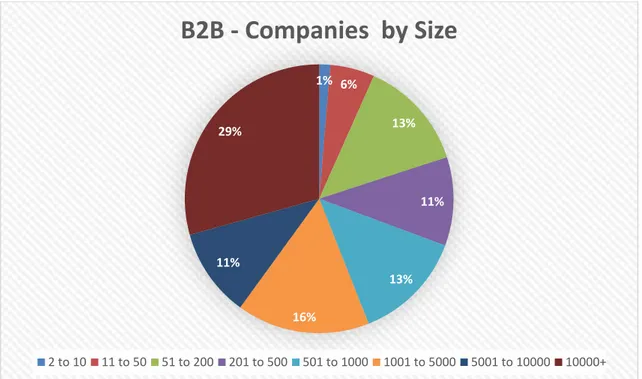
Figure 8 - B2B: Companies by Size ... 35
Figure 9 - B2B: Pareto Analysis by Age ... 35
Figure 10 - B2B Network – Size (larger version and legends in appendix 6 and 6.1) ... 36
Figure 11 - B2B Network - Enhanced version (larger version and legends in appendix 7 and 7.1) ... 38
viii
INDEX OF TABLES
Table 1 - Top 10 Sectors by Age - 0 to 2 ... 24
Table 2 - Top 10 Sectors by Age - 2 to 5 ... 25
Table 3 - Top 10 Sectors by Age - 5 to 10 ... 25
Table 4 - Top 10 Sectors by Age - 10 to 20 ... 25
Table 5 - Top 10 Sectors by Age - 20 to 50 ... 26
Table 6 - Top 10 Sectors by Age - 50 to 100 ... 26
Table 7 - Top 10 Sectors by Age - 100+ ... 26
Table 8 - Top 15 Nodes by Degree ... 28
Table 9 - Top 5 B2B Companies by Degree ... 36
Table 10 - Connections to firms with more than 10000 employees ... 37
Table 11 - Connections to firms with more than 5000 employees ... 37
Table 12 - Top by Degree and Betweenness ... 39
Table 13 - Top by Closeness and Eigenvector ... 39
ix
INDEX OF FIGURES IN APPENDIX
Figure_A 1 - LinkedIn initial screen ... 53
Figure_A 2 - Account: Settings and Privacy ... 53
Figure_A 3 - Personal data archive ... 54
Figure_A 4 - Request archive ... 54
Figure_A 5 - Input password ... 55
Figure_A 6 - Complete Person-to-Company Network: Large version ... 58
Figure_A 7 - Knowledge by size – Giovanni Lipari ... 59
Figure_A 8 - Knowledge by age – Giovanni Lipari ... 59
Figure_A 9 - Pareto Analysis by sector - Giovani Lipari ... 60
Figure_A 10 - Knowledge by age - Gianvito Parrinello ... 61
Figure_A 11 - Knowledge by size - Gianvito Parrinello ... 61
Figure_A 12 - Pareto Analysis by sector - Gianvito Parrinello ... 61
Figure_A 13 - Knowledge by age - Chiara Titone ... 62
Figure_A 14 - Knowledge by size - Chiara Titone ... 62
Figure_A 15 - Pareto Analysis by sector - Chiara Titone ... 63
Figure_A 16 - Knowledge by age - Gabriele Biddeci ... 64
Figure_A 17 - Knowledge by size - Gabriele Biddeci ... 64
Figure_A 18 - Pareto Analysis by sector - Gabriele Biddeci ... 64
Figure_A 19 - Knowledge by age - Salvatore Pampinella ... 65
Figure_A 20 - Knowledge by size - Salvatore Pampinella ... 65
Figure_A 21 - Pareto Analysis by sector - Salvatore Pampinella ... 66
Figure_A 22 - Knowledge by age - Alessandro Messina ... 67
Figure_A 23 - Knowledge by size - Alessandro Messina ... 67
Figure_A 24 - Pareto Analysis by sector - Alessandro Messina ... 67
Figure_A 25 - Knowledge by age - Antonella Buffa ... 68
Figure_A 26 - Knowledge by size - Antonella Buffa ... 68
Figure_A 27 - Pareto Analysis by sector - Antonella Buffa... 68
Figure_A 28 - Knowledge by age - Arianna Pace ... 69
Figure_A 29 - Knowledge by size - Arianna Pace ... 69
Figure_A 30 - Pareto Analysis by sector - Arianna Pace ... 69
Figure_A 31 - Knowledge by size - Federico Colleti ... 70
x
Figure_A 33 - Pareto Analysis by sector - Federico Colleti... 71
Figure_A 34 - Knowledge by age - Alessio Vella... 72
Figure_A 35 - Knowledge by size - Alessio Vella ... 72
Figure_A 36 - Pareto Analysis by Sector - Alessio Vella ... 72
Figure_A 37 - Knowledge by age - Daniele Erra ... 73
Figure_A 38 - Knowledge by size - Daniele Erra ... 73
Figure_A 39 - Pareto Analysis by sector - Daniele Erra ... 73
Figure_A 40 - Knowledge by age - Fabiana Lombardo ... 74
Figure_A 41 - Knowledge by size - Fabiana Lombardo ... 74
Figure_A 42 - Pareto Analysis by sector - Fabiana Lombardo ... 74
Figure_A 43 - Knowledge by age - Tiziana Mondello ... 75
Figure_A 44 - Knowledge by size - Tiziana Mondello ... 75
Figure_A 45 - Pareto Analysis by sector - Tiziana Mondello ... 76
Figure_A 46 - Knowledge by age - Raffaele Alberino ... 77
Figure_A 47 - Knowledge by size - Raffaele Alberino ... 77
Figure_A 48 - Pareto Analysis by sector - Raffaele Alberino ... 77
Figure_A 49 - Knowledge by age - Pasquale Gravina ... 78
Figure_A 50 - Knowledge per size - Pasquale Gravina ... 78
Figure_A 51 - Pareto Analysis by sector - Pasquale Gravina ... 79
Figure_A 52 - B2B network ... 80
xi
INDEX OF TABLES IN APPENDIX
Table_A 1 - Sample of collected data: Connections ... 56
Table_A 2 - LinkedIn company size codes Source: LinkedIn ... 57
Table_A 3 - Legends for B2B network - Size ... 81
1
CHAPTER 1 – INTRODUCTION
1.1 THEME CONTEXTUALIZATION
In basic terms, a firm exists to produce goods or services, sell to customers and generate profit. Historically, this was initially done by focusing solely in mass production with low costs as the demand was high enough to cover all the existing offer. With the development of production techniques and the entrance of more companies in business, in 1970 this reality changed with the offer becoming higher than the demand, originating a need to compete for a market share (Silva, 1993). Following this change, competitive advantage has become a great issue for strategy, with theories ranging from an external (Porter, 1985) to an internal (Barney, 1991) perspective of a firm.
Porter (1985) asserts that by observing and analyzing the industry to which a company belongs and acting according to the threats and opportunities presented, it is possible to achieve a competitive advantage, or at least stand at the same level as its competitors. On the other hand, Barney (1991) looks at the company’s resources to explain how one can achieve a competitive advantage. The author defends that, by having resources that are valuable, rare, difficult to copy and the organizational capabilities to use them, it is possible to achieve a sustainable competitive advantage.
For clarification purposes, capital can be considered as physical, human or organizational (Barney, 1991) Physical capital is constituted by all the machines, buildings, geographic location, access to raw materials and other types of equipment that are owned by the company; human capital is all the knowledge, skills and experience of a company’s employees; organizational capital includes the formal reporting structure, planning, controlling and coordinating systems as well as all the relationships within the firm and between the firm and those in its environment. These relationships between firms can also be seen as social capital.
Social capital is a concept that was first introduced by Coleman (1988) while confronting two already existing ideas in the areas of sociology and economy. In a nutshell, social capital is the capacity of a firm to benefit from its contacts, which means that, by
2
definition, it is necessary to have a network of contacts (a social network) to have the possibility to create value from social capital.
The importance of such a tool has been augmenting due to the increasing necessity for people and organizations alike to connect with between them and with each other, and due to the high number of means through which is now possible to connect.
This idea of working together, of making connections, has gained importance in the last few years, as it becomes for difficult for firms to work on their own, closed on their small world and still be able to thrive. The globalization and the increasing willingness for companies to work with an open-innovation mindset adds up to create more connections between companies.
Social network analysis has been explored in different contexts over the last few years with more than 1600 papers being published covering its usage in areas such as human resources (Hollenbeck & Jamieson, 2015), innovation (Ahujia, 2000; Bae & Gargiulo, 2004; Giuliani & Bell, 2005; Salman et al, 2005; Zaheer & Bell, 2005; Schilling & Phelps, 2007; Mazzola et al, 2015), alliances (Koka & Prescott, 2002; Koka & Prescott, 2008) or supply chain (Borgatti & Li, 2007; Choi & Kim, 2008). Within these there has been a few (e.g., Burt, 1997; Peng and Luo, 2000; Acquaah, 2007) covering how a micro-level network (employees) can affect a macro-level network (companies).
On another level, online social networks have been evolving in different directions. One of the most used worldwide is LinkedIn. LinkedIn is an online social network that is available for business purposes, where companies can present themselves and connect with potential future employees; while for people it can be a source of information about job opportunities and can be considered a way to do an effective personal marketing. Among the information that is available in LinkedIn, there are the connections of each person, their current position, location and company. From this information source is possible to acquire a massive amount of information and with it form a descriptive network of how a person is connected (Waters, 2014).
From the combination of all the factors with the need of Lipari Consulting to find new ways to further strength their position and develop their business comes the opportunity
3 to develop this dissertation, using social network analysis to further comprehend the situation of the company; LinkedIn as a source of information; and UCINET, a software for network analysis, to map and organize the information collected.
1.2 MAIN OBJECTIVE
Taking the context previously described, the objective of this thesis is to identify, organize and analyze all the existing connections between Lipari Consulting and other firms as well as its employees and their working connections, and evaluate any possibilities of using them to develop a competitive advantage.
1.3 SPECIFIC OBJECTIVES
Having defined the main purpose of this dissertation, the following are the specific objectives that this thesis aims to achieve:
1. To identify any relationships that the company has had formally with other companies and in which context;
2. To identify all working relationships of Lipari Consulting’s employees, analyze them and select those that might have more significance;
3. To create a network based on the information gathered in point 1 and 2, a network for each one;
4. To identify which nodes are of most importance and which relationships might present opportunities;
5. Further investigate the main actors and profile them, from the individual network 6. To understand how to reach the bigger firms in both networks;
7. To understand the current situation of the firm and propose modifications to better align with the goals.
1.4 RESEARCH QUESTIONS
1. How is Lipari Consulting connected to other firms? 2. How are its employees connected with other people? 3. Who has the most central role in the company?
4. How do the profiles of the main actors influence the network? 5. Through whom is possible to reach the most important companies?
4
6. Which companies can provide better opportunities to Lipari Consulting?
7. Which kind of strategy does Lipari Consulting have to manage its social capital?
1.5 SCOPE
The scope of this thesis is to gather information about all existent working connections between Lipari Consulting and other firms, as well as the social network of Lipari Consulting employees’. The focus is on how to use them to improve and grow the company’s business, investigating potential new clients or business partners.
1.6 STRUCTURE
To achieve the presented objectives, this dissertation will have the following structure:
Chapter 1 – Introduction: In this chapter, it was presented a contextualization of the
problematic, the main and specific objectives, the investigation questions, the scope and finally the structure.
Chapter 2 – Literature Review: This chapter will encompass definitions of different
concepts, frameworks, theories, models and relationships necessary for both the understanding of the topic and the development of a careful analysis.
Chapter 3 – Data Analysis: In this chapter all the process will also be explained. Starting
by a brief description of the company being analyzed, followed by how the data will be collected and treated, and ending with the analysis and some comments.
5
CHAPTER 2 – LITERATURE REVIEW
2.1 INTRODUCTION
All the theoretical and conceptual support for this dissertation will be presented in this chapter. Firstly, the concept of social capital will be described, followed by its incorporation in social network and other similar concepts. After it will be discussed how a social network can be analyzed and which kinds of measures have been studied. Finally, it will be explained how it is possible to benefit from a Social Network and Social Network Analysis (SNA)
2.2 SOCIAL CAPITAL
Social capital has been defined by numerous authors (e.g Bourdieu,1986; Coleman, 1988; Burt, 1992; Lin, 2001) as the capacity for an actor (e.g., individual, organization, or community) to extract value from his position in a network by getting access, for example, to more (or better) information, opportunities, resources, or knowledge. As a resource, social capital is different from other types of resources, as, firstly, one entity does not own social capital as it belongs to both parts of a relationship, which means that if this relationship ends, the social capital disappears; and secondly, instead of being transformed into profit, it dictates how to use opportunities to transform financial and human resources into profit through relations with colleagues, friends, and clients. (Burt, 1992).
Social capital exists as a social network that can enable its elements to achieve better results through different possible actions (Coleman, 1988) which translates into the social capital metaphor that “people who do better are somehow better connected” (Burt, 2000). Individually, these benefits have been shown by Boxman, De Graaf, and Flap (1991) where it is shown that people with more contacts receive a higher pay than those with a smaller network. These come from information benefits which can “occur in three forms: access, timing, and referrals”, where access is getting the information and knowing who can use it; timing, that you are informed early; and referrals, when someone mentions you for an existing opportunity (Burt, 1992).
6
In summary, the potential value of social capital is tied up with the opportunity for actors to access information and resources that otherwise they would not be able to. Most of the research related to this topic focuses on how to get value from it and, similarly, so will this dissertation (Maurer & Ebers, 2006).
2.3 SOCIAL NETWORKS
As previously mentioned, social capital can be seen as a network of contacts (actors or nodes), which interact between themselves in multiple ways and can be characterized in different dimensions such as duration or frequency (Laumann et al., 1978, cited in Acquaah, 2007; Borgatti & Li, 2009).
As a model, it considers the actors as being interdependent and considers their relational ties as ways for information and resources to flow between them, originating opportunities or constraints on individual decisions and actions (Choi & Kim, 2008)
As for types of relationships they can be either continuous or discrete. Continuous are mostly ties based in either kinship relations (family); role-based relations (friends, colleagues); cognitive-affective relations, meaning that it is someone you “trust” or “know”; or simply by sharing a location, group, or similar attributes. Discrete can be those that you can count over a period, such as how many times two people meet or talk, or through the flow of information (Borgatti & Li, 2009).
Another way to classify the relationships is according to the strength of the tie - depends on the proximity of an actor to its connections. If they are closely connected, like family, it will be a strong tie; if distant, like an acquaintance, it will be a weak tie. In his paper, Granovetter (1983) explains how weak ties can be important in a social network and how they are able to benefit the actor. More about this idea will be discussed later, with the confrontation of other similar ideas.
2.4 EMBEDDEDNESS
As “even the network itself is often embedded in a larger institutional context (whether social, political, or economic)” (Choi & Kim, 2008) it becomes important to understand also the concept of embeddedness.
7 Uzzi (1996) firstly defines embeddedness as how social relations affect economic action, a situation usually ignored or underestimated by economists. In another paper Uzzi (1997) further describes social embeddedness as “the degree to which commercial transactions take place through social relations and networks of relations that use exchange protocols associated with social, noncommercial attachments to govern business dealings”.
For Choi & Kim (2008), embeddedness constitutes one of the most important research topics related to social networks. It enables us to understand a firm’s behavior or interfirm interactions taking into consideration the social structure around the actors, as it is part of a larger social structure. In other words, it helps to understand how economic decisions and outcomes are affected by the larger structure the actor is part of. For example, how being part of a country with economic problems affects a firm’s capacity of getting a loan from a foreign bank.
Along with this theory, Uzzi (1996,1999) explores the type of existing ties, separating them between embedded ties and arm’s length ties. Embedded ties are related to be part of a same network structure as the other actors where trust and reciprocity help on getting benefits; while arm’s length ties refer to a relationship merely occasional, with continuous contact that would enable the parties to develop trust. In his 1996 study, Uzzi concludes that embedded ties can produce competitive advantages that are difficult to emulate with arm's length ties. Quoting: “embeddedness increases economic effectiveness along a number of dimensions that are crucial to competitiveness in a global economy-organizational learning, risk-sharing, and speed-to-market-perhaps underscoring the growing importance of embeddedness as a logic of economic exchange”.
Nonetheless, this does not mean it is a perfect situation. As many other ideas in management and strategy, having only one kind of relationship is not ideal and there is a point after which embeddedness becomes negative. As such, the conclusion is that is necessary to have a network integrated with both kinds of ties (Uzzi, 1996).
8
“Social network analysis, sometimes also referred to as ‘structural analysis’, is not a formal theory, but rather a broad strategy for investigating social structures” (Otte & Rousseau, 2002).
In order to do so, the most important part is to define what is important to study. As there is no correct or best way to do it, the focus should be on what will provide the best network to achieve our objective. Then, decide which type of network it should be: full network or ego network (Borgatti & Li, 2009). The full network would have all the relationships of all the actors within the scope of the study. By starting at the basic unit of a social network, the dyad, and continuously add all the relationships to each node, the end result will most likely become a number of paths connecting indirectly all the actors (Borgatti & Li, 2009). The problem with this kind of network is the amount of effort required to acquire all the information. As such the most common type of network used is an ego-network which consists of (a) a focal actor, known as ego, (b) the set of actors with any kind of tie to ego (known as alters), and (c) all ties among the alters and between the alters and the ego” (Borgatti & Li, 2009). The reason, apart from being easier to collect data, is that it is believed that distant connections are less relevant to the analysis (Borgatti & Li, 2009).
As for how to collect data to create a network, Borgatti & Li (2009) present diverse options, starting with the traditional surveys, which means asking to every actor to disclose their connections, and repeating the process until the amount of desirable information is achieved. This method presents the problem of asking the actors for possible confidential or intimate information. As such, another possibility is to ask each actor to bring their connections into the study, so that all information present is willingly given. The problem with this approach is that it requires a lot of time. Another option is the aggregation method, where actors are grouped according to a specific characteristic, overcoming the privacy issue and giving the idea of what happens in the network. It has the limitation of being impossible to visualize who are the actors.
Archives can be another source of information, such as contract data from companies’ financial statements; citations data, from publishers’ portals. A more modern option is to
9 make use of the Web, either with dedicated software to find links between actors or using online social networking services, such as LinkedIn or Facebook.
2.6 CONCEPTS AND MEASUREMENTS IN SNA
In this section the aim is to briefly explain all concepts related to analyzing a social network and what kind of indicators can be used to better understand one and take conclusions from it.
Network: “A network is represented as a graph on a set N of nodes, with a finite number
of members n. Nodes are also sometimes referred to as vertices, agents, or players.” (Jackson, 2010)
Network constraint is an index that measures the extent to which a person's contacts are
redundant (Burt, 1992).
Network - directed/undirected: the type of network depends on the type of
relationships. If the relationships are mutual, i.e., there is a flow (e.g. information, goods, services) in both ways (e.g. friendship, alliances), the network with be undirected; if the flow is in only one direction (e.g. giving advice to, lending money), the network is
directed.
An open network exists when an actor can interact with others at in a similar basis, i.e. all actors have the same possibility of interacting with each other; while in a closed
network there is a preference given to some of the actors, i.e. not all the actors have
access to the same opportunities.
Path is the sequence of nodes necessary to reach a specific node, without passing twice
in the same one.
(Geodesic) Distance is the length of the shortest path between two nodes.
Size of a network is the total number of nodes it has.
Density is the average strength of connection between contacts. Density is sometimes
10
connected or not), the average strength of connection between contacts is also the proportion of contact pairs who are connected (Burt, 2000).
Centrality is the extent to which a person is in the center of a network. Actors with higher
centrality have more influence in their network.
Degree of centrality: “The degree of a point is simply the count of the number of other
points that are adjacent to it and with which it is, therefore, in direct contact” (Freeman, 1978).
Betweenness: Nodes have a higher betweenness if they appear in many short paths
between other nodes. Means that a lot of information passes through them, which can result in the control the information flows or get to overloaded with information (Borgatti & Li, 2009).
Edge betweenness: Similar concept as betweenness but instead of nodes, ties. Basically,
these ties have a higher edge betweenness if they are important relationships that have a great impact in the whole network (Borgatti & Li, 2009).
Closeness centrality: number of links that a person must go through, in order to reach
everyone else in the network. The lower the number of links, the higher the closeness. According to Freeman (1978) it also measures the independence of a node – higher closeness means that less contacts are required to pass a message to everyone in the network.
Network centrality measures the extent to which a network is dominated by a single
(few) central nodes. It compares the centrality of the most central node to the other nodes and the results come between 0 and 1.
Eigenvector centrality: “This also leads to the proposition that nodes that are connected
to well-connected nodes will have even more information than nodes that are connected to an equal number of less connected others” (Borgatti & Li, 2009). Nodes with higher Eigenvector centrality are more central by this measure.
11
Structural holes exist when two nodes are linked to the same ego but not linked between
them, creating a gap in flow of information. It indicates that these two nodes have access to different flows of information (Hargadon & Sutton, 1997).
Group/Sub-structures: Any sort of close connected groups within the network. Dyads,
Triads, and ego-centered circles can all be thought of as sub-structures.
Cliques are a sub-structure with a “maximal subset of nodes in which the density is 100%.
In other words, in a clique, everybody has a tie with everybody else” (Borgatti & Li, 2009).
Structural equivalent: Two nodes are structurally equivalent if they have the same
relationships to all other nodes.
Regularly equivalent: Two nodes are regularly equivalent if they have the same profile
of ties with members of other sets of actors that are also regularly equivalent.
2.7 BENEFITING FROM SOCIAL NETWORKS
Along this section the objective is to present several ways of gaining advantage using social capital, be it at an individual or corporate level. For this, different strategies will be discussed, put against each other, and explained as to their advantages and disadvantages.
2.7.1 Types of Information
By now it is clear that information is the main benefit that can be achieved through a social network. Koka & Prescott (2002) divide this information benefits into three different kinds – information volume, information diversity and information richness. Since managing contacts requires time and effort, it is important that an actor has a strategy to get the most out of his potential social capital (Burt, 1992). As such, three kinds of strategies related to each type of information have been identified.
To benefit from a high information volume, i.e. getting a high amount of information, the best strategy is through achieving a more central position in a network (Koka & Prescott, 2002). The advantages are, as follows: (i) the company gets more information related to its core business, making it easier to incorporate and profit from (Helfat, 1994; Kale et
12
al., 2000; Tiwana, 2008); (ii) since all contacts are closely connected, it is possible to obtain information faster and more efficiently, resulting in an overall lower cost to access information (Granovetter, 1978; Burt, 1992); (iii) finally, a firm is able to get a return on scale from the high volume of information, as every piece of information brings in an increased value (Ahuja, 2000; Dittrich & Duysters, 2007).
On the other hand, one problem of these networks is that they end up being composed by mostly cohesive and structural equivalent contacts, which means that the network might end up providing redundant information benefits, originating from the same sources (Burt, 2000). It also means that information coming from indirect ties (non-redundant) will serve for the whole network and its partners, diminishing the benefits a firm can take from it (Ahuja, 2000). Finally, Glasmeier (1991) further explains that “firms with many direct ties may be more constrained in their ability to absorb new information or respond to it as flexibly as firms with few direct ties”. As such, it does not come as a surprise when in Burt’s study (2000) a high network density has a negative association with the performance of a firm.
Burt (1992) defends that out of two networks with the same size, the one with more non-redundant contacts provides more benefits and explains that network management should follow two basic principles: efficiency and effectiveness. The efficiency principle dictates that one should focus in a primary contact that will be “responsible” for informing about his ties, becoming a bridge between the indirect contacts and the ego. The effectiveness principle states that if more than one contact lead to the same cluster, then only one person from each cluster should be selected to “represent” it, i.e., to act as the bridge between the ego and the cluster. This liberates time to connected with other people and creates structural holes. With these two principles is possible to be in the center of the information and coordinate activities (Burt, 1992). In summary, a way to have an efficient network full information is to maximize the number of structural holes or to minimize the redundancy between partners (Burt, 1992).
This kind of networks can be called broker networks or entrepreneurial networks and it implies achieving a position in a network where you build a bridge between two disconnected nodes and gain an advantage from it (Burt, 2000). With an entrepreneurial
13 position an ego firm is able to benefit from information diversity, which gives the company a broader range of contents in the received information, although less quantity of it (Koka & Prescott, 2002). By exploring the diversified information, it can benefit in the following way: since information is gathered through ‘weak-ties’, it will come from ties working in different industries, markets or technologies. This idea of ‘broad-search’ (Gilsing & Nooteboom, 2005; Dittrich and Duysters, 2007) provides non-redundant information that can help to generate new ideas, knowledge or technologies. The possible limited amount of information received constitutes the drawback of this position.
In a paper about collaboration and knowledge networks in coastal resources management, Cárcamo et al (2014) explains that with decentralized networking is harder to coordinate in the solution of simple tasks, to form groups and to build support for collective action. On the other hand, they are more advantageous in a long-term planning and to solve more complex tasks, they have less problems if one of the actors disappears and are perceived as more fair and open.
The two previous strategies are related to how the network itself is composed, together forming the idea of structural embeddedness defended by Granovetter (1985, 1992). The other major idea - relational embeddedness - is also the third strategy, as described below.
Relational embeddedness provides the focal firm with information richness. It means that by having stronger connections with alters the firm can benefit from higher quality information (Hàkansson & Johanson, 1993; Podolny, 2001) and a deeper exploitation of opportunities (e.g. Dittrich & Duysters, 2007). According to this view “densely embedded networks with many connections linking ego's alters that are facilitative for ego, and social structures are seen as advantageous to the extent that networks are "closed"” (Ahuja, 2000). Being part of such a network has the advantage of a higher level of trust, a lower risk of opportunistic behavior and the existence of a better environment to trade (Uzzi, 1996). It also facilitates the cooperation between actors and “also makes defection less likely by enhancing actors’ ability to undertake joint actions to enforce the cooperation of offending parties” (Coleman, 1990, cited in Bae & Gargiulo, 2004). In other words, by forging stronger connections with the alters, a focal company can benefit from trust and reputation as they safeguard against opportunism and they improve the
14
awareness of the rules, routines, and procedures that each needs to follow to improve coordination. Similarly to the first case, while focusing in a small part of the network, it’s possible to miss other useful information.
Burt (2000) presents also another way to have access to social capital without being in the center of it, by «borrowing». This idea translates into having someone (a sponsor), that will introduce the actor to the network and act as a bridge between this actor and the other members of his network. Through this situation, the actor will have access to his sponsor’s network. It is the best option for “outsiders” or “newcomers” (e.g. a new agent in the acting business that needs to contact directors) to be sponsored by someone already in the network, as it enables them to tap into his sponsor’ social capital. A network that strongly relies on sponsoring will be a hierarchical network which is usually made up by large, sparse networks anchored on a central contact (the sponsor).
Overall, a broker network is regarded as the best strategy to manage a social network, giving more advantages at different levels for a lower amount of time and energy spent.
2.7.2 Types of Companies
As almost everything else in business, and life in general, achieving one condition does not spell success for everyone. In this case, even if a firm manages to settle in one of previous strategies it does not mean that they benefit automatically from the described benefits. In their study Zaheer & Bell (2005) link social network research with the resource-based view of a firm and explain that a firm can only fully benefit from their social capital if they have both a “superior set of internal resources and a beneficial network structure”. This means that for a firm to be able to fully incorporate the information they acquire, it is necessary to have resources relevant to be able to “assimilate and replicate new knowledge gained from external sources” (Cohen & Levinthal, 1990).
Further along this idea, it is also possible to divide companies by the type of knowledge and experience they have into specialists, generalists, and those in the middle (moderate specialization levels) (Shipilov, 2006). Specialists concentrate their business in a few segments and have a deep understanding how they function and how to thrive based on
15 their experiences (Barnett, et al., 1994), giving them a higher performance when working within their scope. On the opposite side, generalists have a broader knowledge of the industry as they operate in a wide range of markets (Ingram & Baum, 1997), which enables them to participate in a higher number of projects throughout different areas.
The performance of each type of company depends on the kind of network they are part of. In an open network generalists and specialists would have a higher performance. The firsts due to their ability to reach to different markets and, as such, find and make use of more opportunities than the others; the specialists because their expertise in one specific field would be an asset to some firms in the network (Shipilov, 2006).
On the other hand, if it is a closed network, Shipilov (2006) concludes that firms with moderate specialization get better results. This is due to their necessity and openness for cooperation – while generalists and specialists have their own resources and are able to trade them, firms with moderate specialization have more limitations, and recognize them, giving them more interest in forging trusting and fruitful alliances, which make them better partners.
In summary, specialists and generalists usually have better in-firm resources, which makes them abler to thrive in an open network. While firms with moderate specialization require a space with more trust, rules and cooperation to be able to work together with other firms and complement their internal fragilities with their partner’s resources.
To close this topic, it is possible to conclude that a firm’s internal capabilities dictate how it can benefit from their social network and provide another clue on which kind of network strategy it should take.
2.7.3 Benefiting from an individual’s social capital.
“Management researchers have argued that the social capital embodied in the development of managerial social networks and ties with external entities, a micro-level construct, affects an organization’s competitive advantage and performance, a macro-level construct” (Acquaah, 2007). As such, and considering the topic of this dissertation,
16
it is crucial to better understand how individuals can contribute to the success of the organization.
In their work, Peng and Luo (2000) argue that connections between managers of different companies can serve as substitutes to formal institutional support. Some authors (e.g. Pfeffer & Salancik, 1978; Powell, 1990) suggest that managerial ties are more important as the environmental uncertainty increase. As such, studies in non-developed countries (Peng & Luo, 2000; Acquaah, 2007) give another perspective of how important an individual’ social capital can become.
To evaluate performance, Peng & Luo (2000) aimed at understanding how managerial ties could impact on market share and return-on-assets (ROA). Their conclusions supported that the most impacted aspect was market share, providing some possible explanations such as that developing managerial ties requires cash outflows; that there might be a lag effect from getting market share results to achieving better financial returns; or that the principal objective of the managers is only the market share. This better performance due to social capital is also supported by Acquaah’s (2007) study. In his study, Acquaah (2007) concludes that the relationships forged by a manager can provide several benefits such as secure access to financial and strategic resources and high-quality information about products, marketing, and technological opportunities.
The importance of the manager’ social capital is higher when the companies are either small, in the service sector or in low-growth industry (Peng & Luo, 2000). Maurer and Ebers (2006) study how biopharmaceutical companies use social capital throughout their development. In the start-up phase, it was important for the managers to keep close ties with managers of similar companies as it allowed them to have access to resources that otherwise would be extremely difficult to use. But in following phases it was more important to expand their connections to other areas in order to access knowledge that did not exist in their primary network. As such, in their study, Maurer and Ebers (2006) show the importance of social capital in each phase of a growing company and how it can influence its success. An important revelation is how the successful companies in this study had developed a way to divide and manage their network, ensuring that no one had to deal with different realities at the same time, liberating the founding managers to focus
17 on ties that would improve their managerial skills and the overall performance of the organization while the senior scientists were in charge of keeping the initial connections with their fellow scientists to keep having access to resources and information within the industry.
From this study it is possible to conclude that: every member of an organization should have the responsibility of both bringing their social capital into the company and be part of its management (Maurer & Ebers, 2006); “friendship networks between individuals across firms might also be significant conduits for the transfer of information and knowledge” (Zaheer & Bell, 2005); investment on business founder’ social and human capital brings better performance to a company (Bosma, et al., 2004); and individuals can also contribute to the organization with the creation of intellectual capital (Nahapiet & Ghoshal, 1998).
Finally, managers should be careful when developing their network as deviating from a clear network strategy can impair their capacity of collecting full benefits from a network (Moran, 2005). Moran (2005) also points out that a manager should focus not only in a entrepreneurial strategy to gain advantage over others in terms of information, but also in relational embeddedness, building stronger and trustworthy ties that can be of help in situations of higher uncertainty.
Overall, from this section it is important to retain that what a manager does outside the organization can also have a great impact on how the organization performs, but also that all the employees of a company can have impact in a company’ social capital, not only the managers.
2.8 SNA IN HUMAN RESOURCES MANAGEMENT (HRM)
Having understood how actors can understand and benefit from a social network, it is now time to look on how this concept is being used in other areas. Since this dissertation will partially focus in evaluating the connections of some of the collaborators of Lipari Consulting, it makes sense to understand how this kind of analysis can (or should) influence how a company manages their human resources, for recruiting, maintenance and evaluation.
18
This section will the based on the paper written by Hollenbeck & Jamieson (2015) as it provides an insight closer to what is the focus of this dissertation than other authors (e.g Hatala, 2006; Parise, 2007) that focus mostly in other aspects, such as Human Resource Development, which are less relevant for the objectives of this work.
The first way the authors present to use social network analysis in HRM is for the recruiting step. It is explained that with the increasing importance of team-based structures in companies, it becomes more important to understand not only the attributes of each individual but also how each employee behaves within the company. By understanding which collaborators are better at connecting people and/or spreading knowledge, is possible to define a baseline profile of what to look in possible candidates. Another possible use is to find the candidates themselves. It is already a current practice to recruit through referrals, but as most people do not have a full comprehension of their network, some talent might be overlooked; hence, by mapping everyone’ social network, it is possible to have a clearer image of who might be adequate for the open position. After recruiting, it is in the integration phase that SNA might help. According to different studies cited by the authors, it is important for a new employee to be properly integrated, as it will influence his satisfaction with the job, and his access and assimilation of tacit knowledge. With SNA, it is possible to identify both the employees that have more ‘social influence’ as well as those that seem more socially isolated and, with this, intervene.
Hollenbeck & Jamieson (2015) also explain how SNA can be used to evaluate performance. In order to understand not only how someone performs his job but also how he contributes to others’, it makes sense to identify to whom the people go to when they require help or looking for new ideas. SNA could also be useful to help mapping processes withing a company, i.e. to understand through whom the information passes until the process is complete and, with this, look for unefficiencies and correct them.
The downsides of this kind of analysis could be an abusive/unethical use of the information collected; an increase of time wasted socializing, if social relationships become a performance measured; as well as more frequent but less important contact between employees.
19 In summary, this tool can provide the managers with more information, and more accurate, providing a different basis to make decisions. It also helps identify who are the informal leaders within the organization and who might be adding value without being noticed.
CHAPTER 3 – CASE STUDY
This chapter is dedicated to the practical part of the dissertation. It will begin with a description of the company, then the methodology used to collect and process the data, followed by some descriptive statistics of the collected data and ending with an analysis of the created networks.
3.1 LIPARI CONSULTING (LC)
Created in 2007 by current CEO Giuseppe Lipari in Alcamo, a province near Palermo in the region of Sicily, Lipari Consulting is a management consulting company that focus primarily in collaborating with the most important international companies.
In 2010 it expands its network, starting to collaborate with the management consulting companies that work in the markets of Banking and Insurance, becoming in 2012 the market leader in consulting through partnerships. In 2012 it also acquires its first direct clients. In 2016 it further increases the portfolio of direct clients and creates a new division – Advisory – to deal with them, reaching revenues of €6 million.
LC provides services in the areas of:
▪ Project Governance, managing the work and capacity plan, cost control, risk management and reporting;
▪ Process Analysis, evaluating the current situation, mapping the processes and re-designing them;
▪ Business Analysis, doing feasibility studies, selecting partners, defining business requirements and service models, and launching commercial campaigns;
▪ Functional Analysis, collecting functional requirements, drawing functional documents, selecting software, defining integrational IT models, and training and developing user manuals.
20
▪ Software Certifications, defining and drawing test plans, define functional tests’ documents, UAT activities and test reporting.
Their declared mission is “Work with passion side to side with our clients to support them during their growth.” In its values, LC considers that are the human resources that create a combined value to the company and for this it adopts a politic of motivation and accountability to each individual in their assignments.
In a recent article, written in the TP24 online newspaper, to celebrate the LC’s 10-year-old anniversary, it was highlighted that Lipari Consulting has achieved considerable success with its team having an average age of 28,8 years and mostly composed by former students of the University of Palermo (78%).
3.2 DATA COLLECTION AND PROCESSING
The main source of information for this analysis are the existing connections of each employee of Lipari Consulting in the professional social network known as LinkedIn. To collect the required data and information (name, company and position) with minimal risk of losing information while processing it, it was requested to all the collaborators to follow a short tutorial (vide appendix 1) that would allow to download all the connections information into one excel file (vide example in appendix 2). After collecting all the data and organizing it in one file, the next step is to filter the connections per position and company in order to a) obtain only the connections that have influence within the company to participate in the definition of a partnership or to influence the decision of outsourcing a problem and b) to exclude companies that do not have enough available information to work with.
The first step of filtering the available data will be done by position. In order to do this, it will only be considered the professionals with a job title within the managerial positions. It will be divided firstly into first-level managers, middle-level managers and top-level managers (DuBrin, 2011) For a matter of simplification, considering the extremely high number of entries, the positions considered will be only the ones present in LinkedIn,
21 since it would require additional resources to further investigate if any person has any other position in other organization.
The next step will be to evaluate each of the remaining connection’s companies as per their size (number of employees), sector of activity, country, city and age. The information about the size of the company will follow LinkedIn classification (appendix 3) and the sector of activity will be based in the second level of the SIC code. This will allow a better understanding of what each company could provide in terms of a possible business associate or a potential client.
After all these steps, the relevant information left consists in a total of 447 companies to which there is enough information to proceed with an analysis.
3.3 PERSONNEL NETWORK ANALYSIS
This section will start by some brief overall descriptive statistics that intend to describe the kind of information gathered. The second part will be a deeper analysis of the statistics available, dividing them by employee and matching it with size of the companies connected to each one and the sectors of activity. Then it will proceed to the main analysis – the network analysis – providing some insight about the total network.
22
3.3.1 Overall Descriptive Statistic
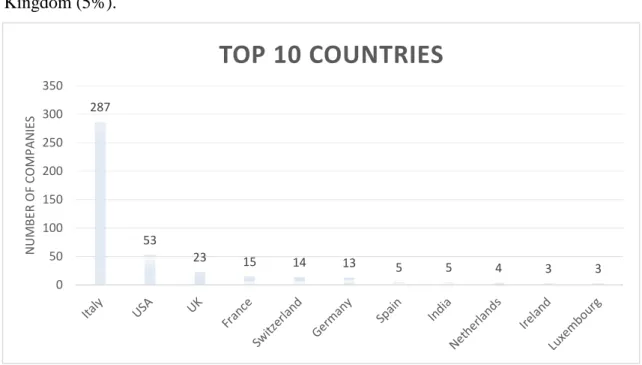
Starting by splitting the companies by country, it is verifiable that most of them are present in Italy (64%), followed by the United States of America (12%) and the United Kingdom (5%).
Through this information is possible to affirm that the working relationships are currently more focused on the internal market of the firm, with some exceptions.
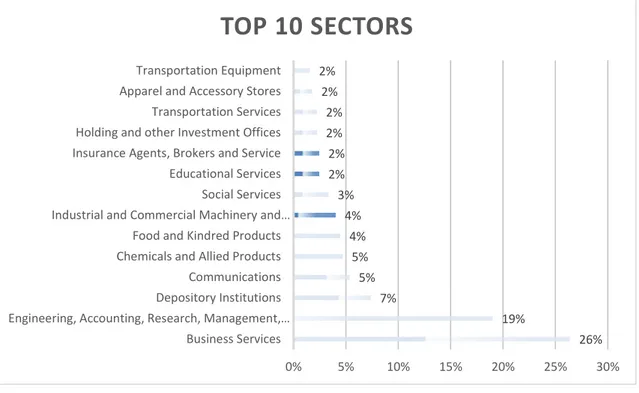
Now looking at the principal areas of business where these companies belong, it is clear the domination of companies in the sectors ‘Business Services’ and ‘Engineering, Accounting, Research, Management, and Related Services’, which are mostly composed of consulting activities – 45% in total -, followed by the area of Depository Institutions, fully composed by banks. All other areas below are represented by 7 to 24 companies.
287 53 23 15 14 13 5 5 4 3 3 0 50 100 150 200 250 300 350 N UM BE R O F CO MPA N IE S
TOP 10 COUNTRIES
23
Figure 2 - Top 10 Sector
This reality shows a similar result as the previous graphic, where most of the connections exist within the same business area of Lipari Consulting.
As for how long each company has been in the market, the most important remark is that 35 of those companies can be considered start-ups and that a third of them (146) have less than 10 years.
This fact can be explained by how the data was filtered. Since only the most important positions were considered, there is a higher chance to find them in smaller companies.
26% 19% 7% 5% 5% 4% 4% 3% 2% 2% 2% 2% 2% 2% 0% 5% 10% 15% 20% 25% 30% Business Services Engineering, Accounting, Research, Management,…
Depository Institutions Communications Chemicals and Allied Products Food and Kindred Products Industrial and Commercial Machinery and…
Social Services Educational Services Insurance Agents, Brokers and Service Holding and other Investment Offices Transportation Services Apparel and Accessory Stores Transportation Equipment
TOP 10 SECTORS
35 43 68 75 115 58 53 0 20 40 60 80 100 120 140 0 to 2 2 to 5 5 to 10 10 to 20 20 to 50 50 to 100 100 to ∞ NUMBER OF COMPANIES A G ENUMBER OF COMPANIES BY AGE
24
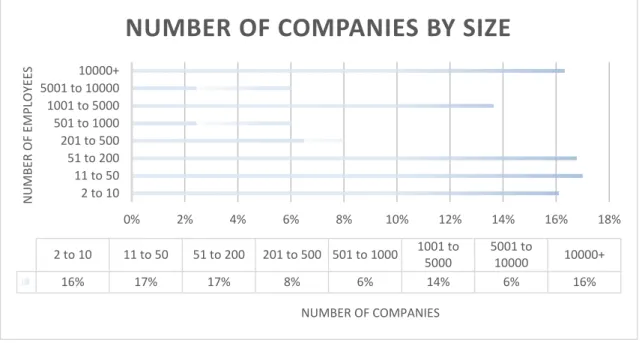
Finally, by separating the companies in analysis according to their number of employees, it is noticeable that there is no dominant category, with the ones with higher values ranging from 14 to 17% of the total and the other 3 from 6 to 8%.
Two remarks, first the high number of companies with less than 200 employees, which, considering that most of them work in Italy, points to the fact that a great part of Italian companies are SME’s. Secondly, comparing Figure 3 and 4 it is noticeable that (i) there are 100 companies with more than 5001 employees and (ii) that and 111 with more than 50 years. This suggests that the size of the company might be related to its age.
3.3.2 Top 10 Sectors by Age
In this section it will be compared the age of the company to its sector of activity. The objective is to understand how they related to each other in this sample.
Table 1 - Top 10 Sectors by Age - 0 to 2
0 to 2
Business Services 38,24%
Engineering, Accounting, Research, Management, and Related Services 20,59%
Communications 8,82% Social Services 5,88% Depository Institutions 5,88% 0% 2% 4% 6% 8% 10% 12% 14% 16% 18% 2 to 10 11 to 50 51 to 200 201 to 500 501 to 1000 1001 to 5000 5001 to 10000 10000+ NUMBER OF COMPANIES N UM BE R O F E MPL O YE ES 2 to 10 11 to 50 51 to 200 201 to 500 501 to 1000 1001 to 5000 5001 to 10000 10000+ 16% 17% 17% 8% 6% 14% 6% 16%
NUMBER OF COMPANIES BY SIZE
25 For companies with less than 5 years, the most common sector of business is consultancy, with almost 60%. Either directly related to business or in other areas (e.g. engineering or accounting).
Table 2 - Top 10 Sectors by Age - 2 to 5
2 to 5
Business Services 30,23%
Engineering, Accounting, Research, Management, and Related Services 25,58%
Social Services 11,63%
Food and Kindred Products 4,65%
Miscellaneous Services 4,65%
Chemicals and Allied Products 4,65%
Educational Services 4,65%
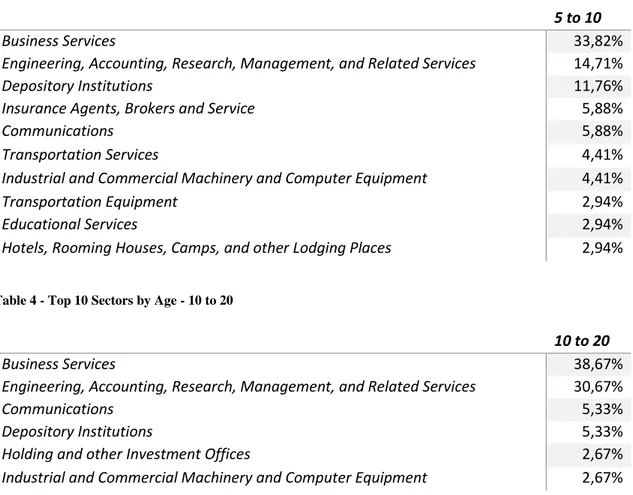
In table 3, consultancy services have a slightly lower percentage due to the higher number of sectors present and the existence of some banks (Depository Institutions).
Table 3 - Top 10 Sectors by Age - 5 to 10
5 to 10
Business Services 33,82%
Engineering, Accounting, Research, Management, and Related Services 14,71%
Depository Institutions 11,76%
Insurance Agents, Brokers and Service 5,88%
Communications 5,88%
Transportation Services 4,41%
Industrial and Commercial Machinery and Computer Equipment 4,41%
Transportation Equipment 2,94%
Educational Services 2,94%
Hotels, Rooming Houses, Camps, and other Lodging Places 2,94%
Table 4 - Top 10 Sectors by Age - 10 to 20
10 to 20
Business Services 38,67%
Engineering, Accounting, Research, Management, and Related Services 30,67%
Communications 5,33%
Depository Institutions 5,33%
Holding and other Investment Offices 2,67%
26
Most of the companies with between 10 and 20 years are in the consultancy, representing almost 70%. While the ones aged between 20 to 50 have 50% in the consulting business, with the others divided throughout the sectors.
Table 5 - Top 10 Sectors by Age - 20 to 50
20 to 50
Business Services 30,43%
Engineering, Accounting, Research, Management, and Related Services 18,26%
Communications 8,70%
Depository Institutions 4,35%
Chemicals and Allied Products 4,35%
Food and Kindred Products 3,48%
Industrial and Commercial Machinery and Computer Equipment 2,61%
Insurance Agents, Brokers and Service 2,61%
Holding and other Investment Offices 2,61%
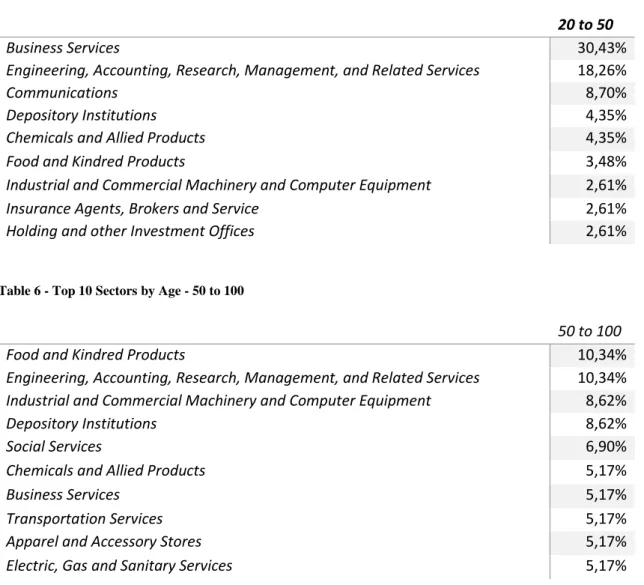
Table 6 - Top 10 Sectors by Age - 50 to 100
50 to 100
Food and Kindred Products 10,34%
Engineering, Accounting, Research, Management, and Related Services 10,34%
Industrial and Commercial Machinery and Computer Equipment 8,62%
Depository Institutions 8,62%
Social Services 6,90%
Chemicals and Allied Products 5,17%
Business Services 5,17%
Transportation Services 5,17%
Apparel and Accessory Stores 5,17%
Electric, Gas and Sanitary Services 5,17%
In both tables for companies with more than 50 year-old, the situation is quite different with the firm being split through the different sectors without any clearly dominant sector.
Table 7 - Top 10 Sectors by Age - 100+
100 to ∞
Depository Institutions 18,18%
Chemicals and Allied Products 16,36%
Engineering, Accounting, Research, Management, and Related Services 12,73%
27
Insurance Agents, Brokers and Service 7,27%
Industrial and Commercial Machinery and Computer Equipment 5,45%
Social Services 3,64%
Business Services 3,64%
Holding and other Investment Offices 3,64%
To summarize, it is noticeable that (i) apart from the older companies (over 50 years-old) most of them belong to the consultancy sector; (ii) the older the companies are, the more the percentage is split throughout the sectors; (iii) the most present sector overall – ‘Business Services’ – loses importance as the age increases; (iv) the data reveals (or confirms) that a lot of consultancy firms have been created in the last 20 years.
3.3.3 Overall Employees Network Analysis
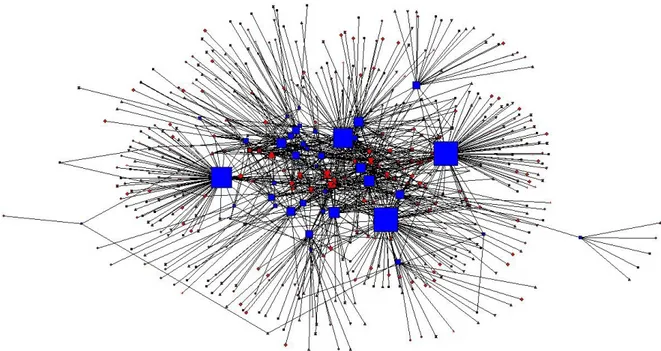
In Figure 5, a representation of Lipari’s network, the main point of analysis are the squares which represent Lipari’s employees. The size of the square represents the degree of each node. Below, Table 8 summarizes the top15 of personnel with the higher amount of connections, ranked by ‘Degree’.
Looking into the first column, ‘Degree’ represents the number of direct connections each person has. Two notes worth taking are that the first two (Giovanni Lipari and Giavito Parinello) have both more than 90 direct connections; and that between the 4th and 5th place the difference is of 37, which leave the top 4 clearly highlighted.
28
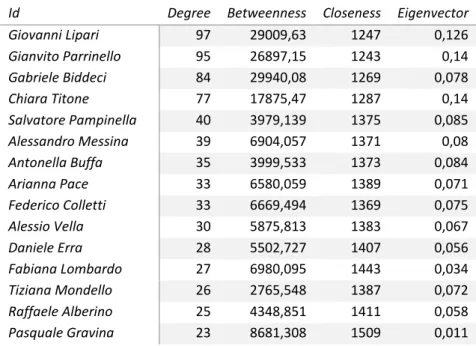
Look at betweenness is interesting to check how the top 3 have a way higher value than the rest, showing how these three are important in connecting the network. Another interesting result is how Gabriele Biddeci, who has less contacts than both Gianvito Parrinello and Giovanni Lipari, gets a higher value for betweenness, which means that even though he has less connections he is present in more short paths.
In terms of closeness there is no surprise, with the values following, with only a few exceptions, the ranking of degree.
Finally, for Eigenvector centrality, it is interesting to notice that Gabriele Biddeci has a relatively low value, which means that even though he is well connected directly, indirectly, or through others, he has less importance than, for example, Salvatore Pampinella or Alessandro Messina that are in 5th and 6th place, respectively.
Table 8 - Top 15 Nodes by Degree
Id Degree Betweenness Closeness Eigenvector
Giovanni Lipari 97 29009,63 1247 0,126 Gianvito Parrinello 95 26897,15 1243 0,14 Gabriele Biddeci 84 29940,08 1269 0,078 Chiara Titone 77 17875,47 1287 0,14 Salvatore Pampinella 40 3979,139 1375 0,085 Alessandro Messina 39 6904,057 1371 0,08 Antonella Buffa 35 3999,533 1373 0,084 Arianna Pace 33 6580,059 1389 0,071 Federico Colletti 33 6669,494 1369 0,075 Alessio Vella 30 5875,813 1383 0,067 Daniele Erra 28 5502,727 1407 0,056 Fabiana Lombardo 27 6980,095 1443 0,034 Tiziana Mondello 26 2765,548 1387 0,072 Raffaele Alberino 25 4348,851 1411 0,058 Pasquale Gravina 23 8681,308 1509 0,011
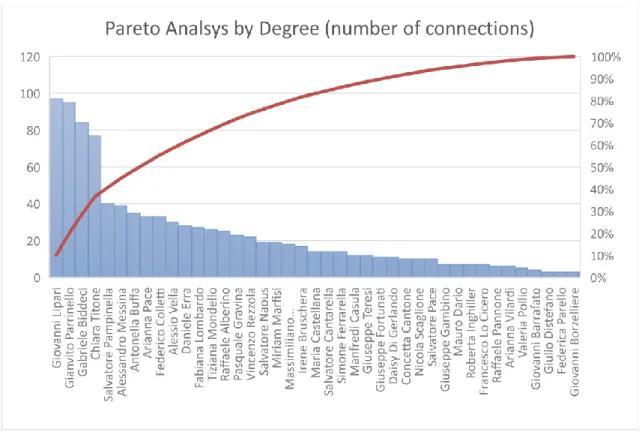
Before for a person-by-person analysis, it is interesting to notice how each worker contributes to the network. For this purpose the method chosen was a Pareto analysis (Figure 6) where it’s possible to observe the contribution of each person (blue bar) for the total knowledge of the firm (red line). To note that the first 4 represent around 40% of the total and that the last 24, out of 42 people under analysis, contribute only with 20%.
29
Figure 6 - Pareto Analysis by number of connections (Degree)
3.3.4 Individual Analysis
Having identified the most important people within the company, the next logical step is to understand how influent each of them are. Each analysis will be composed by a personal description (former jobs and education) according to LinkedIn and a summary of their ‘expertise’ (how they fare per size, age and sector). The full analysis can be found in the appendix (appendix 5)
a) Giovani Lipari – Current CEO of Lipari Consulting
After studying computer science and business administration, Giovani Lipari focused his whole career in the consulting business. As such it is not surprising when more than 30% of his contacts work in consulting firms. Since most of the business of Lipari Consulting is providing services to banks and other financial entities, it is also normal that the second most present sector is banking. Looking at Figure 8 it is understandable that almost a third of his connections work for big companies (over 10000 employees) followed by those of small dimension (51 to 200). Figure 7 presents a similar result, with 30% of the connections being part of companies between 20 to 50 years old. It is also relevant to notice that around 80% of his contacts work for companies with over 10 years of existence.
30
b) Gianvito Parrinello – Current Partner of Lipari Consulting
After finishing his master degree in management engineering, Gianvito Parrinello has been working with Lipari Consulting from since the start. As such, it is not surprising that the results obtained are not far from those of Giovanni Lipari, with consulting service’s companies coming in the first two places and banks in third. As for the size of the companies, its distribution is slightly more disperse when comparing to Giovanni’s, but still greater focus on the almost same categories.
c) Chiara Titone – Current Sales Manager at Lipari Consulting
Chiara Titone presents a similar profile to the previous two. A degree from the same university in the same area, starting her professional life in Lipari Consulting and continuing until now. As such, all the acquired information points in the same directions as the previous cases, with consulting and banking being the main sectors, big firms as the main connections and companies between 20 and 50 years with a higher percentage.
d) Gabriele Biddeci – Currently a consultant in Lipari Consulting
With no information available on LinkedIn, the profile analysis is quite limited. As in all the previous cases Gabriele Biddeci did his studies in UNIPA, both bachelor and master in management engineering. As usual the main sectors of activity are consulting-related, but in this case the following ones are communications, food and chemicals. As for size and age, it differs from the other people, as, for size, there’s not only the big companies but also the small ones (2 to 50 people) that represent a third of his total connections. Age is also more distributed when comparing to the other 3 cases, as all values are between 10 and 20% apart from the category 2 to 5. This may represent some value for the company as he has access to difference types of companies of different sectors.
e) Salvatore Pampinella – Currently a Sales Manager in Lipari Consulting
With a profile similar to the previous employees, Salvatore Pampinella’s connections are also more present in consulting and banking companies. The main difference stands in the internal education experience that he had in Sweden, even though for now it does not show any major difference. As for size and age, it follows the trend, with 40% of the