Magda Francisca Calás Oliveira Carvalho Aguiar
13
Public St
ated Preferences for Pharmaceutical F
unding Decisions
Universidade do Minho
Escola de Economia e Gestão
Public Stated Preferences for
Pharmaceutical Funding Decisions
Magda F
rancisca Calás Oliv
eir
a Car
valho A
Masters Dissertation
Masters in Health Economics and Policy
Supervised by:
Paula Benesch
Verity Watson
Magda Francisca Calás Oliveira Carvalho Aguiar
Universidade do Minho
Escola de Economia e Gestão
Public Stated Preferences for
Acknowledgements
Numerous people have contributed to this work and I would like to spend a few words to thank to them.
First, I would like to express my deep gratitude to my supervisors Prof. Paula Ben-esch and Prof. Verity Watson. I had an excellent opportunity to learn from two great researchers.
I thank Prof. Paula for being it all: a supervisor, a teacher, a friend. She always saved an encouraging word for each of my dramas and did infinite efforts to make this work possible. I am also grateful to Prof. Verity for her kind and wise support and for her availability and prompt responses. Such efforts helped minimizing the distance between us.
Secondly, I would like to thank Dr. Firmino Marques, president of the headquarters of the parish of S. Vítor, for his availability and will to help.
I save sincere thanks for all the participants of the pilot study and for all of the re-spondents of the main study. The value of their contribution is unquestionable, with-out which this work would not be possible.
I take this opportunity to outline the contribution of my parents, Ana and José, for the present work. During the whole process they never stopped being parents, 24/7, with no breaks or holidays.
Further, I would like to thank my friends, who managed to support me in the most diverse ways. Attilio, Eunice, Inês, João, Joana Maria and Sandra, their presence and continuous demonstration of care and affection was inspiring for keep going and de-terminant to overcome the obstacles that arose.
Abstract
Introduction: In Portugal, the pharmaceutical consumption is subsidized by public funds. The rising NHS expenditures and the recent need of cost containment policies emphasize the discussion on priority setting in health care and raise questions of which criteria are appropriate to support funding decisions. Decision-makers base the pharmaceutical funding grant on clinical and economical evidence. Vulnerable sub groups, such as chronically ill and elderly with low income, benefit of higher financing rates than the general population. Little is known about the preferenc-es of the public for pharmaceutical funding criteria in Portugal. Discrete Choice Experiments (DCEs) are suitable for the estimation of stated preferences as they measure of benefit that describes the good through a bundle of attributes and lev-els and it is based on the assumption that an individual’s valuation depends upon the levels of these attributes. DCE have the potential to contribute to outcome measurement for use in economic evaluation, uniquely allowing the investigation of diverse questions, such as clinical, economic and ethical. Aim: This work seeks to investigate criteria considered important by the Portuguese public for al-locating resources for pharmaceuticals. In particular, we estimate the importance of the severity of the disease for which the treatment is indicated, the prevalence of the disease in Portugal, the efficacy of the pharmaceutical and the government costs per person treated. Method: A self-completion DCE survey, with 18 binary choice sets, was administered to two samples of the general population. Choice data are used to consider the relative importance of changes across attribute lev-els, and to model utility scores and relative probabilities. Results: A total of 90 individual completed the DCE. For the levels and units presented in the DCE, all attributes were statistically significant, in both samples. The attributes “severity of the disease for which the pharmaceutical is indicated” and “efficacy of the new pharmaceutical” had the higher utility values. The coefficient for the cost attribute was negative. Conclusions: This is the first DCE in Portugal that extends the dis-cussion of prioritization in the health care sector, namely on the pharmaceutical funding decision, to the general population. This study sets foundation for future research and supports the acceptability of the public for DCEs.Key-words: Pharmaceuticals Funding, Pharmaceuticals Reimbursement, Stated Preferences, Discrete Choice Experiment.
Resumo
Introdução: O consumo de medicamentos em Portugal, é em parte, financiado pelo Estado, através de um sistema de comparticipação de medicamentos. O aumento da despesa do SNS e a recente necessidade de implementação de políticas para a contenção da despesa pública enfatizam a discussão sobre os critérios apropria-dos para fundamentar as decisões de priorização e financiamento apropria-dos cuidaapropria-dos de saúde. Atualmente, a decisão para atribuição de comparticipação de medicamentos baseiam-se na evidência de benefício clinico e económico. No entanto, nenhum es-tudo investigou as preferências sociais para o financiamento de medicamentos em Portugal. A metodologia selecionada, escolha discreta, tem o potencial de contribuir de forma única para a avaliação económica na saúde, englobando critérios clínicos, económicos e éticos. Objetivo: O presente trabalho tem como objetivo investigar critérios considerados importantes pela população portuguesa para o financiamento de medicamentos. Em particular, estimou-se a importância dos atributos: severidade da doença para o qual o medicamento está indicado, prevalência da doença em Por-tugal, eficácia do medicamento e custo para o estado por pessoa tratada. Método: Foi administrado um questionário, DCE, com 18 pares de alternativas, a duas amostras da população de Braga.
Resultados: No total, 90 indivíduos responderam ao questionário. Os atributos seve-ridade da doença para o qual o medicamento está indicado e eficácia do medica-mento obtiveram os valores de utilidade mais elevados. Para os níveis apresentados, todos os atributos fora estatisticamente significativos, em ambas as amostras. O coeficiente para o atributo “custo para o estado por pessoa tratada” foi negativo. Conclusão: Este é o primeiro estudo português a estender a discussão do financia-mento de medicafinancia-mentos à população geral. Este estudo contribui para o desenvolver de investigações futuras e evidencia a aceitabilidade dos DCE junto da população.
Palavras-chave: Financiamento, Medicamentos, Preferências Socias, Escolha Dis-creta.
Table of contents
Chapter 1. Introduction...11
1. Background...11
2. Aim...13
3. Methods...13
4. Organization and Contents...14
Chapter 2. Pharmaceutical financing...15
1. Pharmaceutical expenditures...15
2. Pharmaceutical Policy...16
2.1. Reimbursement system...16
2.2. Economic evaluation criteria...17
2.3. Positive List...19
2.4. Reimbursement categories...20
Chapter 3: Literature Review...23
1. The use of stated preferences in health care...23
2. Theoretical foundations of the discrete choice experiments...24
3. Methodology...25
3.1. Identification of attributes and levels...26
3.1.1. The cost attribute...27
3.2. Experimental Design...28
3.2.1. Ensuring design efficiency...29
3.3. Data collection...30 3.3.1. Opt-Out choice...31 3.3.2. Introductory text...32 3.3.3. Sampling...32 3.4. Data analyses...33 3.4.1. Data Input...33 3.4.2. Econometric Analysis...34
4. Discrete Choice Experiments in pharmaceutical funding decisions: a review of the literature...36
Chapter 4. Method...41
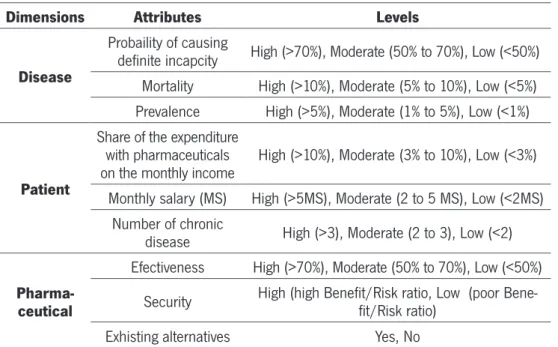
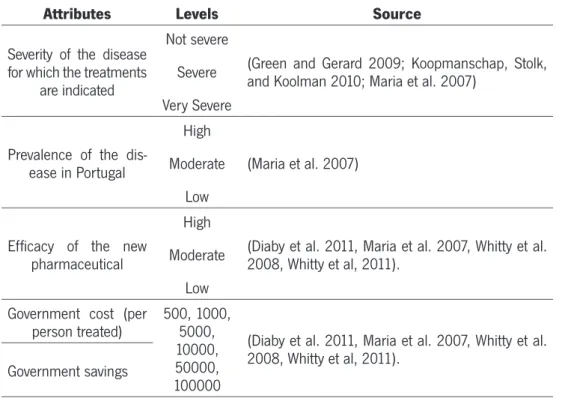
1. Identification of attributes and assignment of levels...41
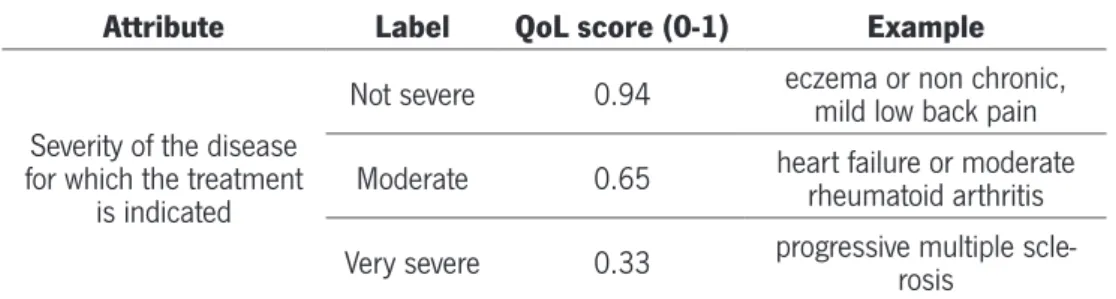
1.1. Severity of the disease for which the treatments are indicated...43
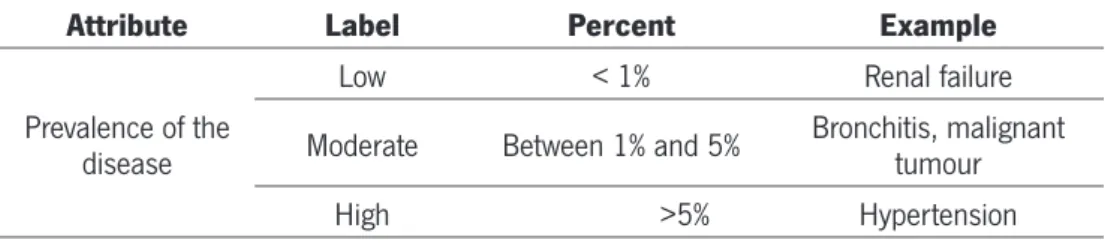
1.2. Prevalence of the disease in Portugal...44
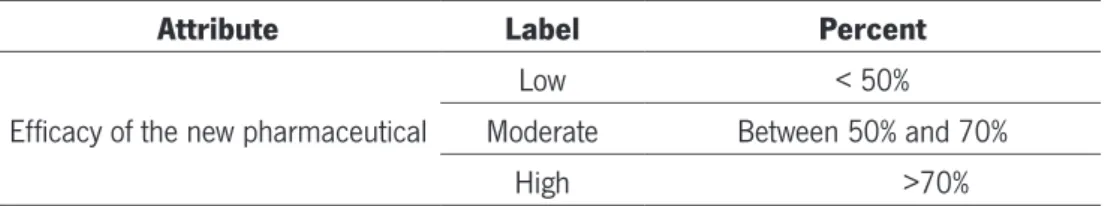
1.3. Efficacy of the new pharmaceutical...45
1.4. Government costs/Government saving...45
2. Experimental design...46
2.1. Number Of Choices And Cognitive Fatigue...47
2.2. Inclusion Of A Validity Test In The Choice Task...47
2.3. Checking Properties...48
3. Data Collection...48
3.1. The Questionnaire...48
3.1.1. “Warm-up” questions: The Likert scale...49
3.1.2. DCE section...50
3.1.3. Socio-demographic questions...50
3.2. Qualitative work: Piloting...51
3.2.1. Tested features...52
3.2.2. Conclusions from the pilot...54
3.3. Sample design and data collection method...55
3.4. Data Analyses...56
3.4.1. Data Input...56
3.4.2. Econometric Analysis...57
Chapter 5. Results and Discussion...59
1. Response patterns...59
2. Characteristics of respondents...59
3. Model estimation and interpretation...61
4. Model fit...63
5. Importance of attributes...63
6. Socio demographics interactions...64
7. Marginal Willingness to pay...65
8. Interpreting the choice probability...66
Chapter 6: Conclusion...69
Bibliography...73
List of tables
Table 1 – Pharmaceutical Expenditure (Infarmed 2011)...16
Table 2 – Reimbursement Categories (Infarmed 2012)...20
Table 3 – Special Reimburse Schemes...21
Table 4 – The Design Stages Of A Dce...26
Table 5 – Summary Of The Literature Review For The Dce In Phamaceutical Fundng Decisions...38
Table 6 – First Set Of Attributes Selected...41
Table 7 – Selected Attributes, Its Levels And Sources...42
Table 8 – Severity Of The Disease For Which The Treatment Is Indicated...43
Table 9 – Prevalence Of The Disease In Portugal...44
Table 10 – Efficacy Of The New Pharmaceutcal...45
Table 11 – Government Cost Per Person Treated...46
Table 12 – Difference Between Two Versions Of The Questionnaire...52
Table 13 – Pilot Results...53
Table 14 - Respondents’ Characteristics...60
Table 15 – Resuts From Conditional Logit Model For Each Random And Non Ramdom Samples...62
Table 16 – Wtp And Mwtp For Each Attribute...65
Table 17 – Experimental Design Result...80
Table 18 – Coding Attributes...81
Table 19 – Probability That A Respondent In Random And Non Random Sample Would Choose A Hypothtical Scenario:...86
List of Figures
Figure 1 - Template of a choice set including an opt-out alternative...31
Figure 2 - DCE Questionnaire (Question Template)...50
Figure 3 - The mixed-level orthogonal main effects plan MA 18.3.6.6.1 for the multinomial design...79
Figure 4 - Template of introductory post card (translated)...82
Figure 5 - Template of remembering post card (translated)...83
Figure 6 - 1st section of the questionnaire - warm up questions...84
Figure 7 - Distribution of educational level (graph1), professional situation (graph 2) and montlhy income (graph 3) for each sample...85
Figure 8 - Questionnaire (original)...87
List of Appendices
Appendix A...79 Appendix B...80 Appendix C...81 Appendix D...82 Appendix E...83 Appendix F...84 Appendix G...85 Appendix H...86 Appendix I...87Chapter 1. Introduction
1. Background
There is a general agreement that the market mechanism fails to allocate resources efficiently and equitable in the health care sector (Amaya-Amaya, Gerard & Ryan, 2008) . Hence, this task often falls to the government through public policies (Ryan, Scott, Reeves, Bate and Russell, 2001). In the absence of market forces as the defini-tion of the allocadefini-tion of resources, policy makers seek alternative means of choosing between competing demands on the health care budget. In other words, they set pri-orities. This priority setting has always been a feature of publicly financed health care systems (Hauck, Smith & Goddard, 2004), but some call for a more explicit approach.
The design of health policies raises an important question: how should public funds be allocated balancing the available scarce resources, the unlimited demand for health care services and the continuing rising health care expenditures? (Ryan et al. 2001) The European countries trust these issues to their National Health System (NHS) that has as a main objective the provision of medical services in line with cost-ef-fectiveness, quality and equitable principles (Mossialos, Mrazek & Walley, 2004). The appropriate criteria that should be used in setting priorities in a publicly funded health care, remains open to debate (Bryan et al., 2002) although cost-effectiveness methods have become popular.
The eventual goal of economic evaluation, in the context of health services is to make decisions about resources that fulfil the interests of society. It seems therefore perti-nent that the social values that fundament the decision process should be informed by the preferences of a representative sample of members of the society, who pay for and are eligible to benefit from the resource(s). (Farrar, Ryan, Ross and Ludbrook, 2000; Whitty, Rundle-Thiele and Scuffham, 2008; Koonal and Shah, 2010)
In Portugal, the health expenditure represents 10.4% of the GDP while the pharmaceu-tical expenditure represent over 15.5% on of NHS budget (INFARMED 2011). These
numbers, allied with the economic difficulties Portugal faces, result in a great pres-sure on the health care budget, particularly on pharmaceutical cost containment. The entry and financing of new pharmaceuticals is regulated by the National Authority of Medicines and Health Products (INFARMED, I.P.). The allocation criterion used is the potential health gain produced by an intervention, often measured in terms of Quality Adjusted Life Years (QALYs).
Although the exact amount is not officially defined, INFARMED is generally willing to pay € 30.000/QALY for reimbursement. For orphan pharmaceuticals the price raises to between €50.000 and €80.000 per QALY (Veiga, Correia, Meireles, Dias, 2011). INFARMED states that the decision rule followed under this approach is the maximization of health gain under budget constraints (Veiga et al. 2011). However, the definition of the exact amount INFARMED is willing to pay has been not subject to public scrutiny.
Little is known in Portugal about the preferences of the public, namely about the subsidy of pharmaceuticals. As the public is increasingly interested and engaged into public policies, its values should be used to inform better and more efficient policy. Moreover, public involvement may help to strengthen the relationship between citizens and decision makers, ultimately resulting in clinical, licensing, reimbursement, and policy decisions that better reflect the preferences of stakeholders, especially patients (Whitty, Rundle-Thiele & Scuffham PA, 2008). Aligning clinical practice, drug develop-ment, and health policy with patient preferences may also improve the effectiveness of health interventions, possibly improving the adoption of, satisfaction with, and ad-herence to clinical treatments or public health program (Koonal & Shah 2009).
2. Aim
The study seeks to investigate criteria considered important by the Portuguese public for allocating resources for pharmaceuticals. In particular, the importance of the se-verity of the disease for which the treatment is indicated, the prevalence of the disease in Portugal, the efficacy of the new pharmaceutical and the government costs per person treated.
fi-nancing. However, little is known about the preferences of the Portuguese public, namely about the financing of pharmaceuticals. Hence, the present study brings a fresh approach to the Portuguese pharmaceutical policy discussion.
3. Methods
We use a preference elicitation method, namely the discrete choice experiment (DCE), to elicit societal preferences. Individuals are presented with choice sets comprising different hypothetical combination of new pharmaceutical attributes: severity of the disease for which the treatment is indicated; prevalence of the disease; efficacy of the new pharmaceutical and government cost per person treated. The questionnaire was divided in three sections: a first part with some warm-up questions, a second section for the choice questions and a third one which aimed to gather information about demographics, health status and insurance coverage. Data were analysed with STATA 10® and are discussed from a policy design point of view.
4. Organization And Contents
A DCE requires a multidimensional approach of theoretical and practical stages. After the preceding introduction and reasoning of this work, chapter two intends to describe the Portuguese pharmaceutical sector, at a glance. Although the discussion of the pharmaceutical market is out of the scope of this work, it is important for the reader to acknowledge the Portuguese pharmaceutical context, for a better understanding of the framework and the results.
Chapter three summarizes the literature and seeks to describe the process through which the method was chosen. It focus on the use of DCE in health care, namely on pharmaceutical funding research.
Chapter four explains the method with emphasis on the main steps of the DCE. This includes the definition of the attributes and levels, the experimental design, the qual-itative work that tested the questionnaire, the sample design and the survey adminis-tration process. The presentation and discussion of the DCE are presented in chapter five and the conclusion that arises from them, take place on chapter six.
Chapter 2. Pharmaceutical Policy
Recent economic events had large influence on the managing of the state budget and the design of pharmaceutical policies. Namely, in May 2011, the Portuguese govern-ment agreed a reform program with an obligation to enforce healthcare budget cuts as part of austerity measures (Carone et al., 2012). The present chapter intends to summarize the main features of the Portuguese pharmaceutical funding context in order to contextualize the research and its results.
1. Pharmaceutical Expenditures
The Portuguese health system is based in three funding systems: the National Health Service (NHS), special social health insurance schemes for certain professions (health subsystems) and voluntary private health insurance. Health is pubicly financed with general taxes. Nonetheless, in general, the use of health care services and health products, including pharmaceutical consumption, is dependent on a co-payment (Vogler and Leopold, 2009)
The Portuguese pharmaceutical sector has been characterized by a substantial in-crease in expenditure since the beginning of the 1990s (Barros et al. 2011). This increase may be explained by demographic factors (e.g. the ageing population, devel-opment of chronicle diseases) and medical progress factors (e.g. introduction of new biological pharmaceuticals, which are more expensive) (Carone et al. 2012).
Rising health care costs as well as the global economic downturn has led healthcare payers to opt for austerity measures such as a reduction of healthcare budgets, price and reimbursement cuts, and the enhancement of generic uptake (Toumi, 2012). Re-cently, cost containment is a crucial target of policy makers and the expenditures are starting to slightly decrease. Table 1 represents the evolution of the pharmaceutical expenditures between 2007 and 2011. In 2011, the pharmaceutical expenditures rep-resented approximately 15,5% of the NHS budget (INFARMED, 2011), which contrast with the data from 2007, when the pharmaceutical expenditure was higher (17.9%).
More updated data is yet to be published, but, regarding the new pharmaceutical pol-icy, it is expected a maintenance on tendency to decrease expenditures.
TABLE 1 – PHARMACEUTICAL EXPENDITURE (INFARMED 2011)
2007 2008 2009 2010 2011
NHS Expenditure with pharmaceuticals in
NHS Budget 17.9% 18.3% 18.5% 17.7% 15.5%
NHS Expenditure in Medicines as a % of
GDP 0.83% 0.85% 0.93% 0.95% 0.78%
2. Pharmaceutical Policy
Several changes have been introduced to the NHS in order to reduce the public phar-maceutical expenditure. In the past decade Portugal implemented a wave of reforms. To design policy towards the demand of pharmaceuticals involves sensible decisions. Prescribed pharmaceuticals are generally considered as a cost-effective method of providing health care in the majority of patients. Rather than an exhaustive pres-entation and debate, in this section we summarize the more relevant aspects of the pharmaceutical policy for the present study mainly the reimbursement policy. Details of pharmaceutical policy can be found in (Veiga et al 2011). INFARMED is the entity responsible for the most relevant aspects of the pharmaceutical policy, mainly approv-ing the market entry and all pharmaceuticals to be reimbursed by the NHS , as well as setting their co-payment levels.
2.1. Reimbursement System
Pharmaceutical funding is provided through a reimbursement system for pharma-ceuticals listed in a positive list, currently defined in the Decree law nº 106-A of the 1st October. The World Health Organization (WHO), 2001, presents an interesting document, containing guidelines on “how to develop and implement a national drug
policy”. These guidelines refer that a national reimbursement system is an important part of a drug policy and a fundamental tool to apply the principles of equitable access to medicines and rationalization of pharmaceutical expenditures, objectified by health policies. WHO (2001), points health as a human right and states that the access to health must include the access to pharmaceuticals, as they play a crucial role in health care, providing a cost-effective answer to many health problems. Furthermore, barriers on the access to pharmaceuticals have socioeconomic consequences, in-creasing the human capital costs and the future health costs (Veiga et al. 2011). The health care market failures, namely uncertainty, dictate the presence of a national reimbursement system. Uncertainty lays on the impossibility to predict illness, its severity or its duration. Besides, the costs related to the disease may be unaffordable, even to those with high incomes (Veiga et al. 2011).
Based upon equity and social fairness grounds, it is expected that a national reim-bursement system contemplates a positive discrimination of vulnerable social groups such as elderly, children, chronic patients and individuals with low income. This re-sults in higher reimbursement levels to individuals considered vulnerable, reducing their coinsurance rates (Veiga et al. 2011). While there are solid arguments to support existence of a public reimbursement system for the funding of the pharmaceutical consumption, its prioritization criterion remains debatable.
2.2. Economic Evaluation Criteria
Economic evaluation methods to support decisions regarding pricing and reimburse-ment are gaining relevance in developed countries (Tele and Groot 2009). In Portugal, since 1998, economic evaluation has become more important for reimbursement decisions, guided by official guidelines for carrying cost-effectiveness studies. Firms that seek financing for a pharmaceutical product are required to submit the economic evaluation according to the Methodological Guidelines for Economic Evaluation Stud-ies, published by INFARMED in 1998. Companies must provide pharmacotherapeu-tic and pharmacoeconomic information demonstrating the therapeupharmacotherapeu-tic added value (ATV) related with the alternatives already reimbursed. The report has to follow the methodological document. Only after that, the pharmaceutical companies can apply for reimbursement to INFARMED Since then, the utilization of efficiency criteria in reimbursement decisions decisively increased.
Based on the pharmacological information in these documents, INFARMED makes prior appraisal of the new pharmaceuticals, placing it into one of six categories that make it eligible for reimbursement (INFARMED, 2013):
- Medicines that contain new therapeutic entities, with innovate mechanisms of action and higher efficacy and tolerability than the existing treatments;
- New medicines with a similar qualitative composition to others already marketed and reimbursed, with the same dosage form, and at a 5% lower price than the lowest priced, reimbursed, non-generic drug;
- New dosage form, new doses, or new packaging of already reimbursed drugs with the same qualitative composition, provided that there is a therapeutic and economic advantage;
- New medicines which do not possess a significant therapeutic innovation nor quali-tative composition to similar, already reimbursed medicines, but have an economic advantage compared to them;
- Combination products containing already reimbursed active substances, and the price does not exceed the sum of the prices of the same medicines when given alone in identical dosages;
- Combinations of active substances that don’t exist in the market alone and have shown advantage in clinical trials over drugs in the same therapeutic group.
The result of this evaluation is a pharmacotherapeutic report with information on: size of the package and strength needed; therapeutic alternatives; grade of additional therapeutic value (ATV), measure units of the product and alternatives (“Decree-Law No. 118/92, 25th June” 1992).
The application is then analysed to evaluate the economic advantage, based on the information provided by the applicant. If the product does not demonstrate an ATV compared to the alternative the economic evaluation is only based on the comparison of prices (considering the differences in daily posologies) (WHO 2007). In this case, the new pharmaceutical must have a lower price than the comparators in order to be approved to enter the reimbursement list.
Although the exact amount is not officially defined, INFARMED is generally willing to pay €30.000/QALY for reimbursement. To orphan pharmaceuticals the price raises to between €50.000 and €80.000 per QALY (Veiga et al. 2011)
Considering that the per capita income is low, and the companies do not risk placing most of the pharmaceuticals on the market without getting reimbursement, the
reim-bursement rules have come to be used as an instrument of price negotiation (Teixeira and Vieira 2008; WHO 2007).
2.3. Positive List
National reimbursement regulations are framed in an inclusive or exclusive criteria. The aim of the positive list is to limit the number of reimbursed pharmaceuticals. A positive list contains the drugs that will receive different levels of reimbursement. Overall, the positive list can have a cost-containment effect due to the pharmaceuti-cals companies’ behaviour, which are likely to set lower prices in order to secure their revenues by an increase in volume (Tele and Groot, 2009).
After the approval of the reimbursement status, each pharmaceutical is subjected to a reassessment, made by INFARMED, every three years. Criteria to delist pharma-ceuticals include, among others, excessive prices, lower therapeutic efficacy proven by a pharmacoepidemiologic study and the reclassification for OTC status without reasons of public health that justify its reimbursement (Decree-Law No. 205/2000 1st September).
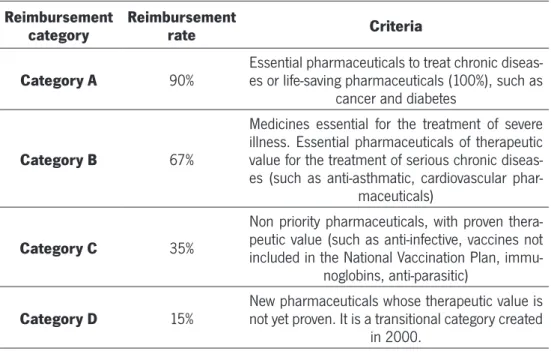
TABLE 2 - REIMBURSEMENT CATEGORIES (INFARMED 2012)
Reimbursement
category Reimbursement rate Criteria
Category A 90% Essential pharmaceuticals to treat chronic diseas-es or life-saving pharmaceuticals (100%), such as cancer and diabetes
Category B 67%
Medicines essential for the treatment of severe illness. Essential pharmaceuticals of therapeutic value for the treatment of serious chronic diseas-es (such as anti-asthmatic, cardiovascular
phar-maceuticals)
Category C 35%
Non priority pharmaceuticals, with proven thera-peutic value (such as anti-infective, vaccines not included in the National Vaccination Plan,
immu-noglobins, anti-parasitic)
Category D 15% New pharmaceuticals whose therapeutic value is not yet proven. It is a transitional category created in 2000.
2.4. Reimbursement Categories
Co-payments are the most used cost-control measures on the demand side in the European countries. . Cost-sharing mechanisms have been introduced mainly for two reasons: a) to ease the public expenditure burden on health, and b) to address the problem of moral hazard, namely unnecessary or frivolous use. From an economic point of view, co-payments are effective when price elasticity is higher, as in the phar-maceutical field (Tele and Groot, 2009).
After the inclusion in the positive list, the drug is classified in one reimbursement group .The Portuguese pharmaceuticals reimbursement scheme is divided into 4 cat-egories, as described in table 2. The legal basis of the reimbursement categories is settled by the Ordinance No. 924-A/2010 in which the reimbursement rates for phar-maceuticals are defined according to its pharmacotherapeutic group.
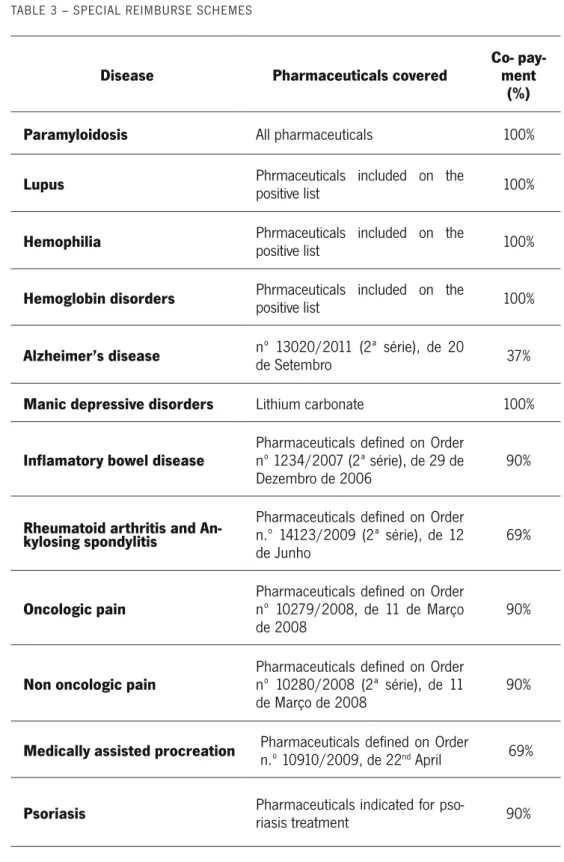
The reimbursement of pharmaceuticals indicated in specific pathologies or special groups of patients is subject to a special scheme (Table 3). Examples are the reim-bursed pharmaceuticals for haemopilia or for Alzheimer disease (“Decree-Law No. 205/2000 1st September” 2000; WHO 2007). It is clear that, at least at this stage of pharmaceutical financing, INFARMED does apply equity principles, favouring phar-maceuticals for chronic disease.
TABLE 3 – SPECIAL REIMBURSE SCHEMES
Disease Pharmaceuticals covered Co- pay-ment (%)
Paramyloidosis All pharmaceuticals 100%
Lupus Phrmaceuticals included on the positive list 100%
Hemophilia Phrmaceuticals included on the positive list 100%
Hemoglobin disorders Phrmaceuticals included on the positive list 100%
Alzheimer’s disease nº 13020/2011 (2ª série), de 20 de Setembro 37%
Manic depressive disorders Lithium carbonate 100%
Inflamatory bowel disease Pharmaceuticals defined on Order nº 1234/2007 (2ª série), de 29 de
Dezembro de 2006 90%
Rheumatoid arthritis and An-kylosing spondylitis
Pharmaceuticals defined on Order n.º 14123/2009 (2ª série), de 12
de Junho 69%
Oncologic pain Pharmaceuticals defined on Order nº 10279/2008, de 11 de Março
de 2008 90%
Non oncologic pain Pharmaceuticals defined on Order nº 10280/2008 (2ª série), de 11
de Março de 2008 90%
Medically assisted procreation Pharmaceuticals defined on Order n.º 10910/2009, de 22nd April 69%
Psoriasis Pharmaceuticals indicated for pso-riasis treatment 90%
Additionally, pensioners with low incomes have an extra co-insurance rate by the NHS. The rank in category A is increased by 5% and, in categories B, C and D, by 15%. This applies only for pensioners whose total annual income does not exceed 14 times the guaranteed minimum income (WHO 2007).
Chapter 3: Literature Review
1. The Use Of Stated Preferences In Health Care
There are several methods to elicit public preferences and the decision of which meth-od to use depends mostly on the gometh-ods in question (Ryan et al., 2001). The prefer-ence-based outcome is generally divided into two approaches: revealed preference (RP) and stated preference methods (SP). The first one, RP method, collects behavio-ral data by the exploration of people’s preferences as indirectly revealed through their choices in markets, specifically related to the value of interest. RP are difficult to use in the health care market for several reasons. First, willingness-to-pay (WTP) values for health care interventions or treatment alternatives are rarely available (Özdemir, 2009) as health care services have public good chracteristics (Gerard et al. 2008). There is an agency relationship between the supplier and the patient, as the former will generally be better informed than the latter (Gerard et al. 2008), which contrib-utes to bias in the RP outcome. This specific nature of health care market requires a different approach, which relies on stated-preference (SP) data. SP involves asking the same individuals to state their preferences in hypothetical markets (Gerard et al. 2008; Louviere, Hensher and Swait 2000) and are also useful to elicit preferences for goods that are not yet in the market (Ryan & Skåtun 2004), allowing decision makers to make well documented decisions in advance. Another reason for favoring SP tech-niques is that they are based on hypothetical choices that can be precisely specified in advance using a design that allows straightforward identification of all effects of interest (Gerard et al. 2008). This is in contrast to RP data, which cannot be controlled a priori so that model identification cannot be guaranteed (Amaya-amaya et al. 2008) as attributes are collinear in market data, making it impossible to predict the effect of independent variation in an attribute with RP (Kjær, 2005).
2. Theoretical Foundations Of The Discrete Choice Experiments
DCEs are an attribute-based approach that enables collecting SP data (Gerard et al. 2008). They are designed to allow individuals to express their preferences for non-marketed goods or goods which do not exist yet (Telser & Zweifel 2007). In a DCE, respondents are presented a sequence of hypothetical scenarios composed by two or more competing alternatives that vary along several attributes, one of which may be a cost attribute, as the out of pocket price of each alternative or its government cost. In each case, respondents are asked to indicate which of the presented scenarios they prefer. In this way an indifference hyper plane in attribute space is approximated (Telser & Zweifel 2007).
DCE characterize a consumer’s underlying utility function, and thus may improve policy makers’ ability to perform benefit transfers (Gerard et al., 2008). Furthermore, WTP is to be inferred indirectly rather than explicitly pricing the good. This is highly de-sirable in a health care context where, as mentioned, some individuals may refuse to place a monetary value on human health in the CVM format, increasing the incidence of protest zero bids (Gerard et al., 2008)
The theoretical foundation of the DCE is far from being linear as it comprises research on axiomatic conjoint measurements, information integration theory of psychology, random utility theory models in economics, discrete multivariate statistical models for contingency (crosstab) tables, and the optimal design of statistical experiments (Kjær 2005; Lancsar and Louviere 2008).
The discrete choice experiment is founded in random utility theory (RUT) and is con-sistent with Lancaster’s theory (1966) of characteristics and neoclassic economics. RUT plays a key role in the understanding and interpretation of the behavioural pro-cesses examined in the DCE and assumes that utility (U) for individual i conditional on choice j can be decomposed into an explainable component, Vij and a non-explainable random component Ɛij, as in equation 1 (Lancsar and Louviere, 2008) :
Ui j=Vi j+εi j , j=1 , …, J
(Eq.1) This random variation may be due to unobserved attributes affecting choice, inter-indi-vidual differences in utilities depending upon the heterogeneity in tastes, measurement errors and/or functional specification (Manski, 1977). The explainable component, is
a function of (at least) attributes of the good and the characteristics (covariates) of individual choosers, often modeled as shown in equation 2 (Lancsar and Louviere, 2008):
Ui n=V Xi j ,β+εi j
(Eq.2) Utility is a latent, unobserved quantity; it is assumed that the choices observed are indicators of utility. Respondent chooses option 1 if, and if only, its utility is higher than the utility of any other option in the set of J alternatives. Assuming a joint prob-ability distribution for, the probprob-ability P that utility is maximized by choosing option 1 (Lancsar and Louviere, 2008):
P(Yi=1)=P r o b(Ui 1>Ui j)
.=P r o b(Vi 1+εi 1>Vi j+εi j)
.=P r ob
(
Vi 1−Vi j>εi j−εi 1)
∀ j≠1(Eq.3) Where Y is a random variable denoting the choice outcome. DCE models are derived by assuming a distribution for the random component. For example, if the errors are independently and identically distribute (iid) as extreme value type 1 random variates, this results in a conditional logit specification for the choice probabilities (Lancsar and Louviere, 2008): P (Yi=1 )= e μ Vi l
∑
j=1 J eμ V i j , j=1 , …, J (Eq.4) 3. MethodologyThe DCE methods allow different approaches but there are some mandatory stages researchers need to go through in order to obtain the appropriate outcomes. It is crucial to carefully define the method, with acknowledge of the available time and how much will it cost. Ultimately, these choices have impact on the quality of the re-sults (Champ & Welsh 2006, Kjaer 2005). Although there is no gold standard on the
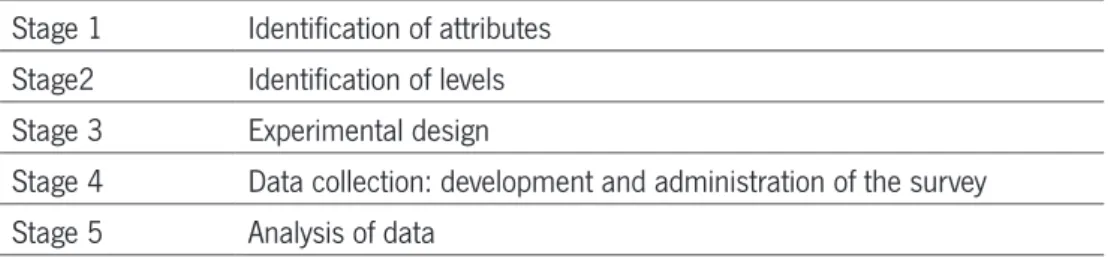
way to carry out a DCE, the approach taken here is the same suggested by Ryan, 1996 and described on table 4, for its reliability, simplicity and large use on health care field. In our study, stage one and two are presented together (Kjaer 2005).
TABLE 4 – THE DESIGN STAGES OF A DCE
Stage 1 Identification of attributes Stage2 Identification of levels Stage 3 Experimental design
Stage 4 Data collection: development and administration of the survey Stage 5 Analysis of data
3.1. Identification Of Attributes And Levels
While conducting a DCE, the researcher must focus carefully on the selection of attrib-utes and levels that will describe the good. The DCE potential of eliciting preferences based on the individuals’ valuation of the diferent levels of attributes that describe a good is the more attractive feature on the health care market (Amaya-amaya et al. 2008). While a DCE can not incorporte all relevant attributes, it is important to include the most relevant ones, that are meaningful for respondents and policy makers. If an important attribut is ommited, respondents can make assuptions about it, affecting the validity of the model estimated. This is an important issue to be assessed using qualitative work, such as pilot studies (Kløjgaard et al. 2012; Lancsar & Louviere 2006). The combination of the set of attributes must be able to describe what the choice is about, and the attributes must be chosen so that respondents will be willing to make trade-offs between them, following the latent economic theretical framework with compensatory decision-making. Further, and although it may sound appelaing to include a lot of attributes, researcher may guarantee that a limited number of at-tributes is included, in order to keep a simple and understandable task and to keep respondents commited to it. When defining the levels of each attribute, it is important to remain focus that, as the attributes’ levels must be relevant and easy to compre-hend. Besides, the range selected for the levels must allow for the trade-offs between them, while still being plausible for respondetns. In other words, a good experiment is one that balances a sufficiently rich set of attributes and choice sets, with enough variation in the attribute levels therefore being able to produce meaningful trade offs
(Amaya-amaya, Gerard, and Ryan 2008).
The best way to enhance all the desirable features of attributes and levels is to perform a good amount of qualitative work (Kløjgaard et al.2012). Qualitative work includes gathering information from various sources such as focus groups, interviews, expert opinions and literature review. (Kløjgaard et al. 2012).
3.1.1. The Cost Attribute
The cost attribute is a quantitative constrained and negatively valued attribute with a distinct role in DCE. Its inclusion provides the DCE an elicitation procedure for willing-ness-to-pay (WTP) or willingness to accept compensation (WTAC) for an improvement (or deterioration) of one of those attributes. This implies that benefits are estimated in monetary terms and causes the DCE to be consistent with welfare economics (i.e. the potential Pareto improvement condition) (Kjær 2005).
Inclusion of a cost attribute makes it possible to indirectly obtain the respondent’s WTP for either the good in its entirety (an alternative) or the respondent’s WTP for the attribute respectively, i.e. marginal WTP (also termed part worth or implicit price) (Kjær 2005). Results from different studies can then be compared and - on the grounds of economic efficiency - used in priority-setting. Rather than showing the price of the good, WTP is estimated indirectly. This is highly desirable in a health care context where, as mentioned, some individuals may refuse to place a monetary value on human health in the CVM format, increasing the incidence of protest zero bids (Gerard et al., 2008)
The use of cost to estimate WTP raises questions about the definition of the cost at-tribute in a collectively funded health care system, where the inclusion of cost might result in the scenarios being considered unrealistic and immoral (Ryan, 1999). Most health care services in Portugal, are paid at the point of consumption as a co-pay-ment, that is, part of the costs are supported by public funds, while the remaining is financed through user payment (Barros, 2011). Marginal WTP is simply the marginal rate of substitution in which the numeraire is the cost attribute. The estimation of wel-fare is based on using the coefficient of the cost attribute to assess the marginal utility of income (Kjær, 2005). Costs can take many different forms in a DCE, including options such as consumer price, transportation cost, salary, donation, tax payment, tax payment in a referendum context, etc. (Kjær 2005).
3.2. Experimental Design
The experimental design consists in framing the selected attributes and levels into choice sets (Kjær 2005). This stage focus on the design of the hypothetical choice sets, including the formation and pairing of alternatives within choice sets. One of the crucial objectives of the experimental design is to create the DCE in such a way that the number of alternatives is minimized while being able to infer utilities for all possible alternatives – which implies keeping the choice task simple to the respond-ents and at the same time being able to extract all the necessary information from the choices (Kjær 2005). A designed experiment is therefore a way of manipulating attributes and their levels to permit rigorous testing of certain hypotheses of interest (Louviere et al. 2000).
The total number of possible choice sets, the full factorial, depends directly of the number of attributes and levels, with an exponential relationship - the number of possible alternatives increases exponentially when the number of attributes and levels increases (number(#) of alternatives = #levels^#attributes). For example, if there are five attributes, three with four levels and two with two levels, the full factorial produces 256 combinations. Commonly, it is not possible to present respondents with all possi-ble alternatives and a reduction of the number of choice sets must be done. First of all, it is important to reduce the number of attributes and level to a minimum. Next, methods exist that can reduce the number of alternatives included in the question-naire, while keeping the statistical properties of the design. One such method is the use of orthogonal arrays. Orthogonal designs are based on orthogonal arrays from design catalogues (e.g. Hahn and Shapiro,1966), statistical programs (e.g. SPEED, (Bradley, 1991); SPSS, (SPSS Inc., Chicago, IL, USA)) or web-sites (Sloane, 2009). These arrays have the properties of orthogonality (attributes are statistically independ-ent of one another) and level balance (levels of attributes appear an equal number of times). The profiles obtained from the orthogonal design are the choices for a binary DCE (de Bekker-Grob, Ryan & Gerard 2012). However, it is important to be aware that all fractional designs involve some loss of statistical information. This loss of informa-tion can sometimes be significant, as fracinforma-tional factorial designs limit the ability to take higher order effects into account, i.e. interactions between two or more attributes (Louviere et al. 2000).
3.2.1. Ensuring Design Efficiency
As mentioned, the use of a fractional design compromises the amount of information collected and the quality of such information. In order to minimise biases, it is impor-tant to test the design for its efficiency. What appears to be imporimpor-tant is the pairing of the alternatives into choice sets. The pairing of alternatives needs to be made in such a way that the differences in attribute levels for each choice set are not multi-correlat-ed. In addition, as only a fraction of the total possible alternatives is to be presented to the respondents in fractional factorial design, the selection of alternatives also needs to considered in the light of design efficiency. Theory supports the satisfaction of some properties to ensure the maximum statistical efficiency in choice design (i.e. the extraction of maximum information from the choice task). Together, these principles are called design efficiency, also termed D-efficiency. D-efficiency relates to the design matrix in such a way that efficiency is maximized when the size of the covariance ma-trix of the estimated parameters is minimized. To optimize D-efficiency, four principles need to be considered simultaneously. Improving any principle, holding the others constant, improves efficiency. In many cases it is impossible to create a design that satisfies all four principles, as some of the principles might conflict with each other (Huber & Zwerina 1996).
Level balance simply means that the levels of an attribute occur with equal frequency in the design, e.g. each level of a four-level attribute should occur in precisely one-fourth of the included alternatives. This ensures that all levels are weighted equally in the trade-off options that the respondent faces (Huber & Zwerina 1996. The use of a block design or a fractional factorial design, level balance needs to be taken into consideration in order to optimize efficiency.
Orthogonality is an important part of D-efficiency. Orthogonality is respected when the joint occurrence of any two levels of different attributes appears in profiles with fre-quencies equal to the product of their marginal frefre-quencies (Huber & Zwerina 1996). Orthogonality is thus satisfied when the difference in the levels of each attribute varies independently over choice sets, meaning that the levels of the attributes vary in a criss-cross manner. As ‘pure’ optimal orthogonal designs are only available for a very small number of very specific problems, the primary purpose is to optimize the design as best one can by minimising multicollinearity (Kuhfeld et al. 1994). A high degree of multicollinearity will result in a design in which unique estimates of the parameters cannot be obtained, making it impossible to draw any statistical inferences, i.e.
hy-pothesis testing, from the sample
Minimal overlap relates to the statistical properties when pairing the alternatives. A design has minimal overlap when a level does not repeat itself in a choice set. In order to optimize orthogonality of the level differences, the scenarios are matched to ensure minimal overlap (i.e. optimal orthogonality ensures minimal overlap). Minimal overlap is important in choice designs, because the contrast between attribute levels is only meaningful as differences within a choice set. Minimal overlap ensures that the probability of an attribute level repeating itself in each choice set is as small as possible, and thus maximizes the information obtainable from the choice sets (Huber & Zwerina 1996).
Utility balanced is present when the utilities of alternatives within each choice set are approximately equal. To achieve this, the researcher needs to take the utility weights of the attributes into account when designing the DCE. The rationale for this principle is to ensure that respondents are actually trading. The efficiency gain arises because choices between alternatives that have similar utility provide better information about the coefficients. This means that two alternatives that differ in their levels but have approximately the same utility are more likely to ensure that the respondents are placed in a situation in which they are forced to trade. Application of the utility bal-ance concept thus implies that the impact on choices of small differences in utility is registered resulting in more precise parameter estimates. What makes this principle troublesome, however, is that it requires prior estimates of the coefficients. There are several ways to generate useful sets of prior estimates. The most used method is to conduct a small pilot study to generate tentative estimates. Huber & Zwerina (1996) have shown that the incorporation of the utility balance principle increases efficiency of the DCE.
3.3. Data Collection
This section involves all the remaining issues that need to be considered before the questionnaire is presented to the respondents (Kjaer,2005). This includes several decisions such as the lay-out, whether to include an opt-out alternative, the inclusion of socio-demographic questions and warm-up questions.
3.3.1. Opt-Out Choice
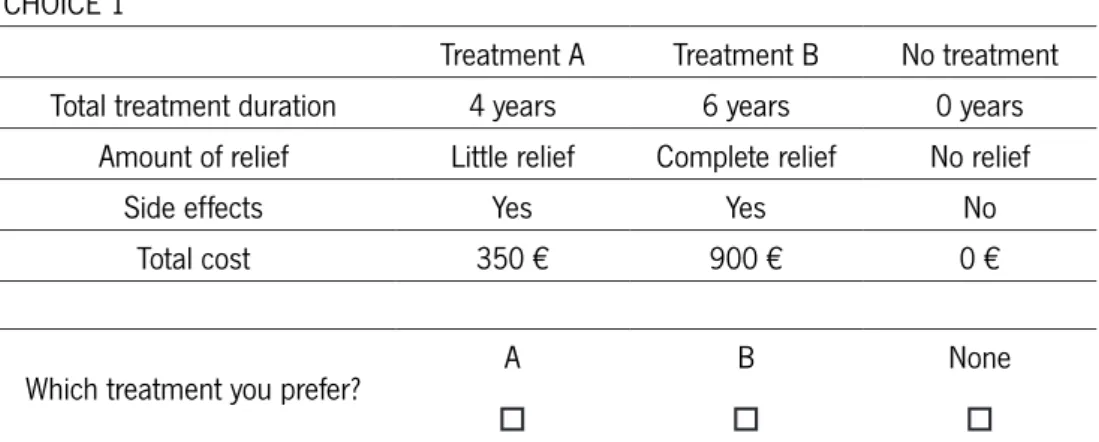
One important issue to consider while designing a DCE is whether to include or not an opt-out choice. Opt-out choice allows the possibility for the respondent not to choose any of the alternatives in the choice set, as demonstrated in figure1. There is literature supporting both decisions and the reasoning for the choice stands mostly on the na-ture of the experiment (Kjaer, 2005).
The inclusion of an opt-out alternative in DCE is becoming popular , as it allows for realism (deBekker-Grob et al., 2012). Ryan and Skatun (2004), explain that, in the health care context, individuals may prefer not to take-up certain treatments or ser-vices, whatever the level of attributes of the service, or prefer to participate only for certain levels of attributes.
FIGURE 1 - TEMPLATE OF A CHOICE SET INCLUDING AN OPT-OUT ALTERNATIVE
CHOICE 1
Treatment A Treatment B No treatment
Total treatment duration 4 years 6 years 0 years
Amount of relief Little relief Complete relief No relief
Side effects Yes Yes No
Total cost 350 € 900 € 0 €
Which treatment you prefer? A
o
B o
None o
Taking the example in Figure 1, if the maximum willingness to pay of a respondent is 300€, he would, in such choice set, opt for the “none” alternative. If the design did not allow for an opt-out choice, a forced answer would result in overestimates (identifying demanders that would opt-out) Ryan and Skatun, 2004). Nonetheless, the omission of the opt-out alternative is still considered in the heath care market DCEs. Firstly, re-spondents may tend to avoid difficult responses such as ethical ones, using heuristics to make the task easier. (Kjaer, 2005). Additionally, allowing respondents to select an opt-out option provides less information on respondents’ relative preferences for the attributes in the hypothetical alternatives. Forced experiments constrain respondents to express a preference (i.e., make a trade-off among attributes) even when both
alternatives are unattractive (Mentzakis, Stefanowska & Hurley 2011). Hensher, Rose and Greene (2005), argue that such a design is preferred when the objective of the study is to examine the impact of the relationships different attribute levels have upon choice. For the present study, it was decided to design a forced-choice DCE as the investigation sets on ethical and policy principles.
3.3.2. Introductory Text
Before the respondents answer the DCE, it is important to firs introduct them to the task. The introductory text should define the aim of the study, the importance of the respondents’ participation on such study and why he was selected to participate (Kjaer 2005).Then, an introduction to the task, including the time it takes to complete the questionnaire and the instructions should also be a part of the introductory text (Benett and Blamey 2001). Adding an example of an answered choice set and warm-up questions may increase the validity of the responses (Kjaer 2005)
3.3.3. Sampling
The sample design specifies the population of interest, the sampling frame, and the technique for drawing a sample from the sampling frame. How the survey is adminis-tered the survey mode -- will impact how a sample is drawn (Champ & Welsh 2006). The mailed questionnaire approach is – for good reason – by far the most widespread data collection method for DCEs in many research areas, including health economics. Some of the advantages with this method are the relatively small cost compared to the amount of information gathered and the fact that respondents can chose to com-plete the questionnaire when it suits them. However this method tends to result in low response rates and thus sampling bias. A postal questionnaire limits the complexity of the choice task as the respondents must be able to answer the questions without help. Furthermore, the questionnaire needs to be written in simple language in order not to discriminate against individuals who are unused to completing forms and un-derstanding written material. (Champ & Welsh 2006. Kjaer, 2005)
survey sample) will depend upon the nature of the particular application. The sam-pling frame defines the universe of respondents from which a finite sample is drawn to whom the data collection instrument will be administered (Louviere et al. 2000). If the study intends to examine the use value of asthma medication, then the most appropriate frame would be asthma patients. If the aim of the study is to examine use as well as non-use and option value, however, then the appropriate frame would be the general public.
Based on the sampling frame, the sampling strategy and sample size are determined. One sampling strategy is simple random sampling, in which all individuals from the sample frame have equal opportunity to be chosen as potential respondents; anoth-er sampling strategy might be dividing the frame into groups, each representing a portion of the population, depending upon characteristics such as sex, income, resi-dential location etc. (Louviere et al. 2000). It is possible to determine the appropriate sample size by using of elementary statistics and can be calculated through online services. In a mailed survey, the size of the sample depends on the number of ques-tions given each respondent, the size of the population, and the statistical power that is required of the model derived. Bennett & Blamey (2001) state that the minimum size of a sub-sample should be in the order of 50 respondents, depending on the sta-tistical power that is necessary for the estimation procedure. Furthermore, the sample size will be highly dependent on the expected response rate. To increase sample size (when using postal questionnaires), it might be appropriate to send out a reminder in the event of non-response.
3.4. Data Analyses
3.4.1 Data input
After the data are collected, it needs to be organized and set into a computerized database. Each choice set contains two forms of information: the attribute levels of each alternative, and which of the given alternatives has been chosen. To estimate the model, each attribute is handled as a variable containing different levels and each level has to be coded in order to estimate the importance of each attribute, i.e. the marginal values and trade of ratios (Louviere and Hensher 2000). When designing a
DCE it is important to consider how the exploratory variables are going to be coded. Dummy variables are used to account for this approach, and the least desirable option defined acts as a reference case. A priori the coefficients for severity of the disease for which the treatment is indicated, prevalence of the disease and efficacy of the new pharmaceutical are expected to have a positive sign, indicating an increase in utility (probability of being chosen for funding) relative to the reference case (constant). The use of dummy variables is helpful in interpreting the findings of the study, at a policy level, providing a meaningful reference case for a health policy audience (Louviere and Hensher 2000 ; Green and Gerard 2009).
3.4.2 Econometric Analyses
In econometric literature conditional logit models are often employed estimate the choice models (Greene, 2003). It differs from ordinary logistic regression in that the data are divided into groups and, within each group, the observed probability of posi-tive outcome is either predetermined due to the data construction (such as matched case–control) or in part determined because of unobserved differences across the groups (Gould, 2000). This is in line with the underlying RUT. Thus, the likelihood of the data depends on the conditional probabilities, that is, the probability of the observed pattern of positive and negative responses within group conditional on that number of positive outcomes being observed. Terms that have a constant within-group effect on the unconditional probabilities — such as intercepts and variables that do not vary — cancel in the formation of these conditional probabilities and so remain unes-timated). In this model, an individual is faced with an array of alternatives and must choose one. Individual taste can be captured in conditional logit models as long as it varies systematically with respect to observed variables (McFadden, 1973).
Once a satisfactory model has been estimated, the results obtained can be used to simulate outcomes that can be used in policy analysis or as components of decision support tools.
Furthermore, DCE allow estimation of trade-offs that respondents make between at-tributes, defined as marginal rates of substitution (MRS) (Lancsar and Louviere 2008; Ryan 1999). Following the standard consumer theory, MRS is calculated comparing the estimated coefficients of two attributes. MRS indicates the trade-off between two attributes that characterize the good and thus the mutual importance of the attributes
in question. Holding the overall utility level constant:
∂Vi= β ∂ xi=0
(Eq.5) And MRS is calculated through equation 6:
M R S12= −d xi 1 d xi 2 = β1 β2 (Eq.6) When one of the attributes is a cost attribute, the MRS indicates the willingness-to-pay (WTP) for a change in the qualitative attribute, i.e. the marginal willingness-to-pay (MWTP). Let the price attribute be denoted as p. As income cancels out in linear price models (hence the negative sign of the cost variable in equation 7), marginal WTP is derived (Ryan et. al 2008):
(Eq.7) Applications of DCE to economic policy (e.g. health and health care) are often targeted to predictions of behaviour, generating welfare measures or both. This is done by the comparison of the relative importance of the good attributes. The probability that respondents will choose each alternative in a choice set is calculated using equation 3, a conditional logit specification for the choice probabilities which allows comparison of the impact of each attribute in a common metric.
4. Discrete Choice Experiments In Pharmaceutical Funding Decisions: A Review Of The Literature
A comprehensive electronic search was carried out to identify published studies using DCEs within the pharmaceutical funding context. Portuguese and English language studies, between January 1992 and March 2013, were searched through MEDLINE, SCOPUS and RePEc database. Studies that matched the required criteria were se-lected, that is, that included a stated preference study to investigate preferences for funding decision of pharmaceuticals. Search strategies were formulated for individual databases using the following keywords: ‘discrete choice’ or ‘discrete choice experi-ment’ or ‘discrete choice analysis’ or ‘discrete choice modelling’ or ‘conjoint’ or ‘con-joint analysis’ or ‘stated preference method’ AND ‘pharmaceuticals’ or ‘medicines’ or ‘drugs’ or ‘pharmaceutical funding’ or ‘pharmaceutical funding criteria’ or ‘pharma-ceutical funding decisions’ or ‘reimbursement’ or ‘pharma‘pharma-ceutical reimbursement’. There are a limited number of DCE experiments eliciting preferences for pharmaceu-tical funding decisions. The few existing studies were, however, crucial in elucidating the suitable methods, some of the motivational factors behind choosing treatments and supporting the attributes selection and shaping the design.
Presented in table 5 are the four research articles found that matched the defined criteria. The table is organized according to the target population of the study. The first presented study, conducted by Whitty et al. (2008), seeks to quantify criteria considered important by the Australian public for allocating resources for pharma-ceuticals. A DCE was administered to two samples of adults in Australia. A total of four attributes were selected, based on the principal that public are willing to trade between the individual components of effectiveness (that is, survival, quality of life (QoL), and chance of success) for the treatment of others. Further, this study aims to investigate the importance of government costs in prioritizing healthcare, including a government cost attribute. According to their findings, the Australian public view the QoL after treatment, survival after treatment and chance of success associated with a new pharmaceutical to be important considerations when funding pharmaceuticals for the treatment of others suffering a severe disease. Furthermore, this study con-cludes that, when framed in terms of a government tax fund payment vehicle, the cost of the pharmaceutical is important to the respondents.
An interesting point of view is given by Diaby et al. (2011), with the investigation phy-sicians’ preferences when selecting reimbursable drugs and the analyzes of trade-offs
between criteria for formulary listing in Côte d’Ivoire. In order to do so, a DCE was ad-ministered, considering four attributes: cost effectiveness, severity of the disease for which the treatment is indicated, social class and age. Respondents’ relative weight-ings of four criteria were to be significant in selecting reimbursable drugs, being cost effectiveness, severity of the disease and social class the more relevant, in this exact order. This work sets foundation on studies that have demonstrated the feasibility of simultaneously accounting for efficiency, equitity and social criteria in a way that allows a rank ordering of health interventions.
Another study focusing on elicitation of preferences of health care professionals was held by the All Wales Medicines Strategy Group (AWMSG), which is a Welsh Govern-ment-funded body consigned to appraise new medicines for use in NHS Wales when NICE guidance is not imminent. The primary aim of this DCE was to explore the preferences of AWMSG appraisal committee members for specific new medicines adoption criteria and their efficiency trade-offs. Moreover, it aims included exploration of the external validity of the DCE by comparing appraisal committee members’ hy-pothetical recommendations against actual AWMSG recommendations for the use of new medicines in Wales. The conclusions set that QALY maximisation and economic efficiency are not the only considerations of committee members when making rec-ommendations on the use of medicines in Wales, as respondents were willing to trade over other attributes.
Finally, Whitty et al., 2011, carried out a pilot DCE in Australia to test the concept of evaluating the consistency of public and decision maker preferences for the public subsidy of pharmaceuticals. Here the preferences of members of a pharmaceutical funding decision-making body are compared with those of the public on whose behalf decisions are made. The elicitation of preferences was based on the relative impor-tance of gains in survival, quality of life (QOL), chance of response success and gov-ernment costs in pharmaceutical funding decisions. The DCE was administered to a sample of the Australian public and members of the Pharmaceutical Benefit Advisory Committee and its Economic Subcommittee. For both samples, increased survival, QOL and chance of response success, and a reduction in costs and uncertainty (de-cision makers only), were relevant and increased the likelihood that a pharmaceutical would be chosen for funding. Moreover, both samples were more likely to fund a phar-maceutical that was used for the treatment of severe illness. Besides pointing out the relative importance of decision criteria, this study suggests the consistence of funding decisions for pharmaceuticals with the preferences of society.
TABLE 5 – SUMMARY OF THE LITERATURE REVIEW FOR THE DCE IN PHAMACEUTICAL FUNDNG DECISIONS
Study/coun-try Study focus Attributes
Study design and estimation
method Key findings and conclusions
Public Preferences Whtty et al. 2008. Australia
Public preferences for allo-cation resources for phar-maceuticals
Chance of success, Survival, Quality of life, Additional cost
Fractional factorial additive main effects design obtained from SPSS. Multinominal logit (MNL) model.
Public consider QoL after treatment, survival after treatment and chance of success of a new ceutical important attributes when funding pharma-ceuticals for the treatment of others suffering a severe illness.
Decision Makers/Health Professionals Preferences Diaby et al,
2011. Canada
Preferences of physicians in Côte d’Ivoire when se-lecting reimbursable phar-maceuticals
Cost effectiveness of treatments, severity of the disease, age and social class
Optimal design for proposed by Street et al, 2005. Binary logistic regression, STATA 8.0
Preferences of physicians in Côte d’Ivoire are based on cost effectiveness, severity of disease, and social class.
W. Linley, D. Hughes, 2013. UK
Preferences of All Wales Medicines Strategy Group (AWMSG) appraisal com-mittee and appraisal sub-committee (New Med-icines Group) members (‘appraisal committees’) for specific new medicines adoption criteria
Main impact of disease before treat-ment, annual number of patients to be treated, QALYs gained per treat-ed patient, incremental cost per QALY gained, uncertainty in cost effectiveness is thoroughly explored
Fractional factorial de-sign, we therefore used an orthogonal main effects plan from Shaphira’s catalogue, 1996. Conditional logit, main effects only, STATA10.1
A willingness to trade the cost effectiveness and QALY gains against other factors indicates that economic efficiency and QALY maximisation are not the only considerations of committee members when making recommendations on the use of medicines in Wales
Public Vs. Decision Makers Preferences Whitty et al.
(2011) Aus-tralia
Evaluate the consistency of public and decision maher preferences for the publc subsidy of pharmaceuticals
Chance of response success, survival, quality of life (QoL), cost to government per person treated. Uncertainty around the chance of response success (only for decision makers)
Orthogonal array from SPSS and Shifted Design technique. MNL and mixed logit (MXL)
For both samples, increased survival, QOL and chance of response success, and a reduction in cost and uncertainty (decision makers only), increased the likehood that a pharmaceutical would be chosen for funding. Pharmaceuticals used for the treatment of severe disease were also more likely to be funded.