Revista Agrarian
ISSN: 1984-2538Costa Junior et al. (2011)- Dourados, v.4, n.14, p.303-312, 2011 303 Carbon, nitrogen and biomass activity under different managements system in Rio Verde – Goiás
State (Brazil)
Carbono, nitrogênio e atividade da biomassa microbiana sob diferentes sistemas de manejo em Rio Verde – GO (Brasil)
Ciniro Costa Junior1, Marisa de Cassia Piccolo2, Marcos Siqueira Neto1, Jaime Felipe Medina Sotomayor3, Martial Bernoux4
1
Universidade de São Paulo, Laboratório de Biogeoquímica Ambiental, Centro de Energia Nuclear na Agricultura (CENA-USP). Avenida Centenário, 303, Caixa Postal 96, CEP 13400-970, Piracicaba (SP), Brazil. E-mail:
2
Universidade de São Paulo, Laboratório de Ciclagem de Nutrientes, Centro de Energia Nuclear na Agricultura (CENA-USP), Piracicaba (SP), Brazil.
3
Universidade de São Paulo, Departamento Ciências Florestais, Escola Superior de Agricultura "Luiz de Queiroz" (ESALQ-USP), Piracicaba, SP, Brazil.
4
UMR Eco&Sols, Institut de Recherche pour le Développement (IRD), França. Recebido em: 06/11/2009 Aceito em: 18/10/2011
Abstract. The aim of this study was verify alterations in soil biologic attributes under different management systems at Cerrado. Soil samples were taken at dry (july 2006) and wet (february 2007) season at Red distrofic Oxisol (50 – 70 % clay) in Rio Verde, Brazil (17o39’07’’S - 51o06’49’’O) under: native Cerrado (CE), 20 years old pasture (PA), 29 years old conventional tillage (CT), and 10 and 15 years old no-tillage (NT - 10 and NT - 15). Were analysed: soil and microbial carbon and nitrogen levels (C, N, Cmic and Nmic), Cmic:C and Nmic:N ratios, basal respiration (BR) and metabolic quotient (qCO2). Higher soil moisture at
wet season led 100 % higher Cmic and Nmic and lower qCO2 level than dry season. Among the management
systems, the grass cultivation, animal wastes and area reform were possibly majors factors with which led to higher Cmic e Nmic values in PA, indeed under degradation, than any other one. NT adoption was important to increase Cmic and Nmic, and at least after 10 years pointed out higher values than CT.C and N microbial were more sensitive than total C and N, while other biological parameters also did not show differences. Keywords. Soil organic matter, no-tillage, pasture, conventional tillage.
Resumo. O objetivo desse estudo foi verificar alterações em atributos biológicos do solo sob diferentes sistemas de manejo no Cerrado. Amostras de solo foram coletadas nas épocas secas (julho de 2006) e chuvosa (fevereiro de 2007) em um Latossolo vermelho (50 – 70 % de argila) em Rio Verde, Goiás (17o39’07’’S - 51o06’49’’O) sob: Cerrado nativo (CE), pastagem com 20 anos (PA), sistema convencional com 29 anos (CT) e dois sistemas plantio direto com 10 e 15 anos (NT - 10 and NT - 15). Foram analisados: carbono e nitrogênio total e microbiano (C, N, Cmic e Nmic), razões Cmic: C e Nmic:N, respiração basal e coeficiente metabólico (qCO2). Maior umidade do solo na estação chuvosa conduziu a valores 100% maiores
de Cmic e Nmic e menor de qCO2 que a estação seca. Entre os sistemas de manejo, o cultivo da gramínea, os
dejetos animais e a reforma da área foram possivelmente os principais fatores que levaram a maiores valores de Cmic e Nmic sob PA, mesmo sob degradação. A adoção do NT foi importante fator no aumento de Cmic e Nmic e em ao menos10 anos mostraram maiores valores que CT. O C e N microbianos foram mais sensíveis comparado aos valores de C e N totais, enquanto os outros parâmetros biológicos não mostraram diferenças.
Palavras-chave. matéria orgânica do solo, sistema plantio direto, pastagem, sistema plantio convencional. Introduction
Cerrado biome occupies about 204 million hectares of the Brazilian territory and nowadays is
responsible for 30 % of the grains national production (50 % of soybean, 20 % of maize, 15 % of rice and 11 % of beans) and 40 % of the national
Revista Agrarian
ISSN: 1984-2538Costa Junior et al. (2011)- Dourados, v.4, n.14, p.303-312, 2011 304 livestock. Inadequate soil management has
influenced in the fertility reduction, increase of erosion and consequently higher production costs (Fundacao Pro-Cerrado, 2003).
Deforestation of the natural vegetation through agriculture introduction generally changes carbon (C), nitrogen (N) and nutrients cycles because of faster and continuous decomposition of soil organic matter (SOM), carried out by microbiological activity (Malavolta, 1987).
Acting in mineralization and immobilization processes, the microorganisms may be considered as a source or sink of nutrients (Singh et al., 1989). Since it takes part in practically all processes of transformation in soil, carbon and nitrogen soil microbial biomass (Cmic and Nmic) may also be used as an indicator of soil land use change and management practices (Perez et al., 2004).
In Brazil, no-tillage system (NT) was developed in response to avoid soil erosion and continuous declines in land productivity under conventional systems based on soil tillage operations (CT). The main environmental reasons for the development of NT systems was to (i) protect the soil surface from sealing and crusting by rainfall, (ii) achieve and maintain an open internal soil structure and (iii) develop the means for safe disposal of any surface runoff that would nevertheless still occur; characteristics that may also improve SOM (Bayer et al., 2006).
While in native pasture and well managed areas accumulate SOM, rendering them as a sink for atmospheric C. The high biomass production (especially by roots) of the tropical grass Brachiaria spp is probably responsible for maintaining or even increase SOM comparable to the Cerrado, as reported by many studies (Roscoe et al., 2000). However, most of the cultivated pastures at Cerrado have been experiencing some degree of degradation, low input and no maintenance, what means that they have lost, to some extent, their capacity to produce biomass and do not contribute to improve SOM, even decreasing that level (Silva et al., 2004).
In spite of soil biological interesting under natural and agricultural systems, searching about impact of different management systems in its
activity are recent in the Cerrado biome (Matsuoka et al., 2003). Besides the seasonal influence in soil biomass which its variations could bring wrong interpretations when is used as indicative. Thus, is need bigger range of knowledge concerning local variations to properly estimative of soil changes (Cattelan & Vidor, 1990).
The objective of this work was to evaluate alterations of the microbial biomass C, N and activity (rainy and dry season) in a Red Latossol under different management system in the Brazilian Cerrado.
Material and Methods
Location, description and selection of study areas
The study areas were located in the municipality of Rio Verde (Goiás State – Brazil). The climate is classified as Köppen’s Aw - tropical with rains mainly from October to April and a pronounced dry season from May to September (Figure 1). The mean annual precipitation is 1550 mm year-1 and the mean annual temperature is 23.3°C. Soil is classified as clayey Oxisol (Latossolo Vermelho Distrofico with a clayey texture in the Brazilian classification) (Embrapa 2006), covered by predominantly native vegetation with the phytophysiognomy of woodland savanna with semi deciduous tree layers (Eiten 1972).
This study was part of a larger study to evaluate soil C stocks in a chronosequence under a no-till system, based on areas under conventional tillage, pasture and native vegetation cover (Siqueira Neto et al. 2010). The study areas were selected between april 2001 and october 2002 on the basis of interviews with farmers describing the areas and the soil management practices employed during this period. The interviews revealed two main types of annual management representing about 85 % of the cultivated area in the region: System A = soybeans or maize followed by gramineous crops (maize, sorghum or millet) (54 % of area), and System B = soybeans or maize with fallow (33 % of the area). The other types of management together represented 13% of the area. 48 fields, managed using System A were selected.
Revista Agrarian
ISSN: 1984-2538Costa Junior et al. (2011)- Dourados, v.4, n.14, p.303-312, 2011 305 Figure 1. Monthly means of temperature (maximum and minimum) (°C) and mean precipitation (mm) in Brazilian Savannas (Rio Verde – Goiás state, Brazil).
Preliminary soil samples were taken from three georeferenced points in each field that would be used to determine the pH, clay, silt and sand content and other chemical characteristics. The Radambrasil database (1981) was used to provide information on geology, geomorphology, pedology, vegetation and potential land use. The results of the analyses were compared with the database and checked using remote sensing techniques to select potential areas with the most homogenous soil attributes. Finally, areas were selected for setting up chronosequences for more detailed studies on long-term effects caused by these management systems. The fields selected were fairly homogenous as regards the type of soil management and characteristics influencing C accumulation in soil. In order to confirm the homogeneity, a soil profile was taken of the one meter layer to determinate the color (Munsell soil color charts, 1954), structure, presence of roots, soil macro fauna, charcoal in the horizon and soil texture, 13C/12106 C and 15N/14107 N isotopic composition and mineral composition by X-ray diffraction. Although the areas were scattered, it could be assumed that the environment had a uniform effect over all the experimental units so that the soil attributes and climatic conditions were homogeneous and appropriate for study.
A completely randomized experimental design was used, with six study areas, each with six pseudoreplicates in different topographical sites (Hurlbert 1984). The study areas were: 1) Cerradão (CE), a woodland savanna with semi-deciduous trees, 15 to 25 meters high; 2) 20 year old grassy
pasture (PA) (Brachiaria decumbens Stapf); 3) conventional tillage (CT) which had been used for soybeans for 29 years when the samples were collected; 4) an 10 year old no-tillage system (NT-10) previously cultivated conventionally for 12 years (at the time of sampling it was cultivated with soybeans followed by sorghum (Sorghum bicolor [L.] Moench)); 5) a 15 year old no-tillage system (NTM 12), previously cultivated conventionally for 10 years (at the time of sampling, it was cultivated with maize, followed by sorghum). Site location and physical and chemical characteristics of the 0 - 20 cm upper soil layer of the areas analysed in this study are shown at Table 1.
The NT areas were cultivated using a no-tillage cropping system with a permanent mulch of crop residues. Fertilizer management was similar every year in the areas under conventional and no-tillage systems. Soybean crops received 450 kg ha-1 of 02-20-18 NPK followed by 100 kg ha-1 of KCl as top dressing. Mean productivity was between 3500 and 4000 kg ha-1 of grain. Maize and sorghum crops received 550 kg ha-1 of 8-20-20 (NPK) during planting and 200 kg ha-1 of urea as top dressing, resulting in a mean productivity of 7500 kg ha-1 of grain for maize and 2300 kg ha-1 for sorghum. No fertilizer was applied in years when millet was grown, as millet was used only as soil cover and was not harvested.
Soil sampling and analyses
Soil samples for physical and chemical characterization of the areas (Table 1) were collected
Revista Agrarian
ISSN: 1984-2538Costa Junior et al. (2011)- Dourados, v.4, n.14, p.303-312, 2011 306 using stainless steel cylinders 0.085 m in diameter
and 0.05 m tall. The total mass and water content were measured in the laboratory and the soil bulk density was calculated. The pH was determined in water using a 1:2.5 soil:solution ratio. The soil texture was determined by measuring the density after dispersing the clay with hexametaphosphate and digesting the organic material using H2O2
(Embrapa, 1997). The total C and N contents were determined by dry combustion using a LECO CN-2000 elementary analyzer. The C and N stocks were calculated from the C or N content and soil density
(Bernoux et al. 1998). The cation exchange capacity (CEC) at pH 7.0 and base saturation (% BS) were calculated by determining the exchangeable cations (K+, Ca2+ and Mg2+) and potential soil acidity (H++Al3+). Exchangeable cations were extracted using ion exchange resin (Raij & Quaggio, 1983). The K+ content was determined by flame spectrometry. Ca2+ and Mg2+ contents were determined by atomic absorption spectrophotometry. H++Al3+ were determined by extraction in 1.0 mol Ca(OH)2 solution at pH 7.0 (Embrapa, 1997).
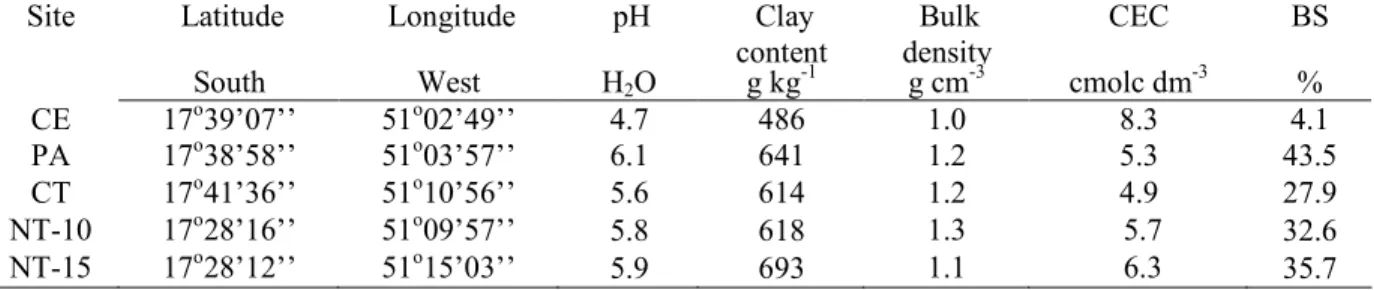
Table 1. Site location and physical and chemical characteristics of the 0-20 cm upper soil layer in different types of land use in the Brazilian Savanna (Rio Verde – Goias state).
Latitude Longitude pH Clay
content
Bulk density
CEC BS
Site
South West H2O g kg-1 g cm-3 cmolc dm-3 %
CE 17o39’07’’ 51o02’49’’ 4.7 486 1.0 8.3 4.1
PA 17o38’58’’ 51o03’57’’ 6.1 641 1.2 5.3 43.5
CT 17o41’36’’ 51o10’56’’ 5.6 614 1.2 4.9 27.9
NT-10 17o28’16’’ 51o09’57’’ 5.8 618 1.3 5.7 32.6
NT-15 17o28’12’’ 51o15’03’’ 5.9 693 1.1 6.3 35.7
* CEC = Cation exchange capacity, ** % BS = Percent base saturation The Cmic and Nmic were estimated in six
replicate soil samples collected using a spatula from the 0.00-0.05 and 0.05-0.10 layers. Samples were taken six times during the year: three times during the dry season (april, july and october, 2004), and three times during the rainy season (november 2003, january and december 2004). The fumigation-extraction method described by Vance et al. (1987) was used to estimate the soil microbial biomass. The C concentration in extracts was determined using a total organic carbon analyzer (Shimadzu TOC-5000A).
The N concentration was determined using the ninhydrin method (Joergensen and Brookes 1990). A correction factor of 0.33 was used to calculate the Cmic (Sparling & West, 1988) and a correction factor of 3.1 was used to calculate the Nmic which represents the efficiency of extraction of C and N ninhydrin, respectively (Sparling et al., 1993).
Basal respiration was determined by conductivimetric measurement of CO2 releases in
the microbial process during 10 days incubation (Rodella & Saboya, 1999) and showed in mg C-CO2
kg-1 soil h-1. The metabolic quotient (qCO2) was calculated using basal respiration and microbial biomass C data (mg C-CO2 kg-1 soil h-1: mg
microbial biomass C) (Anderson & Domsch, 1990). Cmic:C and Nmic:N relations were calculated by respective microbial C and N and total C and N and multiplied by 100 (percentage).
Variance analysis (ANOVA) was used to detect significant differences between the study areas. Averages were compared using a Tukey test (p < 0.05). A t-test was applied for Pearson linear correlations (p < 0.01 and 0.05).
Results e Discussion
Soil physical and chemical characteristics
The soil pH ranged from 4.7 for CE to 6.0 for PA and NT-15 (Table 1). The clay content ranged from 486 to 693 g kg-1. The soil density was lowest for CE (1.0 g cm-3) and highest for NT-10 (1.3 g cm-3), with intermediate values for the other areas. CE also had the highest cation exchange capacity (CEC), although it had the lowest base saturation (%BS). The highest %BS was found for NT-15.
Highest total C and N contents in the treatments were found at 0-5 cm in CE and intermediate at NT-10 and NT-15. Only at 5-10 e 10-20 cm total C in NT-10 and in NT-15 were higher than CT and PA. There were also higher total C in PA than CT only at 0-5 cm (Table 2).
Revista Agrarian
ISSN: 1984-2538Costa Junior et al. (2011)- Dourados, v.4, n.14, p.303-312, 2011 307 Table 2. Soil carbon (C) and nitrogen (N) (g kg-1) and C:N ratio of the 0-5, 5-10 and 10-20 cm upper soil layers for different types of land 1 use in the Brazilian Savanna (Rio Verde, Goias State)
Site Soil depht (cm)
0-5 5-10 10-20 0-5 5-10 10-20 0-5 5-10 10-20 C (g kg-1) N (g kg-1) C:N CE 38,9 a 22,4 a 20,0 a 2,2 a 1,2 a 1,3 a 17.5 18.7 15.0 PA 21,3 c 18,6 bc 16,9 bc 1,4 c 1,2 a 1,2 a 15.4 15.1 14.3 CT 19,8 d 17,1 c 15,6 c 1,4 c 1,3 a 1,1 a 13.9 13.1 14.1 NT-10 26,6 b 23,1 a 19,9 a 1,8 b 1,7 a 1,2 a 15.2 13.3 16.2 NT-15 30,1 b 23,0 a 19,3 a 1,9 b 1,4 a 1,1 a 15.6 16.1 18.4 Values represent mean (n=6) ± SD from the wet season, where different capital letters in lines and small
letters in columns differ significantly 1 (p < 0.05) on Tukey test. In the native area CE, the constant input of
vegetation residues to soil by high floristic diversity and no soil disturbance were the main characteristics that remain the higher C e N contents than all over studied areas (Six et al., 2000).
While the higher C and N contents under NT among cultivated areas suggested the benefit of its practices over conventional till and pasture in degradation, recovering the original C and N levels. It was possible due SOM input by crops that is undisturbed on the surface and no soil uprooting, these characteristics led lower SOM mineralization and its physical protection within stable aggregates (Metay et al., 2007).
In the other hand, the regular soil disturbance under CT induces high SOM oxidation leading C e N loss, reflecting one of the lowest levels reported (Table 2). In PA low grass productivity, intensive grazing and no maintenance practices may have contributed to lower C and N levels found (Table 2), because soils under well managed pasture generally accumulate C through high vegetation production and continuous radicular system renewal (Salton et al, 2008), attributes that contributing to increase organic residues into the soil which with sharing SOM accumulation process (Six et al., 2000).
Soil microbial C and N and ratios
The rainy season 60 % more humid than dry season (Figure 1) led values 100 % higher for Cmic, Nmic, Cmic:C, and Nmic:N (Table 3). These results were expected once soil microbial dynamics are most influenced by climatic variations as precipitation and temperature, with higher C and N assimilation and less run off rates (Espindola et al., 2001).
Gama-Rodrigues et al. (2005) studying eucalyptus crops in three Brazilian states (SP, ES e MG) and Araújo (2003) in pasture in Rio de Janeiro
(RJ-Brazil) also reported that characteristic between seasons (rainy and dry) in microbial biomass C and N, showing higher levels at rainy season. They reported moisture increase at rainy season as responsible for higher microbial activity and consequently higher C and N immobilization by soil biomass than dry season.
Among soil layers higher values were found at 0-5 cm layer than deeper layers analyzed (Table 3). These results pointed out biological activity concentrated in the surface due higher gases movement (CO2 and O2), residuals concentration,
and roots activity (Araujo & Monteiro, 2007). Cattelan & Vidor (1990), highlighted the surface (0-5 cm) as a place with higher moisture and temperature oscillations, which soil management and vegetative covering during different seasons (rainy and dry) lead variations in microbial development than deeper layers.
In general, independent of the management system adopted there were decrease the soil C and N microbial rates compared to CE to rainy and dry seasons, meaning lower suitable environment to microbial developing when soil is used to agriculture practices (Table 3).
Taken CE area as reference, for both rainy and dry season Cmic reductions were about 46, 55, 67 e 72 % respectively to PA, NT-15, NT-10 and CT), while to Nmic about 41, 55, 34 e 50 %, at dry season and 29, 70, 44 e 41 % at rainy season, respectively to PA, CT, NT-10 e NT-15. These results agreed with Matsuoka et al. (2003) in Primavera do Leste (MT), who related Cmic reductions at rainy season around 70% under perennial and annual systems (7 years under NT followed by 1 year under CT). And Perez et al. (2004), in the Brazil Federal District, who found to Nmic about 62 and 55 % in respectively CT and NT (dry season) grown with soy over 20 years
Revista Agrarian
ISSN: 1984-2538Costa Junior et al. (2011)- Dourados, v.4, n.14, p.303-312, 2011 308 Among the agriculture systems were not
observed the same C and N total pattern. Cmic were significantly higher under PA at dry season and under PA and NT-15 at rainy season compared to the other areas (Table 3). Nmic showed higher levels at PA in rainy season and lower levels under CT at dry and rainy season (Table 3).
The highest Cmic and Nmic (Table 3) in PA probably occurred due animal wastes (Garcia & Nahas, 2007) that releases nutrients and gives stimulus to microbial growing (Silva Filho & Vidor, 1984), besides grass cultivation which through its radicular systems releasing more roots exudates
which comes up increasing the microbial population at rizosphere (Carpenter-Boogs et al., 2003).
Garcia & Nahas (2007) reported higher Cmic and Nmic under pasture with animals than pasture reference (plain pasture) in Jaboticabal (SP-Brazil) at rainy season and highlighted that animal wastes
were responsible. Boogs et al. (2003) showed
highest Cmic value under pasture, intermediate value in no-till system and lowest in conventional till system in Dakota do Sul (EUA) and reported the continuous vegetation on the surface and roots effect as relevant factor.
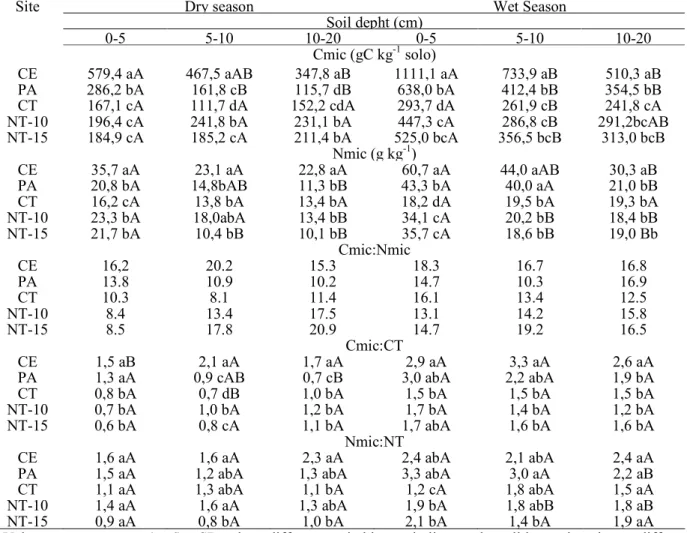
Table 3 Microbial carbon (Cmic) and nitrogen (Nmic) (g kg-1 solo) and microbial and total carbon and nitrogen ratios (Cmic:Nmic,Cmic:CT and Nmic:NT) of the 0-5, 5-10 and 10-20 cm upper soil layers for different types of land use and season in the Brazilian Savanna (Rio Verde, Goias State)
Site Dry season Wet Season
Soil depht (cm) 0-5 5-10 10-20 0-5 5-10 10-20 Cmic (gC kg-1 solo) CE 579,4 aA 467,5 aAB 347,8 aB 1111,1 aA 733,9 aB 510,3 aB PA 286,2 bA 161,8 cB 115,7 dB 638,0 bA 412,4 bB 354,5 bB CT 167,1 cA 111,7 dA 152,2 cdA 293,7 dA 261,9 cB 241,8 cA NT-10 196,4 cA 241,8 bA 231,1 bA 447,3 cA 286,8 cB 291,2bcAB NT-15 184,9 cA 185,2 cA 211,4 bA 525,0 bcA 356,5 bcB 313,0 bcB Nmic (g kg-1) CE 35,7 aA 23,1 aA 22,8 aA 60,7 aA 44,0 aAB 30,3 aB PA 20,8 bA 14,8bAB 11,3 bB 43,3 bA 40,0 aA 21,0 bB CT 16,2 cA 13,8 bA 13,4 bA 18,2 dA 19,5 bA 19,3 bA NT-10 23,3 bA 18,0abA 13,4 bB 34,1 cA 20,2 bB 18,4 bB NT-15 21,7 bA 10,4 bB 10,1 bB 35,7 cA 18,6 bB 19,0 Bb Cmic:Nmic CE 16,2 20.2 15.3 18.3 16.7 16.8 PA 13.8 10.9 10.2 14.7 10.3 16.9 CT 10.3 8.1 11.4 16.1 13.4 12.5 NT-10 8.4 13.4 17.5 13.1 14.2 15.8 NT-15 8.5 17.8 20.9 14.7 19.2 16.5 Cmic:CT CE 1,5 aB 2,1 aA 1,7 aA 2,9 aA 3,3 aA 2,6 aA
PA 1,3 aA 0,9 cAB 0,7 cB 3,0 abA 2,2 abA 1,9 bA
CT 0,8 bA 0,7 dB 1,0 bA 1,5 bA 1,5 bA 1,5 bA
NT-10 0,7 bA 1,0 bA 1,2 bA 1,7 bA 1,4 bA 1,2 bA
NT-15 0,6 bA 0,8 cA 1,1 bA 1,7 abA 1,6 bA 1,6 bA
Nmic:NT
CE 1,6 aA 1,6 aA 2,3 aA 2,4 abA 2,1 abA 2,4 aA
PA 1,5 aA 1,2 abA 1,3 abA 3,3 abA 3,0 aA 2,2 aB
CT 1,1 aA 1,3 abA 1,1 bA 1,2 cA 1,8 abA 1,5 aA
NT-10 1,4 aA 1,6 aA 1,3 abA 1,9 bA 1,8 abB 1,8 aB
NT-15 0,9 aA 0,8 bA 1,0 bA 2,1 bA 1,4 bA 1,9 aA
Values represent mean (n=6) ± SD, where different capital letters in lines and small letters in columns differ significantly 1 (p < 0.05) on Tukey test.
The higher Cmic and Nmic levels under NT-10 and NT-15 than CT at rainy season (Table 3),
suggests that longer no-till adoption was important factor to increase its characteristics and also at dry
Revista Agrarian
ISSN: 1984-2538Costa Junior et al. (2011)- Dourados, v.4, n.14, p.303-312, 2011 309
season both management systems showed similar microbial behaviour, possibly due unavailable moisture that decreases the metabolic process (Figure 1 and Table 3). According Boogs et al. (2003) the NT allows Cmic increasing due SOM oxidation reduction compared to the CT and both researchers found higher Cmic levels under NT than CT in the first 15 e 20 cm of soil in U.S.A. and reported that under CT the soil tillage bring about soil aggregates disruption and releases better core to speeding up oxidative process.
Costa et al. (2006) in Planaltina (DF-Brazil) at rainy season also reported (0-10 cm) higher Cmic values in NT than CT (soybean/maize) adopted, both systems, 10 years ago. And Vargas et al. (2005) in Eldorado do Sul (RS-Brazil) found Nmic levels affected by the management systems with higher values in NT (35 mgN kg-1) until 88 days after sowing in relation to the CT (19 mgN kg-1). The researchers concluded that higher Nmic level under NT led less N mineral to the soil. While Perez et al. (2005) did not verify differences to the Nmic between CT (24,82 mgN kg-1) and NT (21,12 mgN kg-1) at dry season.
Another important influence to be considered is the influence of the crops on the areas at sampling, due subtracts effects (Venzke Filho et al., 2004). However, the crops in this work were the same for all over the treatments at the rainy season, which were found the main differences. Thus, there is
possibility the results found were showing the management systems effect only.
The higher Cmic:C ratio (0-5 cm) at CE, PA only at dry season indicated greater microbial stability in these system, considering SMB one of the most sensitive index to alterations and soil management (Table 3). For the other agriculture areas, Cmic:C ratio were similar, showing that independent of C accumulation, the amount of SMB was not influenced by the crop cultivated. And the lowest Nmic:N only at CT (wet season) reflected a decreasing greatest cycling and availability of inorganic-N to the system (Table 1) (Venzke Filho et al., 2004).
When these ratios are applied (Cmic:C or Nmic:N) it is important to consider that it can be influenced by the type of vegetation, texture and fraction clay mineralogy (Sparling, 1992). It may, therefore, be restricted to one soil type and crop (G et al., 1994).
Basal respiration and qCO2
There were no difference among basal respiration (Table 4). Usually, this result is not enough indicative to explain the distinct behaviour among management system because high respiration values not always shows favourable conditions once it means fast nutrient release to the plants and perhaps means SOM loss (D’Andrea et al., 2001).
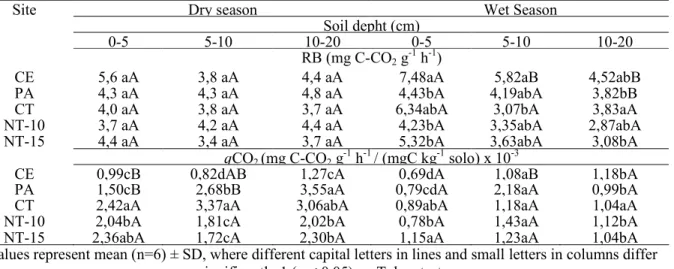
Table 4 Basal respiration (RB) and metabolic index (qCO2) the 0-5, 5-10 and 10-20 cm upper soil layers for
different types of land use and season in the Brazilian Savanna (Rio Verde, Goias State)
Site Dry season Wet Season
Soil depht (cm)
0-5 5-10 10-20 0-5 5-10 10-20
RB (mg C-CO2 g -1
h-1)
CE 5,6 aA 3,8 aA 4,4 aA 7,48aA 5,82aB 4,52abB
PA 4,3 aA 4,3 aA 4,8 aA 4,43bA 4,19abA 3,82bB
CT 4,0 aA 3,8 aA 3,7 aA 6,34abA 3,07bA 3,83aA
NT-10 3,7 aA 4,2 aA 4,4 aA 4,23bA 3,35abA 2,87abA
NT-15 4,4 aA 3,4 aA 3,7 aA 5,32bA 3,63abA 3,08bA
qCO2 (mg C-CO2 g -1
h-1 / (mgC kg-1 solo) x 10-3
CE 0,99cB 0,82dAB 1,27cA 0,69dA 1,08aB 1,18bA
PA 1,50cB 2,68bB 3,55aA 0,79cdA 2,18aA 0,99bA
CT 2,42aA 3,37aA 3,06abA 0,89abA 1,18aA 1,04aA
NT-10 2,04bA 1,81cA 2,02bA 0,78bA 1,43aA 1,12bA
NT-15 2,36abA 1,72cA 2,30bA 1,15aA 1,23aA 1,04bA
Values represent mean (n=6) ± SD, where different capital letters in lines and small letters in columns differ significantly 1 (p < 0.05) on Tukey test.
Although, the association of basal respiration and C microbial biomass gives the metabolic quotient index what means the biomass efficiency in
utilizing available C to biosynthesis. This index can be used as indicator to estimating biological activity and substrate quality (Saviozzi et al., 2001). Thus,
Revista Agrarian
ISSN: 1984-2538Costa Junior et al. (2011)- Dourados, v.4, n.14, p.303-312, 2011 310 higher qCO2 values are found in stressed
environmental situations, with which the SMB uses more C to maintaining themselves (Anderson & Domsch, 1993).
According Gama- Rodrigues (2005) as much as efficient the SMB becomes, less C are lost as CO2
by respiration and a considerate fraction are incorporated by microbial biomass, releasing higher Cmic levels in the soil. It can explain lower qCO2 levels at CE and PA (both seasons), being more stable than the others management systems, that there were no differences among them (Table 4).
These results agreed with D’andréa et al. (2002) that did not observe differences among Cerrado, pasture, NT and CT areas as well. The researchers reported the recent areas implantation as responsible and stuck out we should considerate that only 15-30 % of the SMB are active and what left are inactive, what bring about difficulties to interpretation of the qCO2 results. Thus, the Cmic:C and Nmic:N relations, basal respiration and qCO2
were not proper index and the Cmic and Nmic levels were more suitable to verify differences among the management systems.
While the results observed under CT pointed out lower values in both SOM compartments analysed (C and N total and microbial), the differences observed between PA and NT areas suggested hard interpretation that can occurs when these parameters are used, because is always not necessarily observed same tendencies. The lower C and N total and higher C and N microbial levels in PA found suggests higher microbial sensitivity to roots effect by grass cultivation and possibility tendency for C accumulate afterwards area reform. While under NT, the microbial biomass possible have already reached stabilization due higher C and N total levels found.
Conclusion
Rainy season showed 100 % higher Cmic and Nmic level than dry season. Rainy season and the 0-5 cm layer shoed the most differences among the studied areas. All the agriculture systems reduced the Cmic and Nmic compared to the native area, while PA showed higher levels than NT and CT.
No-till adoption in at least 10 years showed higher Cmic and Nmic levels compared to CT. Higher C and N microbial sensitivity was verified than total C and N, while other biological parameters (Cmic:C, Nmic:N, basal respiration, and qCO2) did not show
differences.
Acknowledgements
The Fundação Agrisus (164-04), FAPESP (2004/15538-7 and 06/52201-6), the Fonds Français pour l'Environement Mondial (FFEM), the France Foreign Relation (SCAC-MAE), and CAPES-COFECUB for work financial. To the Alvorada's Farm owner and employers.
References
ANDERSON, T.H.; DOMSCH, K.H. Application of ecophysiological quotients (qCO2 and qD) on
microbial biomass from soils of different cropping histories. Soil Biology Biochemistry, v.22, p.251-255, 1990.
ANDERSON, T. H.; DOMSH, K.H. The metabolic quocient (qCO2) as a specific activity parameter to assess the effects of environment conditions, such as pH, on the microbial biomass of forest soils. Soil Biology Biochemistry, v.25, p.393-395, 1993. ARAÚJO, A.S.F.; MONTEIRO, R.T.R. 2007. Indicadores biológicos de qualidade do solo. Bioscience Journal, v.23, p.66-75.
BAYER, C.; MARTIN-NETO, L.; MIELNICZUC, J.; PAVINATO, A.; DIECKOW, J. Carbon sequestration in two Brazilian Cerrado soils under no-till. Soil Tillage Research, v.86, p.237-245, 2006.
CARPENTER-BOGGS, L.; STAHL, P.D.; LINDSTROM, M.J.; SCHUMACHER, T.E. Soil microbial properties under permanent grass, conventional tillage, and no-till management in South Dakota. Soil Tillage Research, v.71, p.15–23, 2003.
CATTELAN, A.J.; VIDOR, C. Flutuação na biomassa, atividade e população microbiana do solo, em função de variações ambientais. Revista Brasileira de Ciência do Solo, v.14, p.133-142, 1990.
CONTE, E.; ANGHINONI, I.; RHEINHEIMER, D.S. Fósforo da biomassa microbiana e atividade de fosfatase ácida após aplicação de fosfato em solo no sistema plantio direto. Revista Brasileira de Ciência do Solo, v.26, p.925-930, 2002.
COSTA, E.A.; GOEDERT, W.J.; SOUZA, D.M.G. Qualidade do solo submetido a sistemas de cultivo
Revista Agrarian
ISSN: 1984-2538Costa Junior et al. (2011)- Dourados, v.4, n.14, p.303-312, 2011 311 com preparo convencional e plantio direto. Pesquisa
Agropecuaria Brasileira, Brasília, v.41, p.1185- 1191, 2006.
D’ANDRÉA, A.F. Atributos indicadores da qualidade do solo em sistemas de manejo no sul de Goiás. 2001. 106p. Dissertação (Mestrado) – Universidade Federal de Lavras, Lavras, 2001. D'ANDRÉA, A.F.; SILVA, M.L.N.; CURI, N.; SIQUEIRA, J.O.; CARNEIRO, M.A.C. Atributos biológicos indicadores da qualidade do solo em sistemas de manejo na região do cerrado no sul do estado de Goiás. Revista Brasileira de Ciência do Solo, v.26, p.913-923, 2002.
EMBRAPA. Sistema Brasileiro de Classificação de Solos. 2 ed. Rio de Janeiro: EMBRAPA, 2006. 306p.
ESPINDOLA, J. A. A. Avaliação de leguminosas herbáceas perenes usadas como cobertura viva de solo e seus efeitos sobre a produção da bananeira (Musa spp.). 2001. 144 f. Tese (Doutorado em Agronomia - Ciência do Solo) - Universidade Federal Rural do Rio de Janeiro, Seropédica, 2001. GAMA-RODRIGUES, E.F.; BARROS, N.F.; GAMA-RODRIGUES, A.C. Nitrogênio, carbono e atividade da biomassa microbiana do solo em plantações de eucalipto. Revista Brasileira de Ciência do Solo, v.29, p.893-901, 2005.
GARCIA, M.R.L.; NAHAS, E. Biomassa e atividade microbiana de solo pastejado por diferentes lotações de ovinos. Revista Brasileira de Ciencia do Solo, v. 31, p. 269-276, 2007.
GREGORICH, E.G., CARTER, M.R., ANGERS, D.A., MONREAL, C.M., ELLERT, B.H. Towards a minimum data set to assess soil organic matter quality in agricultural soils. Canadian Journal Soil Science, v. 74, p.367-385, 1994.
HURLBERT, S.H. Pseudoreplication and the design of ecological field experiments. Ecology Monographs, v.54, p.187-211, 1984.
JOERGENSEN, P.G.; BROOKES, P.C. Ninhydrin-reactive nitrogen measurements of microbial biomass in 0,5 M K2SO4 soil extracts. Soil Biology
and Biochemistry, v.22, p.1023-1027, 1990.
MALAVOLTA, E. Fertilidade dos solos da Amazônia. In: VIEIRA, L.S.; SANTOS, P.C.T.C. (Ed.). Amazônia: seus solos e outros recursos naturais. São Paulo: Agronômica Ceres, 1987. p.374-416.
MATSUOKA, M.; MENDES, I.C.; LOUREIRO, M.F. Biomassa microbiana e atividade enzimática em solos sob vegetação nativa e sistemas agrícolas anuais e perenes na região de Primavera do Leste (MT). Revista Brasileira de Ciência do Solo, v.27, p.425-433, 2003.
METAY, A.; MOREIRA, J. A. A.; BERNOUX, M.; BOYER, T.; DOUZET, J. M.; FEIGL, B.; FELLER, C.; MARAUX, F.; OLIVER, F.; SCOPEL, E. Storage and forms of organic carbon in a no-till under cover crops system on clayey oxisol in dryland rice production (Cerrados, Brazil). Soil Tillage Research, v.94, p.122-132, 2007.
PEREZ, K.S.S.; RAMOS, M.L.G.; McMANUS, C. Nitrogênio da biomassa microbiana em solo cultivado com soja, sob diferentes sistemas de manejo, nos Cerrados. Pesquisa Agropecuaria Brasileira, v.40, p.137-144, 2005.
RODELLA, A.A.; SABOYA, L.V. Calibration for conductimetric determination of carbon dioxide. Soil Biology and Biochemistry, v.31, p.2059-2060, 1999.
ROSCOE, R.; VASCONCELLOS, C. A.; FURTINI NETO, A. E.; GUEDES, G. A. A.; FERNANDES, L. A. Urease activity and its relation to soil organic matter, microbial biomass nitrogen and urea-nitrogen assimilation by maize in a Brazilian Oxisol under no-tillage and tillage systems. Biology and Fertility of Soils, v.32, p.52-59, 2000.
SALTON, J. C.; MIELNICZUK, J.; BAYER, C.; BOENI, M.; CONCEICAO, P. C.; FABRICIO, A. C.; MACEDO, M. C. M.; BROCH, D. L. Agregação e estabilidade de agregados do solo em sistemas agropecuários em Mato Grosso do Sul. Revista Brasileira de Ciencia do Solo, v.32, p.11-21, 2008. SAVIOZZI, A.; LEVI-MINZI, R.; CARDELLI, R.; RIFFALDI, R. A comparison of soil quality in adjacent cultivated, forest and native grassland soils. Plant and Soil, v.233, p.251-259, 2001.
Revista Agrarian
ISSN: 1984-2538Costa Junior et al. (2011)- Dourados, v.4, n.14, p.303-312, 2011 312 SIQUEIRA NETO, M.; SCOPEL, E.; CORBEELS,
M.; CARDOSO, A.N.; DOUZET, J.; FELLER, C.; PICCOLO, M.C.; CERRI, C.C.; BERNOUX, M. Soil carbon stocks under no-tillage mulch-based cropping systems in the Brazilian Cerrado: An on-farm synchronic assessment. Soil Tillage Research, v.110, p.187-195, 2010.
SILVA, F.A.S.E.; AZEVEDO, C.A.V. A New Version of The Assistat-Statistical Assistance Software. In: WORLD CONGRESS ON COMPUTERS IN AGRICULTURE, 4, Orlando-FL-USA: Anais... Orlando: American Society of Agricultural Engineers, 2006. p.393-396.
SILVA, J.E.; LEMANSKI, J.; RESCK, D.V.S. Perdas de matéria orgânica e suas relações com a capacidade de troca catiônica em solos da região de cerrados do oeste baiano. Revista Brasileira de Ciência do Solo, v.18, p.541-547, 1994.
SILVA FILHO, G.N.; VIDOR, C. As práticas de manejo de solo na população microbiana. Revista Brasileira de Ciência do Solo, Campinas, v. 8, p.291-296, 1984.
SINGH, J.S.; RAGHUBANSHI, A.S.; SINGH, R.S.; SRIVASTAVA, S.C. Microbial biomass act as a source of plant nutrients in dry tropical Forest and savanna. Nature, v.338, p. 499-500, 1989.
SPARLING, G.P. Ratio of microbial biomass carbon to soil organic carbon as a sensitive indicator of changes in soil organic matter. Australian Journal and Soil Research, v.30, p.195-207,1992.
SPARLING, G.P. & WEST, A.W. A direct extraction method to estimate soil microbial C:Calibration in situ using microbial respiration and
14
C labelled cells. Soil Biology and Biochemistry, v.20, p.337-343, 1988.
VANCE, E.D.; BROOKES, P.C.; JENKINSON, D.S. An extraction method for measuring soil microbial biomass. Soil Biology and Biochemistry , v.19, p.703-707, 1987.
VARGAS, L. K.; SELBACH, P. A.; SÁ, E. L. S. Imobilização de nitrogênio em solo cultivado com milho em sucessão à aveia preta nos sistemas plantio direto e convencional. Ciência Rural, v.35, p.76-83, 2005.
VENZKE FILHO, S.P., FEIGL, B.J., PICCOLO, M.C., FANTE JR, L., SIQUEIRA NETO, M., CERRI, C.C. Root systems and soil microbial biomass under no-tillage system. Environmental, Science and Agriculture. v.61, p.529-537, 2004.