ISSN: 2146-4553 www.econjournals.com
148
Oil-Growth Nexus in Oil Producing Countries: Macro Panel Evidence
*José Alberto Fuinhas
NECE and University of Beira Interior, Management and Economics Department, Estrada do Sineiro, 6200-209 Covilhã, Portugal.
Email: [email protected] António Cardoso Marques NECE and University of Beira Interior, Management and Economics Department, Estrada do Sineiro, 6200-209 Covilhã, Portugal.
Email: [email protected] Alcino Pinto Couto
NECE and University of Beira Interior, Management and Economics Department, Estrada do Sineiro, 6200-209 Covilhã, Portugal.
Email: [email protected]
ABSTRACT: The oil consumption-economic growth nexus is examined in a panel of oil producing countries over a long time span (1965-2012). Both, the ratio of oil production to primary energy consumption, i.e. oil self-sufficiency, and the persistence of the second structural oil shock were controlled for. The phenomenon of cross-sectional dependence that is present in the panel confirms that these countries share common spatial patterns, unobserved common factors, or both. The cointegration/long memory relationships as well as the panel data estimators’ appropriateness are analysed and discussed. A dynamic Driscoll-Kraay estimator, with fixed effects, was shown to be adequate to cope with the phenomena of heteroskedasticity, contemporaneous correlation, first order autocorrelation and cross-sectional dependence present in the panel. The results are consistent with the growth hypothesis, i.e. that oil consumption proves be a driver of economic growth. The second structural oil break (1979), reveals the long-lasting positive effect exerted by oil consumption on growth. The ratio of oil production to primary energy consumption has exerted a positive impact on growth. Thus, policymakers should take into account the benefits of promoting oil self-sufficiency, by reinforcing the use of endogenous resources.
Keywords: Oil production; macro panels; oil-growth nexus; oil self-sufficiency JEL Classifications: C33; O50; Q43
1. Introduction
Oil has played and will continue to play a central role in the development of energy systems. National energy systems and the global energy order are under pressure and facing transitional challenges. The pressures stemming from technological innovations, evolution of the energy demand and energy-related challenges policies are exerting a profound influence on the mix of national energy systems. The dynamics of global oil trade flows reflects structural changes in the geography of oil supply and demand. Major importers are becoming exporters. In turn, economies known as the most important energy exporters are becoming leading drivers of growth in global demand (IEA, 2013).
Within this scenario, literature on oil production and oil and energy consumption, as well as the attention of analysts and policy makers has become increasingly interested in the nature of their links
*
Research supported by: NECE, R&D unit funded by the FCT – Portuguese Foundation for the Development of Science and Technology, Ministry of Education and Science
149 with economic performance, in particular with economic growth. The largest body of research has been framed in the context of energy-growth nexus literature (e.g. Ozturk, 2010). The increasing focus on oil producing economies could be explained by the potential insights they provide for a better understanding of: (i) the economic growth drivers, controlling for the peculiarities and specificities of of the links between oil production, oil consumption and primary energy consumption among countries; (ii) the nature of the nexus, namely whether or not it could be conditioned by the exploitation of energy resources; and (iii) the complexities and idiosyncrasies of oil production on economic growth. The research findings are inconclusive regarding the existence and the direction of energy-growth nexus causality (e.g. Apergis and Payne, 2009; Naser, 2014; and Yıldırım et al., 2014).
Furthermore, one could attribute, at least in part, the lack of conclusive research outcomes to three facts. First, the literature on oil production is focused mostly on exporting countries. Thus, the studies concentrate on the effects of surplus oil production on oil consumption, neglecting the role of oil production itself in economic growth. Indeed, there are numerous countries that are oil producers but not oil exporters. Second, the literature has neglected the study of the impact of oil production on paths of economic growth for different levels of oil production. Lastly, the studies fail to detect the effects of interaction between energy production and energy consumption.
To overcome such shortcomings and capture the heterogeneity of the oil producing countries, the ratio of oil production to the energy consumption is used, measuring oil production units per unit of energy consumed. This indicator expresses the relevance of the interaction between oil production and total primary energy consumption in different countries. It also represents the differences regarding energy policy priorities between oil-rich and non-oil-rich countries, namely the importance given to energy self-sufficiency. Moreover, the indicator enables the analysis of oil producing countries, both exporting and non-exporting, and captures their dynamics over time.
The aim of this work is to improve the understanding of the energy-economic growth nexus, using the ratio of oil production to energy consumption. To pursue this aim, a multivariate panel approach is applied and empirically supported by: (i) a set of oil producing countries for which data on oil production and primary energy consumption is available over a long time span (1965 to 2012); (ii) control of the ratio of oil production to primary energy consumption; and (iii) control of the aftermath of the second oil shock of 1979. The econometric techniques used: (a) enable the assessment of short and long-run effects, shedding light on the dynamics of the relationship; (b) overcome the delicate problem of the order of integration of variables by using an econometric specification that can work upon variables that are I(0) and/or I(1) or fractionally integrated; and (c) can operate on more extensive relationships ranging from cointegration to long-memory (fractional cointegration).
The study is set out as follows. The next section provides a review of the literature on the energy-growth nexus, particularly highlighting the context of oil producing countries. Section three presents both data and methodology. In this section, a preliminary analysis of data is also provided. Section four discloses the results. Section five centres on the discussion of the main results. Section six presents the conclusions.
2. Literature Review
The study of the energy consumption and economic growth nexus has been a longstanding theme, both in the energy economics literature and in the energy policy debate. Despite the large number of studies, involving different authors, countries, time periods, and econometric methodologies, the complex nature of the causality relationship deserves further research. Currently, there is no clear support regarding the direction, or even the existence of a causality in the energy-growth nexus (e.g. Yıldırım et al., 2014; Ozturk, 2010; and Apergis and Payne, 2009).
According to the energy-growth nexus literature, four testable hypotheses are postulated: conservation, growth, feedback and neutrality hypotheses (e.g. Ozturk, 2010; Yuan et al., 2010; Apergis and Payne, 2009; Zhang and Cheng, 2009; Wolde-Rufael, 2009; and Narayan and Smith, 2008). The neutrality hypothesis maintains that the variables are independent from one another and the cost of the energy is a small proportion of the Gross Domestic Product (GDP). In this case, the economy is anchored to less energy intensive activities and energy policy has no significant implications for economic growth and vice-versa. This is unlike the other hypotheses in which the existence and direction of causality pose crucial energy policy implications. Both the conservation and growth hypotheses imply a unidirectional causality. The conservation hypothesis implies causality
150 from economic growth to energy consumption. This assumption considers that economic growth stimulates energy consumption, assuming, as in the neutrality hypothesis, that energy conservation or reduction policies do not inhibit economic growth. The growth hypothesis considers energy consumption as an input production factor, and claims that energy use is a driver of economic growth. In this framework, the economy is energy dependent and efficiency-oriented, energy restrictive policies, such as regulation and fiscal measures, will harm economic growth. Lastly, the feedback hypothesis advocates a bi-directional causality between economic growth and energy consumption. The two variables are interrelated, working complementarily to each other. Consequently, efficiency-oriented energy policies should take into account their adverse effects on economic growth.
The unclear picture revealed by the research on the topic is explained, to a large extent, by the sensitivity of findings to specific features of the country and research. The results seems to depend mainly on: (i) whether the study involves just one single country or a set of countries (Fuinhas and Marques, 2013); (ii) the econometric methodologies used (Alam et al., 2012; and Mehrara, 2007); (iii) the time span considered (Chen et al., 2012); (iv) the variables studied (Ozturk, 2010); (v) the heterogeneity of the countries’ climate conditions (Belke et al., 2011); (vi) the different energy consumption standards (Mahadevan and Asafu-Adjaye, 2007); and (vii) the countries’ structural and development level (Ozturk et al., 2010; Apergis and Payne, 2010, 2009; and Mahadevan and Asafu-Adjaye, 2007).
In an attempt to shed light on the complexity of the energy-growth nexus, the analysts have increasingly been focusing on dissecting the long-run effect and short-run dynamics between energy consumption and economic growth, particularly within oil producing countries. Different reasons could be given to explain this interest: (i) the great value of oil as a scarce and strategic commodity, as well as its uneven distribution around the world (e.g. IEA, 2013; and Luft and Korin, 2009); (ii) the economic, political and social effects of oil earnings and energy prices (e.g. Narayan et al., 2014; Darbouche, 2013; and ECB, 2010); (iii) its role as an instrument of public policy pursuing multiple objectives (e.g. Mohammadi and Parvaresh, 2014; and Fattouh and El-Katiri, 2013); (iv) the set of oil producing countries consisting of small and large producers by international standards, oil net importers and net exporters, developed and developing countries (e.g. IEA, 2013; Ozturk, et al., 2010, Klein, 2010; and Luft and Korin, 2009); (v) various national energy systems face different transitional problems, in particular net exporters experience rapidly increasing energy demand and growing political, economic and environmental challenges (e.g. Mohammadi and Parvaresh, 2014; Gately et al., 2013; Al Jaber, 2013; Fattouh and El-Katiri, 2013; El-Katiri, 2013; and Al-Mulali, 2011); and (vi) different economies have different levels of oil endowments and oil self-sufficiency and dependency, but share relevant market and price interdependencies (e.g. IEA, 2013; ECB, 2010; and Luft and Korin, 2009).
Such reasons are associated with a wide range of energy developments that express either short-run or long-short-run implications. For example, changes in international energy prices could express a short-run phenomenon (e.g. the Persian Gulf War, 1990-1991) or a long-run change in the terms of trade driven by structurally rising demand (ECB, 2010). Thus, the energy-growth nexus analysis requires sufficiently long time spans to properly examine the causality relationships by understanding the effects of both short and long-run movements on energy systems. The more recent generation of econometric approaches, such as multivariate cointegration and error correction panel models, are required to test structural changes and breaks in the pattern of energy consumption, owing to changes in energy prices, political, economic and technological environments and energy policies, among others, and their implications on the energy-growth nexus (e.g. Fuinhas and Marques, 2013; and Mehrara, 2007).
Moreover, the literature recognizes that the energy transition systems of oil producing countries face a common and critical challenge to economic growth: the balance between oil production, domestic energy consumption and a sustainable external position regarding oil (e.g. Mohammadi and Parvaresh, 2014; Yousef, 2013; Mehrara, 2008; and Kraft and Kraft, 1978). This balance poses some questions. To what extent could this common challenge reinforce the role of common shocks? Could we expect some degree of convergence between national energy systems and policies? If so, could one expect clearer and more conclusive findings regarding the energy consumption-growth causality nexus?
151 The earliest attempt to answer to some of these questions is found in the work of Kraft and Kraft (1978) on the US economy: a developed economy and both a relevant oil producer and net energy importer. The authors examined the energy consumption-growth nexus and identified a growth-energy causality relationship. They considered that conservation policies were critical in order to face energy-related challenges. Since then, a large body of literature has been produced predominantly focused on energy dependent economies (e.g. Ozturk, 2010; Apergis and Payne, 2009). More recently, increasing attention has being placed on energy supplier economies, in particular oil producers (e.g. Mohammadi and Parvaresh, 2014; Gately et al., 2013; Al Jaber, 2013; Fattouh and El-Katiri, 2013; and Sgouridis et al., 2013).
With respect to oil producing countries, the findings of recent cross-country studies point to a mixed picture. Mohammadi and Parvaresh (2014), in a study based on a sample of 14 oil-exporting countries and a mean group estimator with common correlated effects, identify a stable relation between energy consumption and output, as well as a bi-directional causality in both the long- and short-run. By examining Sub-Saharan African oil importing and oil exporting countries between 1985 and 2011, Behmiri and Manso (2013) show a bi-directional relationship between oil consumption and GDP for oil importers in both the long- and short-run. However, oil exporters present bi-directional causality in the long-run and a Granger causality from oil consumption to GDP in the short-run. Covering the period from 1973 to 2008, Farhani and Rejeb (2012) examine MENA countries. Their findings suggest that short-run interactions show neutrality relationships between energy consumption and GDP and long-run dynamics are characterised by the conservation hypothesis, implying a causality from economic growth to energy consumption. This mixed picture is supported by the cross-country studies of Bildirici and Kayıkçı (2013), Hossein et al. (2012) and Al-Mulali (2011). The findings provided by country case studies reinforce this unclear trend. Although they support the existence of causality, its direction in the energy-growth nexus is inconclusive (e.g. Lim et al., 2014; Park and Yoo, 2014; Dantama et al., 2012; Lotfalipour et al., 2010; Pao and Tsai, 2011; and Belloumi, 2009).
Overall, the results do not offer a better understanding of how the energy-growth nexus is affected in presence of energy resources. In our view, the current approaches are not specifically tailored to energy producing countries. As far as we are aware, they currently fail to capture the interaction effects between energy production and energy consumption. In other words, one expects that the nature of the nexus would be affected by the fact that a country is, or is not an oil producer, even if the oil production level is too small to export. As a consequence, a workable and theoretically consistent approach is to use the concept of self-sufficiency. Roughly understood, the concept establishes a relationship between energy production and energy consumption. In the case of oil producing countries, the forces that shape the degree of self-sufficiency are multidimensional and work differently between them. For example, the priority given to the maximization of energy-self-sufficiency and the conditions to achieve it, tend to be associated both with the level of the country’s oil endowment, and with the relationship between the full capacity of its oil sector and domestic demand for oil.
In turn, the analysis of self-sufficiency embraces the role of supply and demand mechanisms and their interactions. From the supply side, its movements express the presence of supply shocks, its propagation, and changes in technology and the energy mix. From the demand side, the concept captures changes in energy prices stimulated by external or domestic demand, sectorial structural changes, as well as changes in energy intensity. Accordingly, the use of a measurement that integrates oil production and energy consumption to examine the causality hypotheses between energy and economic growth, could shed some light on the complexities of the nexus.
3. Data and Methodology
The traditional analysis of the energy-growth nexus could be extended and approached either from the demand side or from the supply side. The analysis focused on supply usually includes variables such as labour, capital stock, energy consumption, and gross domestic production (GDP). The demand approach is generally based on energy consumption, energy prices, GDP, and occasionally includes other variables such as exports, CO2 per capita or urbanization (e.g.
Mohammadi and Parvaresh, 2014). The demand side approach is well suited to cope with the nexus of oil exporting countries (e.g. Damette and Seghir, 2013).
152 The ultimate purpose of this research is to examine the effect of the level of oil self-sufficiency on the oil-growth nexus of a group of countries that are oil producers. Accordingly, the nexus is assessed controlling for the ratio of oil production to primary energy consumption. Annual frequency data for the period 1965-2012 is used, and the econometric analysis was performed using EViews 8 and Stata 13.1 software. Notwithstanding the large number of oil producers countries around the world, the countries under analysis are those that were oil producers during the period under analysis, and for which data is available, for the entire period namely on primary energy consumption, oil consumption, oil production, and exports of goods and services. Therefore, our analysis focuses upon a balanced panel of fifteen countries, specifically: Australia, Algeria, Brazil, Canada, Colombia, Ecuador, Egypt, India, Indonesia, Italy, Mexico, Peru, United Kingdom, United States, and Venezuela. Three potential candidates were excluded: Trinidad and Tobago that had no data for exports in 2012, and Malaysia and Norway that only began to produce oil in 1968 and 1971, respectively. Two sources of raw annual data were used: the World Bank Data (for gross domestic product (GDP) exports of goods and services, and population), and the BP Statistical Review of World Energy, June 2013 (for oil consumption, oil production, primary energy consumption, and crude oil prices). The raw data variables used are: (i) GDP (constant local currency unit); (ii) exports of goods and services (% of GDP); (iii) population (total number of persons); (iv) oil consumption (million tonnes); (v) oil production (million tonnes); (vi) primary energy consumption (million tonnes oil equivalent); and (vii) crude oil prices (US dollars per barrel, 2012). With the option of using constant local currency unit, the influence of exchange rates is avoided. These raw variables were transformed and used in the study as follows:
Gross Domestic Product per capita (YPC) – the YPC is obtained by dividing the GDP by the total population;
Exports of goods and services per capita (XPC) – the XPC is computed in three steps. The first step consists of dividing exports of goods and services, as a percentage, by 100. In the second step, the former result is multiplied by the GDP in order to obtain its absolute value. Finally, the absolute value is then divided by total population to obtain per capita values;
Oil consumption per capita (OCPC) – the OCPC is obtained by dividing oil consumption by total population;
Ratio of oil production to primary energy consumption (SE) – the SE is obtained by dividing oil production by primary energy consumption. This ratio captures the evolution of the balance of oil production to primary energy consumption. It is used to control for the heterogeneity of oil producers both through time and as net oil producers;
Crude oil prices (P) - the P is the “international” price. This variable is unique, and therefore is the same for all countries.
It is expected that these variables will contain dynamic effects. Indeed, for the group of oil producing countries it is different behaviours are expected in the short and long-run. Actually, there are two principle motives that suggest this dynamics. First, the period under study is long which increases the relevance of time. Second, for oil exporting countries, the presence of long-run relationships are expected, as they tend to exhibit fairly constant oil income/ GDP ratios over time (e.g. Esfahani et al., 2014, 2013). The expected presence of dynamic effects strongly supports the argument that the analysis should be conducted by econometric techniques that analyse both short and long-run adjustments. To permit the breakdown of the total effect of dynamic interactions into short and long-run components, use is made of the equivalent conditional unrestricted error correction model (UECM) form of an autoregressive distributed lag (ARDL) model. The UECM form of the ARDL model is robust, independently of variables being I(0), I(1), or fractionally integrated, and deals well with both cointegration and long memory behaviours. In addition, it has attractive properties, namely those of consistent and efficient parameter estimates, and inference of parameters grounded on standard tests. Furthermore, it has the flexibility to explore the possible functional forms of the nexus, as the literature on the subject has amply shown. Given that the specification of the UECM form of an ARDL model includes variables that are in natural logarithms, first differences of logarithms, and a ratio, their coefficients are elasticities, semi-elasticities, and impacts, respectively. Thereafter, the prefixes “L” and “D” denote natural logarithm and first differences of variables, respectively. The ARDL model specification, Eq. (1), is:
153 b j ij it j a j ij it j t i i
it TREND LYPC LOCPC
LYPC 0 12 1 11 1 1 e it j ij it j d j ij it j c j ij it j LP LXPC SE 1 0 15 0 14 0 13 (1)
Eq. (1) can be re-parameterized into the general UECM form, Eq. (2), in order to decompose the dynamic relationship of variables in the short and long-run, as follows:
b j it j a j it j t i i
it TREND ijDLYPC ijDLOCP
DLYPC 0 1 2 2 21 22 e j it j d j it j c j it j DLP ij DLXPC ij DSE ij 0 0 0 23 24 25
21iLYPC
it 1
22iLOCPC
it 1
23iSE
it 1
24iLXPC
it 1
25iLP
it 1
2it.
(2)where α2i denotes the intercept, δ2i, β2kij, k=1,…,5, and γ2im, m=1,…,5, the estimated parameters; and
ϵ2i the error term.
The preliminary empirical assessment of the model of Eq. (2) reveals that exports of goods and services per capita, and crude oil prices are not statistically significant and were excluded from modelling. These results are far from unexpected given that some countries included in the panel are huge oil exporters and, consequently, their exports incorporate the effect of oil price. Similarly, when exports are considered, oil prices are shown to be statistically insignificant. This empirical result corroborates the redundancy of including variables of exports and oil prices concurrently. Furthermore, only contemporaneous effects are detected for the semi-elasticities. Thereafter, the previous model is replaced by the more parsimonious model of Eq. (3), as follows:
3 1 33 1 32 1 31 32 31 3 i i it i it i it i it i it it
it DLOCPC DSE LYPC LOCPC SE
DLYPC (3)
When working upon macro panels, the presence of cross-sectional dependence (CSD) is a common occurrence. Once found, this points to the presence of common unobserved factors that influence the evolution of countries’ variables over their own time paths. Furthermore, the idiosyncrasies of the countries can result in the existence of fixed effects. Indeed, it is expected that countries that are oil producers share specificities that require special attention to be taken in the choice of estimators, bearing in mind that they should be able to cope well with misspecifications, biased results, and inefficiencies in the estimates. To capture the features of both series and cross-sections (countries), the analysis of the descriptive statistics, the CSD, and the order of integration of the variables should be performed. Table 1 reveals both the descriptive statistics of the variables and their cross-sectional dependence, which is assessed by the CD test.
Table 1. Descriptive statistics and CSD
Descriptive statistics Cross-Section Dependence
Variables Obs Mean Std.Dev. Min. Max. CD-test Corr Abs (Corr)
LYPC 720 10.1343 2.3741 6.9501 16.1769 47.93*** 0.675 0.807 LOCPC 720 -14.3563 1.1478 -17.4890 -12.4197 12.47*** 0.176 0.481 SE 720 1.3086 2.1579 0.0004 16.5079 -1.94* -0.027 0.432 DLYPC 705 0.0199 0.0347 -0.1553 0.2153 8.74*** 0.124 0.192 DLOCPC 705 0.0140 0.0593 -0.3281 0.2455 9.04*** 0.129 0.187 DSE 705 -0.0327 0.3945 -4.4162 4.5644 1.16 0.017 0.162
Notes: CD test has N(0,1) distribution, under the H0: cross-section independence. ***, * denote significant at 1% and 10% level, respectively. The Stata command xtcd was used to achieve the results for CSD.
The descriptive statistics clearly indicate that the panel of countries is very diverse. Indeed, the ratio of oil production to primary energy consumption, economic growth and oil consumption growth have huge disparities. The CD test strongly suggests that countries share common developments for all variables except for the ratio of oil production to primary energy consumption, either as a ratio or first differences of the ratio. The presence of CSD indicates an interdependence among the cross-sections that results from countries sharing common shocks (e.g. Eberhardt, 2011). Two types of dependence
154 between cross-sections can be recognised in the literature. The first, is spatial and takes into account the distance between cross-sections (Anselin, 2001). The second, which is called long-range or global interdependence (Moscone and Tosetti, 2010), occurs when the cross-sections react in the same manner to external shocks. Irrespective of the geographical distance between countries, if they react in a very similar manner to the same events, then this provokes correlation between them. The absence of CSD for the SE (statistically significant only at 10%) and DSE, suggest that countries react independently with regard to oil production and energy consumption.
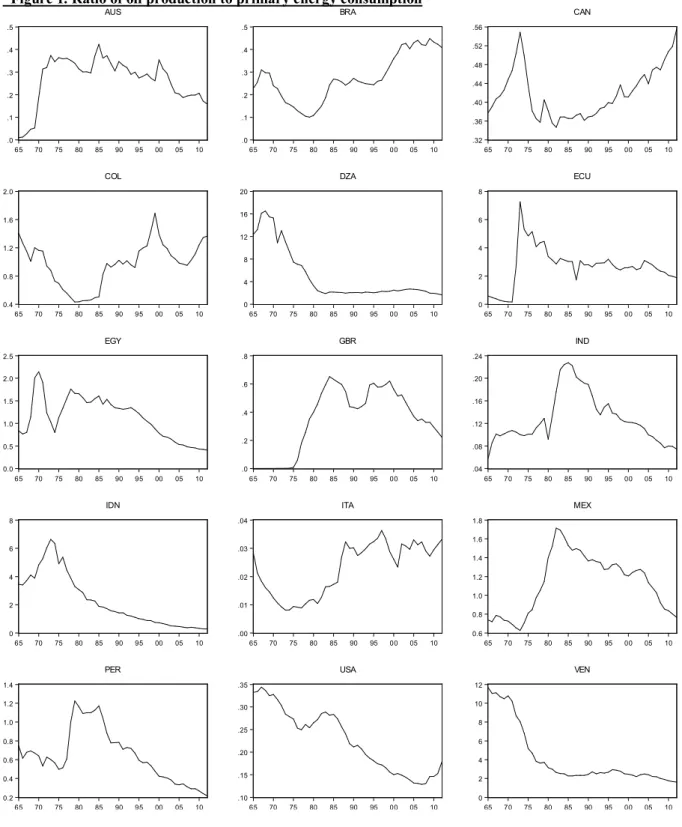
Figure 1 shows the SE charts by cross sections. As shown by Figure 1, the SE series are far from stable over time for the most of countries, reinforcing the necessity to study how this impacts on economic growth in different periods.
Figure 1. Ratio of oil production to primary energy consumption
.0 .1 .2 .3 .4 .5 65 70 75 80 85 90 95 00 05 10 AUS .0 .1 .2 .3 .4 .5 65 70 75 80 85 90 95 00 05 10 BRA .32 .36 .40 .44 .48 .52 .56 65 70 75 80 85 90 95 00 05 10 CAN 0.4 0.8 1.2 1.6 2.0 65 70 75 80 85 90 95 00 05 10 COL 0 4 8 12 16 20 65 70 75 80 85 90 95 00 05 10 DZA 0 2 4 6 8 65 70 75 80 85 90 95 00 05 10 ECU 0.0 0.5 1.0 1.5 2.0 2.5 65 70 75 80 85 90 95 00 05 10 EGY .0 .2 .4 .6 .8 65 70 75 80 85 90 95 00 05 10 GBR .04 .08 .12 .16 .20 .24 65 70 75 80 85 90 95 00 05 10 IND 0 2 4 6 8 65 70 75 80 85 90 95 00 05 10 IDN .00 .01 .02 .03 .04 65 70 75 80 85 90 95 00 05 10 ITA 0.6 0.8 1.0 1.2 1.4 1.6 1.8 65 70 75 80 85 90 95 00 05 10 MEX 0.2 0.4 0.6 0.8 1.0 1.2 1.4 65 70 75 80 85 90 95 00 05 10 PER .10 .15 .20 .25 .30 .35 65 70 75 80 85 90 95 00 05 10 USA 0 2 4 6 8 10 12 65 70 75 80 85 90 95 00 05 10 VEN
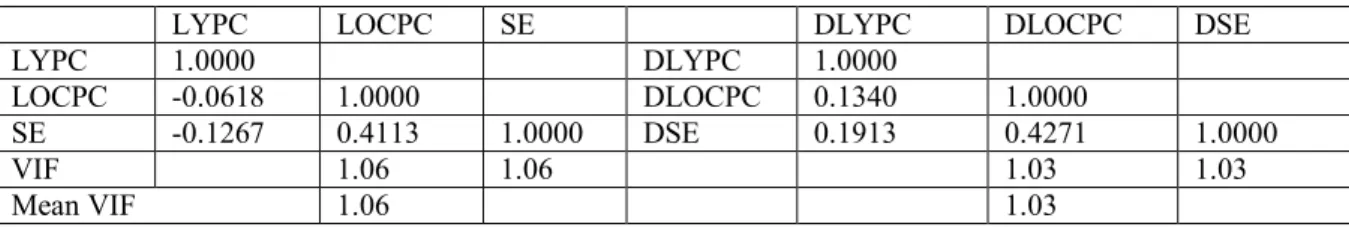
155 The correlation coefficients between variables, and the variance inflation factor (VIF) were computed to check for multicollinearity. The very low values of correlations and VIF statistics strongly support the absence of multicollinearity (see Table 2).
Table 2. Matrices of correlations and VIF statistics
LYPC LOCPC SE DLYPC DLOCPC DSE
LYPC 1.0000 DLYPC 1.0000
LOCPC -0.0618 1.0000 DLOCPC 0.1340 1.0000
SE -0.1267 0.4113 1.0000 DSE 0.1913 0.4271 1.0000
VIF 1.06 1.06 1.03 1.03
Mean VIF 1.06 1.03
To assess the order of integration of the variables, both first and second generation panel unit root tests were applied. The first generation panel unit roots tests of LLC (Levin, Lin and Chu, 2002), ADF-Fisher (Maddala and Wu, 1999) and ADF-Choi (Choi, 2001), and the second generation unit roots test CIPS (Pesaran, 2007) were provided. The CIPS test has the desired property of being robust to heterogeneity and tests the null of non-stationarity under a nonstandard distribution. The results of unit root tests are shown in Table 3.
Table 3. Unit root tests
1st generation 2nd generation
LLC ADF-Fisher ADF-Choi CIPS (Zt-bar)
Individual intercept and trend no trend with trend
LYPC -0.0810 22.1250 1.1354 1.326 1.374 LOCPC -0.8452 32.1307 -0.2136 -3.571*** -1.614* SE -0.4976 29.3768 0.7119 1.158 0.180 DLYPC -11.6123*** 169.615*** -9.8432*** -8.243*** -8.189*** DLOCPC -8.5762*** 144.002*** -8.5307*** -9.095*** -7.800*** DSE -8.3198*** 134.634*** -8.3829*** -6.886*** -5.968***
Notes: ***, **, * denote significant at 1%, 5% and 10% level, respectively; the null hypotheses are as follows. LLC: unit root (common unit root process); this unit root test controls for individual effects, individual linear trends, it has a lag length 1, and Newey-West automatic bandwidth selection and Bartlett kernel; ADF-Fisher and ADF-Choi: unit root (individual unit root process); this unit root test controls for individual effects, individual linear trends, it has a lag length 1; first generation tests follow the option “individual intercept and trend”, which was decided after a visual inspection of the series; Pesaran (2007) Panel Unit Root test (CIPS): series are I(1); the EViews was used to compute LLC, ADF-Fisher, and ADF-Choi; and the Stata command multipurt was used to compute CIPS.
The LLC and the ADF tests are consensual in attributing levels to I(1) variables. The CIPS test is much more inconclusive in regard to the LOCPC variable. Nevertheless, the CIPS test for LOCPC variable with three lags and no constant (not shown) is statistically significant only at 10% level. With trend and two lags it is not statistically significant. The variable SE with trend and two or more lags is statistically significant, suggesting that the inclusion of a trend could be necessary in the models.
The preliminary analysis of the data points to the second oil shock having a permanent effect on the elasticity oil-growth. To assess this long-lasting effect, a shift dummy is used, with “zeros” prior to the year 1979 and “ones” from 1979 onwards, which was multiplied by the natural logarithm of oil consumption per capita. This former shift dummy variable is nominated SD79LCPC in the estimations, and captures the change in elasticity in the period after the second oil shock. To include this shift dummy, the last Eq. (3) was expanded, resulting in the following Eq. (4), which is hereafter the standard specification for models.
DLOCPC DSE DLYPCit 4i 41i it 42i it . 79 1 4 44 1 43 1 42 1 41
iLYPCit iLOCPCit iSEit iSD LOCPCit it
(4)
When working upon several countries, the availability of data over long periods allows a large number of observations, permitting the use of estimation methodologies of both macro panels and time series. The possibility of a panel having heterogeneous slopes must be appraised, as well as, testing for the adequacy of using panel data techniques. The decision to use a panel methodology or to use
156 procedures that permit the accommodation of great diversity is conditional on the units’ degree of heterogeneity.
Countries that are oil producers could share common events, which underline the adequacy of studying the countries jointly, by using a panel data approach. In addition, the panel data approach allows for the control of cross-sectional heterogeneity, which is expected to be present when several entities are analyzed (e.g. Klevmarken, 1989; and Hsiao, 2003). Furthermore, it provides more information, variability, degrees of freedom and efficiency and, thus, less collinearity than is generally present in time series approaches. The greater ability of panels to detect and measure phenomena, and the possibility of building more complex models than traditional econometric methodologies, is of particular relevance in empirical analysis. Moreover, the macro panel data structure, with a long time span, has the advantage of allowing for panel unit root tests that have a standard asymptotic distribution (Baltagi, 2008). This former characteristic is of particular interest when checking cointegration.
In the panel approach, the presence of individual effects ought to be tested against random effects. For the random effects (RE) model, in Eq. (4), the error term assumes the form itiit, where
denotes the N-1 country specific effects and are the independent and identically distributed error. Accordingly, Eq. (4) is transformed in Eq. (5):
DLOCPC DSE DLYPCit 5i 51i it 52i it . 79 1 54 1 53 1 52 1 51
iLYPCit iLOCPCit iSEit iSD LOCPCit i it
(5)
If the random model proves to be more appropriate than the fixed ones, then further testing, comparing the random effects with the pooled OLS regression should be pursued and determined. Accordingly, FE were tested against RE, by using a Hausman test, in which the null hypothesis is that the preferred model is that of random effects. Hausman’s statistic 2726.59proves be highly significant by supporting the rejection of H0, i.e., FE was chosen as the preferred model. The evidence
of correlation between the individual effects of countries and the explanatory variables, i.e., FE, supports the idea that the individual effects of countries are statistically significant and must be included in the panel estimations. Moreover, FE models are particularly suitable for analysing the impact of variables that vary over time, because the FE estimator removes all time-invariant features from the independent variables. This later feature allows for the appraisal of the net effect of explanatory variables.
The long time span and the number of cross sections under analysis makes it advisable to test the panel heterogeneity parameter slopes. Indeed, this could also be present in the macro panels. The heterogeneity of parameter slopes could be of two types: (i) present in short and long-run; and (ii) circumscribed to short-run. To cope with this, the Mean Group (MG) or Pooled Mean Group (PMG) estimators can be applied. The MG is the most flexible model. It runs the regressions for each individual and then it calculates an average coefficient of all individuals. Its estimates of the long-run average coefficients are consistent, but inefficient when there is slope homogeneity (Pesaran et al., 1999). This technique is not adequate for small samples of countries, since an outlier can significantly change the coefficient averages (Ciarlone, 2011). PMG also allows for greater flexibility than the traditional models when studying a panel, but is less flexible than MG. It performs restrictions among cross sections in the long-run parameters, by pooling them, but not in the short-run parameters, or in the adjustment speed. Thus, the short-run dynamics are allowed to be heterogeneous, while the long-run ones must be homogeneous. It can be based on an UECM form of the ARDL approach, allowing the correction of serial correlation among residuals and the problem of endogenous regressors, as long as an optimal number of lags is chosen. It is an intermediate method in which the short-run coefficients and the error variances can be different among countries, while implying homogeneity in the long-run. If long-run homogeneity is verified, PMG estimators are more consistent and efficient than MG. These estimators require a large number of both cross sections (N) and time observations (T) (Blackburne III and Frank, 2007). One way to appraise the appropriateness of using MG or PMG estimators is to test them against the dynamic FE estimator. The dynamic FE model is the least flexible. In fact, contrary to the previous models, it imposes homogeneity for all coefficients and only allows for the intercepts to be different among cross sections. The homogeneity is valid if the parameters have a common convergence. The decision to use one of these models instead of another is
157 made by computing a Hausman test, which tests the null hypothesis that the difference in coefficients is not systematic.
4. Results
The preliminary outcomes support the use of techniques that are robust for CSD and that address the dynamics of short and long-runs. The results of the order of integration of the variable LOCPC do not exclude the possibility that the variable is borderline I(0)/I(1), which compromises the testing of the cointegration between variables by the traditional tests. The most common test of cointegration between variables was carried out, although it is not clear if the order of integration of variables is I[1]. The first generation Pedroni test (1999, 2004) is commonly used to test cointegration. This test runs under the null of no-cointegration. However, this test considers both heterogeneity and independence among cross sections (e.g. Pedroni, 1999). The detection of CSD implies that the Pedroni test is not appropriate to test cointegration. Indeed, if not controlled for the presence of CSD, it could provoke both imprecise estimates and severe identification problems (e.g. Eberhardt and Presbitero, 2013). Thus, as an alternative, the first generation cointegration test of Kao (1999) was computed. This test states the no-cointegration as a null hypothesis and is specified on the assumption of coefficients’ homogeneity. The Kao test definitely does not reject the null (t=1.2403).
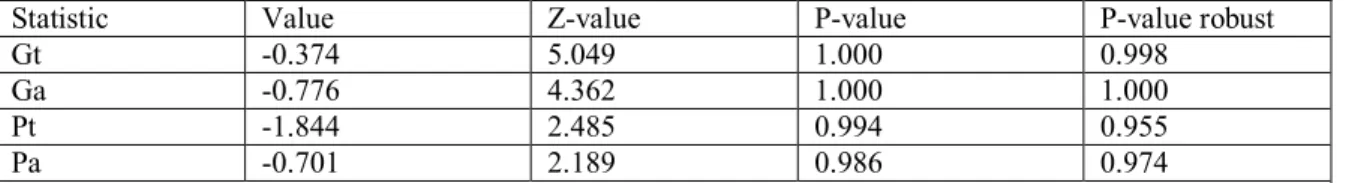
To double-check the results, the second generation cointegration test of Westerlund (2007) was calculated. This test deals with dynamic structures instead of residuals. It performs under the null hypothesis of no-cointegration and it is built on four statistical tests that are consistent and have normal distribution. Pt and Pa statistics test the cointegration of the model as a whole, and Gt and Ga statistics test the hypothesis of at least one cross section having all the variables cointegrated. These tests check whether the error correction term, in a conditional model, is zero and they are able to incorporate short-run dynamics for each country, as well as serial correlated error terms, non-strictly exogenous regressors, interceptions, tendencies and slope parameters for each country (Ciarlone, 2011). These specificities are therefore flexible and suitable for work upon a heterogeneous specification. Considering that these series exhibit CSD, only the Westerlund (2007) cointegration test results were shown (see Table 4). The bootstrap method provides proper coefficients, standard errors and confidence intervals, and discloses robust critical p-values. As is well known, good econometric practice recommends resampling to be performed at least 100 times to achieve robust results. For more accuracy, 800 repetitions were used. As shown in Table 4, the presence of cointegration is clearly rejected, both in considering the panel as a whole, and in considering each country individually. Table 4. Westerlund (2007) cointegration tests
Statistic Value Z-value P-value P-value robust
Gt -0.374 5.049 1.000 0.998
Ga -0.776 4.362 1.000 1.000
Pt -1.844 2.485 0.994 0.955
Pa -0.701 2.189 0.986 0.974
Notes: Bootstrapping regression with 800 reps; H0: no cointegration; Gt and Ga test the cointegration for each country individually, and Pt and Pa test the cointegration of the panel as whole; and the Stata command
xtwest was used.
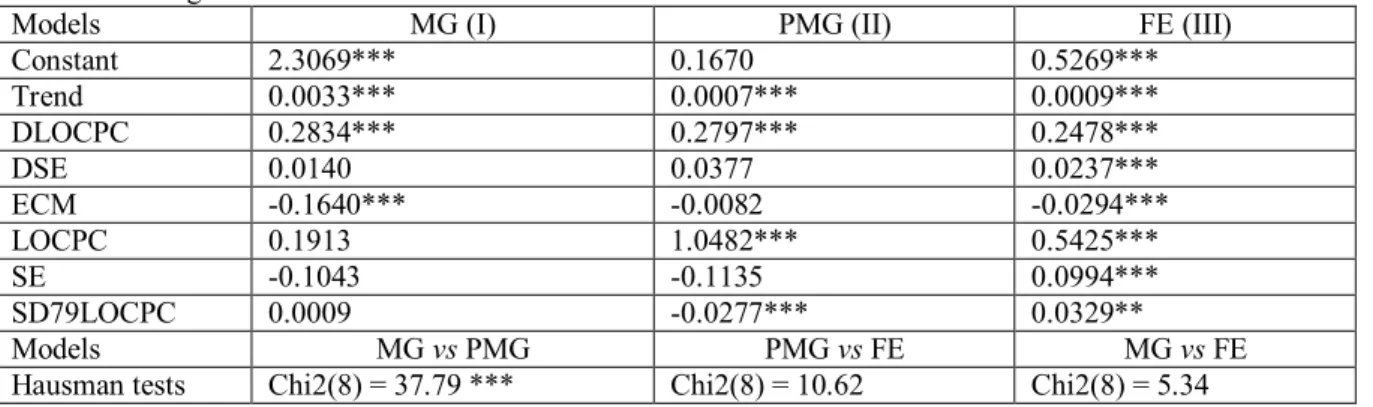
To ascertain the presence of heterogeneity and despite the moderate number of cross sections under analysis, the MG estimator was applied and their results carefully analyzed. The cross-sectional estimations, in general, show few statistically significant parameters. Overall, these poor results require an assessment of the eventual gains of efficiency by using PMG or dynamic FE. In accordance, the MG and PMG estimators were tested against the dynamic FE. Table 5 presents the estimations for each of these three models, as well as, the Hausman tests. The results lead to the rejection of the most flexible models, presenting FE as the most suitable estimator. The prevalence of a homogeneous panel indicates oil producers sharing common coefficients, and it can be suitable to treat them as a group as these results could be interpreted as evidence that producing countries shared similar behaviours to the extent that these variables are considered.
158 Table 5. Heterogeneous estimators and Hausman tests
Models MG (I) PMG (II) FE (III)
Constant 2.3069*** 0.1670 0.5269*** Trend 0.0033*** 0.0007*** 0.0009*** DLOCPC 0.2834*** 0.2797*** 0.2478*** DSE 0.0140 0.0377 0.0237*** ECM -0.1640*** -0.0082 -0.0294*** LOCPC 0.1913 1.0482*** 0.5425*** SE -0.1043 -0.1135 0.0994*** SD79LOCPC 0.0009 -0.0277*** 0.0329** Models MG vs PMG PMG vs FE MG vs FE
Hausman tests Chi2(8) = 37.79 *** Chi2(8) = 10.62 Chi2(8) = 5.34
Notes: ***, ** denote significant at 1% and 5%, respectively; Hausman results for H0: difference in coefficients not systematic; ECM denotes error correction mechanism; the long-run parameters are computed elasticities; the Stata command xtpmg was used.
Given that the Hausman tests points to panel homogeneity, a battery of specification tests were performed, namely on heteroskedasticity, contemporaneous correlation among cross sections, non-correlation of variances across individuals, and autonon-correlation. Checking for eventual violations in these assumptions was crucial given the sensibility of traditional panel estimators to their presence. First, the group heteroskedasticity of the fixed effects was performed using the modified Wald test. This test, which has a χ2 distribution, tests the null of homoskedascity, i.e., σi
2
=σ2 for i=1,..,N, with σ2 being the variance of country i. Second, the Pesaran test of cross-section independence was computed to assess the presence of contemporaneous correlation among cross sections. The null hypothesis of this test states that the residuals are not correlated and it follows a normal distribution. In order to verify whether the variances across individuals are not correlated, the Breusch-Pagan Langragian multiplier test of independence was performed. This test follows a χ2 distribution. Finally, to check the existence of serial correlation, the Wooldridge test for autocorrelation was performed. The null hypothesis of this test is no serial correlation and follows an F distribution.
The results shown in Table 6 support the rejection of the null hypothesis of the modified Wald test, pointing to the presence of heteroskedasticity. The Pesaran test points to the existence of contemporaneous correlation. The Breusch-Pagan LM test does not reject the hypothesis that the residuals are correlated. Finally, the Wooldridge test supports that the data has first order autocorrelation.
Table 6. Specification tests
Statistics Statistics
Modified Wald test 528.26*** Breusch-Pagan LM test 192.613***
Pesaran test 4.460*** Wooldridge test 301.835***
Note: *** denote significant at 1%; results for H0 of Modified Wald test: sigma(i)^2 = sigma^2 for all I; results for H0 of Pesaran and Breusch-Pagan LM tests: residuals are not correlated; results for H0 of Wooldridge test: no first-order autocorrelation.
Given that heteroskedasticity, contemporaneous correlation, first order autocorrelation, CSD and a large time span are present, the Driscoll and Kraay (1998) estimator (e.g. Hoechle, 2007) was used (Table 7). This estimator is a matrix estimator that produces standard errors that are robust to several phenomena, namely the ones found in the sample errors. Additionally, as a benchmark, the FE estimator and the FE estimator with robust standard errors (Table 7) were applied, so that heteroskedasticity, which was previously verified, was controlled for.
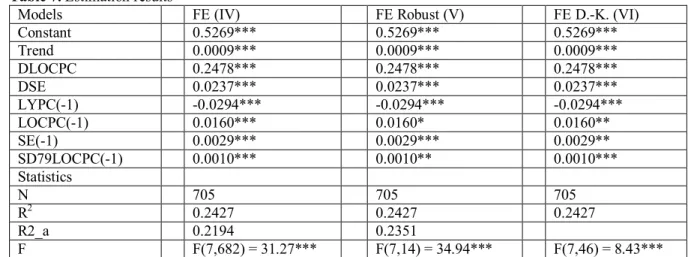
Table 8 displays the short- and long-run elasticities/impacts for the models FE (IV), FE robust (V), and FE D.-K. (VI).
It ought to be noted that the long-run elasticities/impacts were not directly made available by the estimates of models (Table 7), and therefore they must be computed. These elasticities/impacts were achieved by dividing the coefficient of the variables by the coefficient of LYPC, both lagged once and multiplying the ratio by -1.
159 Table 7. Estimation results
Models FE (IV) FE Robust (V) FE D.-K. (VI)
Constant 0.5269*** 0.5269*** 0.5269*** Trend 0.0009*** 0.0009*** 0.0009*** DLOCPC 0.2478*** 0.2478*** 0.2478*** DSE 0.0237*** 0.0237*** 0.0237*** LYPC(-1) -0.0294*** -0.0294*** -0.0294*** LOCPC(-1) 0.0160*** 0.0160* 0.0160** SE(-1) 0.0029*** 0.0029*** 0.0029** SD79LOCPC(-1) 0.0010*** 0.0010** 0.0010*** Statistics N 705 705 705 R2 0.2427 0.2427 0.2427 R2_a 0.2194 0.2351 F F(7,682) = 31.27*** F(7,14) = 34.94*** F(7,46) = 8.43***
Notes: ***, **, * denote statistically significant at 1%, 5% and 10% level, respectively; and the Stata commands xtreg, and xtscc were used.
Table 8. Elasticities and adjustment speed
Models FE (IV) FE Robust (V) FE D.-K. (VI)
Short-run semi-elasticities/impacts
DLOCPC 0.2478*** 0.2478*** 0.2478***
DSE 0.0237*** 0.0237*** 0.0237***
Computed long-run elasticities/impacts
LOCPC 0.5425*** 0.5425* 0.5425**
SE 0.0994*** 0.0994*** 0.0994**
SD79LOCPC 0.0329** 0.0329** 0.0329**
Speed of adjustment
ECM -0.0294*** -0.0294*** -0.0294***
Notes: ***, **, * denote statistically significant at 1%, 5% and 10% level, respectively. ECM denotes the coefficient of the variable LYPC lagged once.
5. Discussion
This study is grounded on per capita data and on a panel of oil producing countries. As such, the countries considered in the analysis are a very diversified panel that include an assortment of: (i) OPEC members; and (ii) developing and developed countries. Therefore, this diversity makes the analysis wide-ranging. The research extends the literature on the energy-growth nexus by incorporating the effect of oil consumption, the ratio of oil production to primary energy consumption, and the shift in the elasticity of oil-growth provoked by the second oil shock. Largely, the results support the presence of cointegration/long memory contradicting the results of the Westerlund (2007) test, performed previously (Table 4). Indeed, the coefficients of error correction mechanisms (ECM) are negative and highly statistically significant.
The long-run elasticity of oil consumption (LOCPC) loses statistical significance (only at 10% significance level) in the FE Robust model. The results reveal that the idiosyncrasy of the oil shock of 1979 was lasting, positive, and statistically highly significant for the elasticity of oil-growth. The causality running from oil consumption to economic growth was noticed, validating the growth hypothesis of the oil-growth nexus. This causality has a major impact in the long-run. This finding is far from unexpected given that this work is focused on oil producers. Indeed, it is predictable that they would use an available oil endowment resource, and as shown, the resource is effectively employed, which is signalled by its positive impact on economic growth. This outcome is compatible both with economies with low electrification levels and with the increased contribution of the oil refinery and transport sectors to domestic output. These arguments are in line with the overviews of IEA (2013), El-Katiri (2013), and Gately et al. (2013).
160 The results reveal that the elasticity of oil consumption on growth is positive, although modest in magnitude, especially in the short-run. The relative abundance of oil resources, captured by the variable SE, is shown to be a driver of economic growth for this group of countries. Noting that SE is a ratio, if it remains constant, oil production increases output. At the same time, if it remains constant, primary energy consumption efficiency measures could be designed without hampering economic growth. Overall, the higher the level of oil self-sufficiency, the larger the economic growth will be.
Regarding elasticities/impacts, in the short- and long-run, oil consumption is the main driving force of growth, followed by the ratio of oil production to primary energy consumption. The option for using dynamic panel techniques appears adequate, as the phenomenon under analysis is both a short and long-run one. The speed of adjustment is very low, under 3%, as shown by the ECM term in Table 8, revealing that the adjustment to shocks requires a longer time span in order to achieve equilibrium. 6. Conclusion
The oil-growth nexus in oil producing countries was analysed within a context where oil consumption, the ratio of oil production to primary energy consumption, and the structural shift of the second oil shock were controlled for. To ensure the trustworthiness of using the recent panel data estimators, which are sensitive to the asymptotic properties of time, a long time period is used, for which data is available. Although working on macro panels, no cross-sectional heterogeneity of parameter slopes was found. The CD-tests indicate the presence of cross-sectional dependence. The decision to decompose the total effects into their short and long-run components proved to be wise. Bringing together diverse panel data estimators constitutes a valid contribution to the literature of the oil-growth nexus in oil producing countries.
Evidence was found to support the traditional growth hypothesis of the energy-growth nexus, both in the short and long-run. Furthermore, the panel dynamic specification detects cointegration/long memory, as the ECM term is negative and statistically highly significant. Indeed, the speed of adjustment to the long-run equilibrium is fundamental for understanding the oil-growth nexus. The driving forces of relative oil production and oil consumption on growth were confirmed. The structural break in elasticity of oil consumption to growth proved to be positive, but of low magnitude. Once the growth hypothesis from oil to growth is proven, this work will lend support to design energy efficiency policies in primary energy consumption. Moreover, the policymakers will become aware of the benefits of promoting oil self-sufficiency, by reinforcing the use of endogenous resources.
References
Al Jaber, S. (2013). MENA energy transition strategy: A call for leadership in energy innovation, Energy Strategy Reviews, 2(1), 5-7.
Alam, M. J., Begum, I. A., Buysse, J., Van Huylenbroeck, G. (2012). Energy consumption, carbon emissions and economic growth nexus in Bangladesh: Cointegration and dynamic causality analysis, Energy Policy, 45, 217-225.
Al-Mulali, U. (2011). Oil Consumption, CO2 emission and economic growth in MENA countries, Energy 36(10), 6165-6171.
Anselin, L. (2001). Spatial econometrics. In A Companion to Theoretical Econometrics, Baltagi, B. (Ed.). Blackwell: Oxford, 310-330.
Apergis N., Payne, J.E. (2009). Energy consumption and economic growth in Central America: Evidence from a panel cointegration and error correction model, Energy Economics, 31(2), 211-216.
Apergis, N., Payne, J.E. (2010). Energy consumption and economic growth in South America: Evidence from a panel error correction model, Energy Economics, 32(6), 1421-1426.
Baltagi, B.H. (2008). Econometric Analysis of Panel Data, Fourth edition, Chichester, UK: John Wiley & Sons.
Behmiri, N., Manso, P. (2013). How crude oil consumption impacts on economic growth of Sub-Saharan Africa? Energy, 54(1), 74-83.
Belke, A., Dobnik, F., Dreger, C. (2011). Energy consumption and economic growth: New insights into the cointegration relationship, Energy Economics, 33(5), 782-789.
Belloumi, M. (2009). Energy consumption and GDP in Tunisia: Co-integration and causality analysis, Energy Policy, 37(7), 2745-2753.
161 Bildirici, M., Kayıkçı, F. (2013). Effects of oil production on economic growth in Eurasian countries:
Panel ARDL approach, Energy, 49(1), 156-161.
Blackburne III, E.F., Frank, M.W. (2007). Estimation of nonstationary heterogeneous panels, The Stata Journal, 7 (2), 197-208.
Chen, P.-Y., Chen, S.-T., Chen, C.-C. (2012). Energy consumption and economic growth – New evidence from meta analysis, Energy Policy, 44, 245-255.
Choi, I. (2001). Unit root tests for panel data, Journal of International Money and Finance, 20(1), 249-272.
Ciarlone, A. (2011). Housing wealth effect in emerging economies, Emerging Markets Review, 12(4), 399-417.
Damette, O., Seghir, M. (2013). Energy as a driver of growth in oil exporting countries?, Energy Economics, 37, 193-199.
Dantama, Y.U., Abdullahi, Y.Z., Inuwa, N. (2012). Energy consumption - economic growth nexus in Nigeria: an empirical assessment based on ARDL bound test approach, European Scientific Journal, 8(12), 141-157.
Darbouche, H. (2013). MENA’s growing natural gas deficit and the issue of domestic prices, Energy Strategy Reviews, 2(1), 116-121.
Driscoll, J., Kraay, A.C. (1998). Consistent covariance matrix estimation with spatially dependent data, Review of Economics and Statistics, 80(4), 549-560.
Eberhardt, M. (2011). Panel time-series modeling: New tools for analyzing xt data, 2011 UK Stata Users Group meeting.
Eberhardt, M., Presbitero, A.F. (2013). This Time They Are Different: Heterogeneity and Nonlinearity in the Relationship Between Debt and Growth, IMF Working Paper 13/248.
ECB (2010). Energy markets and the euro area macroeconomy, Occasional Paper Series, 113 / June, European Central Bank.
El-Katiri, L. (2013). Energy sustainability in the Gulf States: the why and the how, Oxford Institute for Energy Studies, http://www.oxfordenergy.org/wpcms/wp-content/uploads/2013/03/MEP_4.pdf, (accessed January 21, 2014).
Esfahani, H.S., Mohaddes, K., Pesaran, M. H. (2014). An empirical growth model for major oil exporters, Journal of Applied Econometrics, 29(1), 1-21.
Esfahani, H.S., Mohaddes, K., Pesaran, M.H. (2013). Oil exports and the Iranian economy, The Quarterly Review of Economics and Finance, 53(3), 221-237.
Farhani, S., Rejeb, J.B. (2012). Energy Consumption, Economic Growth and CO2 Emissions: Evidence from Panel Data for MENA Region, International Journal of Energy Economics and Policy, 2(2), 71-81.
Fattouh, B., El-Katiri, L. (2013). Energy subsidies in the Middle East and North Africa, Energy Strategy Reviews, 2(1), 108-115.
Fuinhas, J. A., Marques, A. C. (2013). Rentierism, energy and economic growth: The case of Algeria and Egypt (1965–2010), Energy Policy, 62, 1165-1171.
Gately, D., Al-Yousef, N., Al-Sheikh, H.M.H. (2013). The rapid growth of OPEC′s domestic oil consumption, Energy Policy, 62, 844-859.
Hoechle, D. (2007). Robust standard errors for panel regressions with cross-sectional dependence, Stata Journal, 7(3), 281-312.
Hossein, S.S.M., Yazdan, G.F., Hasan, S. (2012). Consideration the relationship between energy consumption and economic growth in oil exporting country, Procedia - Social and Behavioral Sciences, 62, 52-58.
Hsiao, C. (2003). Analysis of Panel Data, 2nd ed., Cambridge, Cambridge University Press.
IEA (2013). World Energy Outlook 2013, The International Energy Agency, Paris, IEA Publications. Kao, C. (1999). Spurious Regression and Residual-Based Tests for Cointegration in Panel Data,
Journal of Econometrics, 90(1), 1–44.
Klein, N. (2010). The Linkage between the Oil and Non-oil sectors – A panel VAR approach, IMF Working Paper, WP/10/118, http://www.imf.org/external/pubs/ft/wp/2010/wp10118.pdf, (accessed November 9, 2013).
Klevmarken, N.A. (1989). Panel studies: What can we learn from them? Introduction, European Economic Review, 33(2-3), 523-529.
162 Kraft, J., Kraft, A. (1978). On the Relationship between Energy and GNP, Journal of Energy and
Development, 3(2), 401-403.
Levin, A., Lin, C.-F., Chu, C.-S. J. (2002). Unit root test in panel data: Asymptotic and finite-sample properties, Journal of Econometrics, 108(1), 1-24.
Lim, K.-M., Lim, S.-Y., Yoo, S.-H. (2014). Oil Consumption, CO2 Emission, and Economic Growth: Evidence from the Philippines, Sustainability, 6(2), 967-979.
Lotfalipour, M., Falahi, M., Ashena, M. (2010). Economic growth, CO2 emissions, and fossil fuels consumption in Iran, Energy, 35(12), 5115-5120.
Luft, G., Korin, A. (2009). Turning Oil into Salt: Energy Independence through Fuel Choice, South Carolina, BookSurge Publishing.
Maddala, G.S., Wu, S. (1999). A comparative study of unit root tests with panel data a new simple test, Oxford Bulletin of Economics and Statistics, 61(S1), 631-652.
Mahadevan, R., Asafu-Adjaye, J. (2007). Energy consumption, economic growth and prices: a reassessment using panel VECM for developed and developing countries, Energy Policy, 35 (4), 2481–2490.
Mehrara, M. (2007). Energy consumption and economic growth: the case of oil exporting countries, Energy Policy, 35(5), 2939–2945.
Mehrara, M. (2008). The asymmetric relationship between oil revenues and economic activities: The case of oil-exporting countries, Energy Policy, 36(3), 1164-1168.
Mohammadi, H., Parvaresh, S. (2014). Energy consumption and output: Evidence from a panel of 14 oil-exporting countries, Energy Economics, 41, 41-46.
Moscone, F., Tosetti, E. (2010). Health expenditure and income in the United States, Health Economics, 19(2), 1385-1403.
Narayan, P., Sharma, S., Poon, W., Westerlund, J. (2014). Do oil prices predict economic growth? New global evidence, Energy Economics, 41, 137-146.
Narayan, P.K., Smyth, R. (2008). Energy Consumption and Real GDP in G7 Countries: New Evidence from Panel Cointegration with Structural Breaks, Energy Economics, 30(5), 2331-2341.
Naser, H. (2014). Oil Market, Nuclear Energy Consumption and Economic Growth: Evidence from Emerging Economies, International Journal of Energy Economics and Policy, 4(2), 288-296. Ozturk, I. (2010). A literature survey on energy-growth nexus, Energy Policy, 38(1), 340-349.
Ozturk, I., Aslan, A., Kalyoncu, H. (2010). Energy consumption and economic growth relationship: Evidence from panel data for low and middle income countries, Energy Policy, 38(8), 4422-4428.
Pao, H.-T., Tsai, C.-M. (2011). Modeling and forecasting the CO2 emissions, energy consumption, and economic growth in Brazil, Energy, 36(5), 2450-2458.
Park, S.-H., Yoo, S.-H. (2014). The dynamics of oil consumption and economic growth in Malaysia, Energy Policy, 66, 218-223.
Pedroni, P. (1999). Critical Values for Cointegration Tests in Heterogeneous Panels with Multiple Regressors, Oxford Bulletin of Economics and Statistics, 61(Special Issue), 653–70.
Pedroni, P. (2004). Panel Cointegration: Asymptotic and Finite Sample Properties of Pooled Time Series Tests with an Application to the PPP Hypothesis, Econometric Theory, 20(3), 597–625. Pesaran, M.H. (2007). A simple panel unit root test in the presence of cross-section dependence,
Journal of Applied Econometrics, 22(2), 265-312.
Pesaran, M.H., Shin, Y., Smith, R.P. (1999). Pooled Mean Group Estimation of Dynamic Heterogeneous Panels, Journal of American Statistical Association, 94(446), 621-634.
Sgouridis, S., Griffiths, S., Kennedy, S., Khalid, A., Zurita, N. (2013). A sustainable energy transition strategy for the United Arab Emirates: Evaluation of options using an Integrated Energy Model, Energy Strategy Reviews, 2(1), 8-18.
Westerlund, J. (2007). Testing for error correction in panel data, Oxford Economics and Statistics, 69(6), 709-748.
Wolde-Rufael, Y. (2009). Energy Consumption and Economic Growth: The Experience of African Countries Revisited, Energy Economics, 31(2), 217-224.
Yıldırım, E., Sukruoglu, D., Aslan, A. (2014). Energy Consumption and Economic Growth in the Next 11 Countries: The Bootstrapped Autoregressive Metric Causality Approach, Energy Economics, 44, 14-21.
163 Yousef, N.A. (2013). Demand for Oil Products in OPEC Countries: A Panel Cointegration Analysis,
International Journal of Energy Economics and Policy, 3(2), 168-177.
Yuan, C., Liu, S., Xie, N. (2010). The Impact of Chinese Economic Growth and Energy Consumption of the Global Financial Crisis: An Input-Output Analysis, Energy, 35(4), 1805–1812.
Zhang, X., Cheng, X. (2009). Energy Consumption, Carbon Emissions and Economic Growth in China, Ecological Economics, 68(10), 2706-2712.