A Work Project, presented as part of the requirements for the Award of a Masters
Degree in Economics from the NOVA – School of Business and Economics.
Oil, Foreign Aid and FDI Flows:
The Missing Link?
Duarte Jorge Portela Ricardo # 514
A Project carried out under the supervision of: Pedro Vicente
Abstract
This paper studies the possible strategic use of foreign aid to get preferential access to oil.
Furthermore, it also addresses the role of oil as a determinant factor for the allocation of Foreign
Direct Investment (FDI). Using a panel data set of 48 oil producing countries for a period of 30
years, ranging from 1980 to 2010, it was found that, not only is oil a key factor for the
determination of foreign aid and FDI, but also that there is a clear distinction between the
importance conceived by donor and/or investing countries in their current and future level of oil
dependence.
Key words: Aid, Foreign Direct Investment, Oil reserves and Oil production.
Introduction
“A century ago, petroleum – what we call oil – was just an obscure commodity; today it is
almost as vital to human existence as water” - James Buchan, a British novelist and journalist.
The above statement undoubtedly shows the importance of oil. Certainly, there is no
well-functioning country which is not dependent upon it. Actually, since the widespread use of the
internal combustion engine, oil became almost as vital as water. Moreover, two additional
features are worth mentioning in order to fully perceive its importance. Firstly, despite its
essential role in every economy, it is not available everywhere, it means that some countries
produce it while others have to import it. Secondly, it is a nonrenewable resource, for which,
there is not yet, a 100 per cent direct substitute.
In fact, the reasons presented in the previous paragraph ground the motivation for this paper,
which is to study a particular feature of the increasing competition for oil; the use of foreign aid
by donors as a strategic mechanism to get priority access to oil. Indeed, previous literature such
as Dudley and Montmarquette (1976) and Alesina and Dollar (2000), among others, had
donor countries. Consequently, being oil such an important input for every economy, one of the
main questions addressed in this paper is the following: is the increased competition for getting
access to oil translated into the patterns of foreign aid giving?
Additionally, this paper studies not only, the importance of oil in determining the flows of
international aid, but it also evaluates if the current and future levels of oil production in the aid
receiving countries might have different impacts over the determination of those flows. In other
words, it also analyzes, if a donor country is more concerned with its current or with its future
degree of oil dependence when it guides its foreign aid policy towards oil producing countries.
Furthermore, this paper is also interested in studying the possible link between oil and FDI.
As a result, the second major question is the following: is the direction of FDI determined by the
existence of oil in the investment hosting country? Specifically, if FDI flows are determined by
the existence of oil what would be more important for the location of future investments: the
current or the future level of oil production?
In fact, through the use of a panel data set of 48 oil producing countries for a period of 30
years, ranging from 1980 to 2010, it was found that, not only is oil in effect a key factor for the
determination of foreign aid and FDI flows, but also that there is a clear distinction between the
importance conceived by donor and/or investing countries to their current and future levels of
oil dependence.
On the one hand, there is a clear pattern showing that direction of FDI flows is positively
affected, only by the current level of oil production in the investment hosting country. On the
other hand, the use of foreign aid as a strategic mechanism to get preferential access to oil does
not indicate that donor countries conceive a higher importance to the current level of oil
production. Actually, some donors such as the United States of America (USA) guide their
while other donors, such as Sweden, do not even take in consideration the existence of oil in the
aid receiving country when deciding the direction of their aid flows. Furthermore, some donors
such as the United Kingdom (UK) are only concerned with their future level of oil dependence,
therefore rewarding only future oil production.
Finally, the paper is structured as follows. Chapter 2 encompasses the literature review and is
divided into three sections: section 2.1 reviews the literature on the determinants of foreign aid;
section 2.2 reviews the literature on the resource curse and section 2.3 reviews the literature on
the determinants of FDI. Chapter 3 is dedicated to the empirical strategy conducted in this paper
and it is divided into three sections: section 3.1 addresses the empirical model employed in the
estimation of the possible link between oil, foreign aid and FDI; section 3.2 is devoted to the
three empirical methods used and section 3.3 describes the data set built for this paper. Chapter
4 reports the results obtained through the three estimation methods. Chapter 5 concludes the
paper.
2. Literature Review
2.1 The Determinants of Foreign Aid
One of the core subjects in the aid literature has been the motivation behind foreign aid
giving. Indeed, researchers have been focused on whether or not international donors are really
concerned with the development prospects of aid receiving countries.
In particular, Dudley and Montmarquette (1976) presented one of the first attempts to
formally model aid determinants. The model is divided in two parts and considers the donor’s
utility function to be contingent on the impact of aid in the receiving countries. Part one
measures the impact of aid giving, as a function of the population size, the amount of aid and
the recipient´s per capita income. Subsequently, administrative costs are added to the basic
the Organization for Economic Co-operation and Development (OCDE) and the main finding is
that, economic and political links to donor countries contribute to explain the pattern of aid
giving.
Moreover, Maizels and Nissanke (1984) try to grasp the allocation of aid as the resulting
equilibrium between the interests of donors and the needs of recipients. Indeed, a database of 80
developing countries for the periods between 1969-1970 and 1978-1980 is used for
cross-country regressions of bilateral and multilateral aid flows, under the framework of two
alternative models. The first, designated “the recipient need model”, considers that aid serves to
offset insufficiencies in domestic resources and empirically, it provides a sound enlightenment
for the allocation of multilateral aid. The second, designated “donor interest model”, presupposes that aid giving obeys to donor interests only and, empirically it is more suitable to
explain the pattern of bilateral aid; implying that bilateral aid is mostly dictated by the donor
country interests.
Finally, Alesina and Dollar (2000) departing from a database of the Development Assistance
Committee (DAC) of the OCDE on bilateral aid flows (with a panel of 21 countries for
five-year periods between 1970-1974 and 1990-1994) assess the behavior of international donors,
and find that aid giving is mostly dictated by political and strategic considerations rather than
effective poverty reduction. This result stems from the fact that “an inefficient, economically
closed, mismanaged non-democratic former colony politically friendly to its former colonizer,
receives more foreign aid than another country with similar levels of poverty, a superior policy
stance, but without a past as a colony”, a result also reached by Burnside and Dollar (2000) who
found that bilateral aid seems to depend on strategic interests.
Alesina and Dollar (2000) also uncovered remarkable differences between donors, being the
poverty reduction. A result reinforced by Gates and Hoeffler (2004), who verified that the four
Nordic countries (Denmark, Finland, Norway, Sweden) pay more attention to the level of
poverty and to the strength of democracy, when deciding their aid disbursements.
2.2 The Natural Resource Curse
Over the last fifty years, the notion that a country with a natural resource windfall is likely to
be worse off than another country in which resources are scarce has led to the development of a
massive theoretical and empirical research in order to understand this counterintuitive idea.
Indeed, the roots of the literature on the natural resource curse lay on two fundamental
works: the Prebisch–Singer hypothesis (1950)1 which states that over time the terms of trade between primary and manufactured goods would deteriorate leading to poorer development
prospects for the countries which have become specialized in exporting primary goods; and on
Corden and Neary (1982) who first presented a theoretical analysis of the Dutch Disease2 as
“the phenomenon whereby a boom in one traded goods sector squeezes profitability in other
traded goods sectors, both by bidding resources away from them and by placing upward
pressure on the exchange rate”3.
Despite the theoretical relevance of the two previous works, it was necessary to wait for
Sachs and Warner (1995) to have a worldwide empirical study on this topic. In fact, for the
period 1970-90, with a sample of 95 developing countries, it was found evidence of an inverse
association between natural resource abundance and economic growth.
Albeit the fact that the bulk of resource rich countries had effectively witnessed deterioration
in their development prospects, it is clear the existence of some success cases, like Botswana
1 To be precise, the Prebisch–Singer hypothesis is the result of two independent works: Prebisch (1950) and Singer
(1950).
which was investigated in Acemoglu et al (2003). Definitely, the success cases led researchers
to question the rationale behind the resource curse, which in turn changed the focus of both
empirical and theoretical analysis to the role played by institutions in determining whether or
not a resource curse will appear. Indeed, Mehlum et al (2006) established a model, which
departs from the assumption that the quality of institutions is what matters for a natural resource
abundant country to be a growth winner or loser. As a result, the authors made a distinction
between two types of institutions: “producer friendly institutions, where rent-seeking and
production complement each other, and grabber friendly institutions, where rent-seeking and
production are competing activities”. Finally, the authors built on Sachs and Warner (1997a,)
work and ascertain that the resource curse occurs in countries with “grabber friendly
institutions” but not in countries with “producer friendly institutions”, which is in accordance
with their theoretical model.
Finally, more recent literature has been advocating the existence of a political curse as the
main cause for the poorer development prospects in resource rich countries. In particular,
Vicente (2010) evaluates the effects of an oil discovery announcement in the period between
1997-1999, in Sao Tome and Principe and finds evidence of a “clear increase on the perceived
level of corruption in a number of public services and allocations”. Also, Tsui (2011) has found
that “discovering 100 billion barrels of oil pushes a country’s democracy level almost 20
percentage points below trend after three decades”. 2.3 Determinants of Foreign Direct Investment
According to the OCDE “A foreign direct investor is an individual, an incorporated or unincorporated public or private enterprise, a government, a group of related individuals, or a
group of related incorporated and/or unincorporated enterprises which has a direct investment
country or countries of residence of the foreign direct investor or investors”. Nevertheless, this
definition only specifies what a foreign investor is. It does not concern the rationale that drives
an investor to opt for a particular location, instead of another, when he is deciding where to
allocate his investment.
In effect, three major factors are repeatedly found in the literature as the main determinants
of FDI: exchange rate, taxes and institutions. Regarding the first one, Froot and Stein (1991)
developed a model and an empirical study which led to the conclusion that, in presence of
imperfect information, the exchange rate is a core factor for the allocation of FDI. Moreover,
Mooij and Ederveen (2003), through a revision of 25 empirical studies regarding the impact of
taxes on FDI and by computing a uniform tax rate elasticity to all those papers, have found that
“the mean value of the tax rate elasticity in the literature is around minus 3.3, i.e. a one
percentage point reduction in the hosting country tax rate raises foreign direct investment in that
country by 3.3%.” In order words, it seems that an increase in taxes is associated with a lower
amount of FDI inward flows. Still, it is necessary to take into consideration the role played by
taxes in the home country as shown by Swenson (1994), “increased taxes may spur inward foreign investment, if the foreign investor response is critically shaped by the tax provisions
faced by the foreign investor in his home country.” The quality of institutions is also assumed as
a determinant of FDI. Indeed, the protection of property-rights, the well-functioning of markets
and the prevention of corruption, among other factors, are all affected by the quality of
institutions and have an impact over the direction of FDI flows; as shown by Alesina and Dollar
(2000) who have found that the rule of law and existence of sound economic policies in the
investment hosting country are both key factors to determine the direction of FDI.
Finally, more recent literature has been changing the focus from studying just one
particular country or region. As an example, Anyanwu (2011) with a panel data set ranging
from 1980 to 2007 finds that the main determinants of FDI inflows to Africa are: market size,
openness to trade, public expenditure and natural resource endowment and exploitation
(specially for oil), among others.
3. Empirical Strategy
The empirical strategy is divided in three sub-sections, each addressing a particular feature.
The first is dedicated to the empirical model employed in the estimation of the link between oil,
foreign aid and FDI. The second to the empirical methods used. Finally, the third describes the
data set built for this paper.
3.1 Empirical Model
The empirical model constructed to test the possible missing link between oil, foreign aid
and FDI consists of the following two equations. The first, addresses the effects of oil over
foreign aid giving while the second, deals with the effects of oil over the direction of FDI flows.
(I)
(II)
Where and index countries and time respectively. is the logarithm of foreign aid
given in the form of grants by each donor and is the logarithm of FDI outward flows of
each investor country, included in the data set. denotes oil reserves and oil production, of
all oil producing countries contemplated in the data set. Moreover, is a vector of control
variables and and are error terms. Finally, from now on equation (I) and (II) will be
denoted by Aid equation and FDI equation, respectively.
Aid Equation
The first objective of this paper is to study the possible use of foreign aid by the main
donors guide their foreign aid policy in that strategic manner, what would they consider more
important: their current or their future level of oil dependence. In order words, equation (I)
addresses the importance of current oil production versus future oil production for a donor
country who dictates its foreign aid policy towards oil producing countries.
Consequently, the variables and were included on the right hand side (RHS) of
equation (I) to capture the impact on foreign aid giving of a rise in oil reserves and/or a rise in
oil production. In effect, oil production addresses the importance of the present, while oil
reverses is a proxy to measure the importance of the future.
Additionally, - the vector of control variables is defined as follows:
Where is the logarithm of GDP per capita; represents the level of democracy;
and are both measures of risk denominated Government Stability and Bureaucracy Quality.
These controls were included in equation (I) since it is believed that they have an impact over
the amount of foreign aid giving. In effect, Alesina and Dollar (2000) found that the income of
the recipient and itslevel of democracy have an impact in the allocation of foreign aid. Finally,
as mentioned in section 2.2, Mehlum et al (2006) found that the quality of institutions is what
matters for a natural resource abundant country to be a growth winner or loser. As a result, the
two risk measures were included in equation (I) to evaluate whether or not international donors
are concerned with the possible existence of a resource curse in the oil producing countries.
FDI Equation
The second objective of this paper is to study if the direction of FDI would be influenced by
the existence of oil production in the investment hosting country. Specifically, if the direction of
FDI flows is determined by the existence of oil, what would be more important for the location
Therefore, the variables and were included on the RHS ofequation (II) to capture
the impact on FDI outward flows of a rise in oil reserves and/or a rise in the production of oil. In
fact, oil production concerns the importance of current oil production, while oil reverses
is a proxy to measure the importance of future oil production.
Additionally, - the vector of control variables is defined as follows:
Where represents the level of democracy, and are both measures of risk
denominated Socioeconomic Conditions and Law and Order. These controls were included in
equation (II) to assess the results obtainedin Alesina and Dollar (2000), who have found that
democracy does not play a determinant role in the allocation of FDI flows and that the rule of
law, here captured by the Law and Order risk measure, and the existence of sound economic
policies, here captured by the Socioeconomic Conditions risk measure, are the key factors for
the allocation of FDI.
3.2 Empirical Methods
In order to study the possible link between oil, foreign aid and FDI, three estimation methods
were considered: Ordinary Least Squares (OLS), Fixed Effects (FE) and Second Two Stages
Least Squares (2SLS). Moreover, this investigation relies upon observable data and the data set
is composed only by panel data.
OLS Estimator
Being the OLS estimator the one most used in empirical analysis, both equations (I) and (II)
were estimated through the use of it. Besides, the OLS is assumed to be the best linear unbiased
estimator if, and only if, the Gauss-Markov assumptions are met.
Nevertheless, despite the usefulness of the OLS estimator as a starting point for any
results obtained with it. Namely, sample selection bias, omitted variables bias and simultaneous
causality bias are three major problems, in the context of this paper, that the OLS may fail to
address and which would affect the study of the possible link between oil, foreign aid and FDI.
Regarding the first problem, sample selection bias, Heckman (1979) defines it “as the bias that results from using non-randomly selected samples to estimate behavioral relationships as an
ordinary specification bias that arises because of a missing data problem”. However, despite its relevance, the possible existence of a sample selection bias will not be addressed in the context
of this paper.
Additionally, the suspicion regarding the existence of an omitted variable bias and of a
simultaneous causality bias led to the usage of two additional estimation procedures, FE and
2SLS which will be explained in the following two sub-sections. Finally, it is necessary to take
into account the possible presence of heteroskedastic standard-errors, which would affect the
reliability of the inference process. Therefore, all results presented in section 4 were computed
with heteroskedastic robust standard-errors in order to avoid this problem.
FE Estimator
As stated above, one of the problems that the OLS estimator may not address is an omitted
variable bias, which results in estimated coefficients that are both biased and inconsistent. This
occurs when the following two conditions are verified: the omitted variable is correlated with at
least one of the independent variables and it is a determinant of the dependent variable. In the
case of this paper, it is possible to think of an omitted bias arising from an omitted variable
which may be correlated with the level of oil production and which may have an impact over
the amount of foreign aid giving and over the direction of FDI outward flows.
The solution encountered to overcome this possible problem was through the utilization of
control for omitted variables that may differ between oil producing countries but which are
constant over time. As a result, both equations (I) and (II) were estimated through the FE
method.
2SLS Estimator with FE
Another problem that the OLS estimator may not address is a simultaneous causality bias,
which results in estimated coefficients thatare both biased and inconsistent. This follows from
the inclusion of one or more endogenous explanatory variables in the estimated equation.
Indeed, Wooldridge (2005) defines an endogenous explanatory variable “as one that is correlated with the error term, either because of an omitted variable, measurement error, or
simultaneity”. Concerning both equations (I) and (II) it seemed logical to think of a simultaneity
problem arising from the independent variable oil production, since it is reasonable to think of a
direct link between the amount of oil produced and the existing reserves of oil. Therefore, to
overcome this possible problem, the variable oil production was instrumented through the use
of the 2SLS estimator.
Additionally, it is necessary to bear in mind that for a variable z to be considered a valid
instrument for the variable x, it must respect the following two conditions:
Table I. Valid Instrument Conditions
1. Exogenous instrument condition 2. Relevant instrument condition
Source: Adapted from Wooldridge 2005
Finally, despite the fact that the use of instrumental variables also contributes to the
minimization of the omitted variable bias, FE were still considered since the purpose here, as
mentioned above, is to control for omitted variables that may differ between oil producing
3.3 Data description
With the aim of estimating equations (I) and (II), real world data was collected regarding
each of the variables included in those equations and a panel data set composed of 48 oil
producing countries, 44 international donors and 34 investing countries for a period of 30 years,
ranging from 1980 to 2010, was constructed. The rest of this section is devoted to the
description of each of the variables included inequations (I) and (II) and is divided in two board
categories: dependent and independent variables.
3.3.1 Dependent variables
Aid
The dependent variable in equation (I) is the total amount of bilateral Grants granted by each
of the 44 donors reported by the DAC, of the OCDE, to the 48 oil producing countries included
in the data set. Moreover, Grants are defined by the DAC as transfers in cash or in kind for
which no legal debt is incurred by the recipient. The choice relied upon Grants instead of
Official Development Assistance (ODA) as in Dudley and Montmarquette (1976) and Alesina
and Dollar (2000) due to the fact that ODA disbursements according to the DAC are
concessional in character and convey a grant element of at least 25 per cent. Thus, being one of
the objectives to perceive whether or not foreign aid has been used as a strategically instrument
to get preferential access to oil, it seemed rational to use a measure of foreign aid for which no
legal debt is incurred by the recipient. Grants are expressed in constant prices (2010 USA
million dollars) and the 44 donors are listed in appendix 1.
FDI
In equation (II) the dependent variable is the total FDI outward flows by each of the 34
OCDE member countries, to the48 oil producing countries contemplated in the data set of this
countries are listed in appendix 2.
3.3.2 Independent variables
Oil Production and Proven Oil Reserves
As mentioned in section 3.1 the two oil variables were included in both equations (I) and (II).
They were used to study the importance of oil in determining the flows of international aid and
FDI but also to perceive if the current and future levels of oil production would have different
impacts over the determination of those flows. In fact, the rationale behind the inclusion of these
variables is to understand, if a donor and/or an investing country is more concerned with its
current or with its future degree of oil dependence when it guides its foreign aid and FDI flows
towards oil producing countries. Therefore, oil production addresses the importance of current
oil production in determining the allocation of foreign aid and FDI flows, while oil reserves,
which may be seen as proxy of future oil production, addresses the importance of future oil
production. The variables were retrieved from the BP Statistical Review of World Energy June
2012 and are expressed in thousand million barrels. Finally, 48 countries with current oil
production and with proven oil reserves were considered and they are listed in appendix 3 and 4,
respectively.
Instrumental Variable
As mentioned in section 3.2, in order for an instrument to be considered valid it must satisfy
two conditions: the exogenous and the relevant instrument condition. As a result, the
construction of the instrument used in this paper was dictated by these two conditions. In
particular, it results from the multiplication of two variables. The first variable is the amount of
oil consumption of each of the donors and/or investing countries which satisfies the exogeneity
condition, since it seems reasonable to assume that the variable oil consumption is not correlated
variable is the exports of goods and services, as percentage of GDP of each oil producing
country which satisfies the relevance condition, since it seems plausible to assume that for the
majority of oil producing countries a sizeable part of their exports of goods and services consists
of oil exports. The source of oil consumption is the BP Statistical Review of World Energy June
2012 and it is measured in thousand barrels daily. Finally, the source of the exports of goods and
services, as percentage of GDP is the World Bank (WB).
Controls
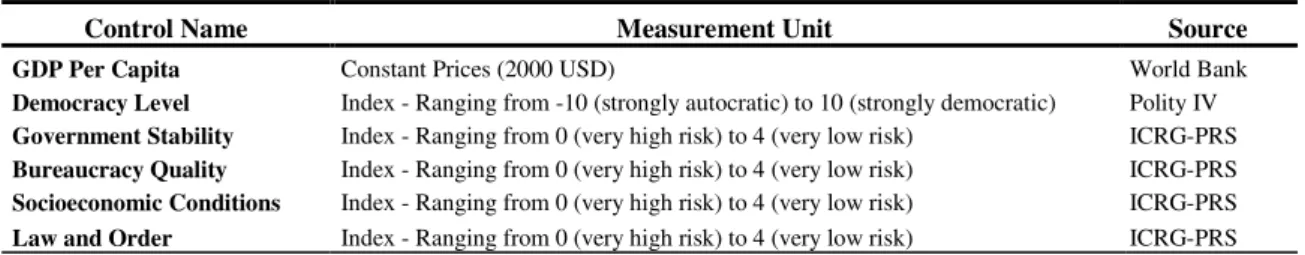
The control variables included in both equations (I) and (II) are described in the table II.
Table II. Control Variables
Control Name Measurement Unit Source
GDP Per Capita Constant Prices (2000 USD) World Bank
Democracy Level Index - Ranging from -10 (strongly autocratic) to 10 (strongly democratic) Polity IV
Government Stability Index - Ranging from 0 (very high risk) to 4 (very low risk) ICRG-PRS
Bureaucracy Quality Index - Ranging from 0 (very high risk) to 4 (very low risk) ICRG-PRS
Socioeconomic Conditions Index - Ranging from 0 (very high risk) to 4 (very low risk) ICRG-PRS
Law and Order Index - Ranging from 0 (very high risk) to 4 (very low risk) ICRG-PRS Notes: Government Stability is composed by three components: government unity, legislative strength and popular support. Socioeconomic Conditions is composed by three components: unemployment, consumer confidence and poverty. All index variables were normalized to the 0-1 scale. ICRG - International Country Risk Guide. PRS - Political Risk Services.
4. Results
The empirical findings, presented in this section, result from the estimation of both
equations (I) and (II) through the three estimation methods, explained above, with a panel data
set of 48 oil producing countries for a period of 30 years, ranging from 1980 to 2010.
Furthermore, the results are divided in two categories: aid and FDI, each encompassing six
regressions; one concerning the aggregate results and the remaining devoted to the following
five countries: USA, Germany, UK, France and Sweden. The first three were analyzed since
they were the three biggest donors of foreign aid in 2011 accordingly to the DAC. Moreover,
France and Sweden were studied to test the results of Alesina and Dollar (2000) who found that
disbursements of aid are more concerned with rewarding the political and economic
environment of the aid receiving country.
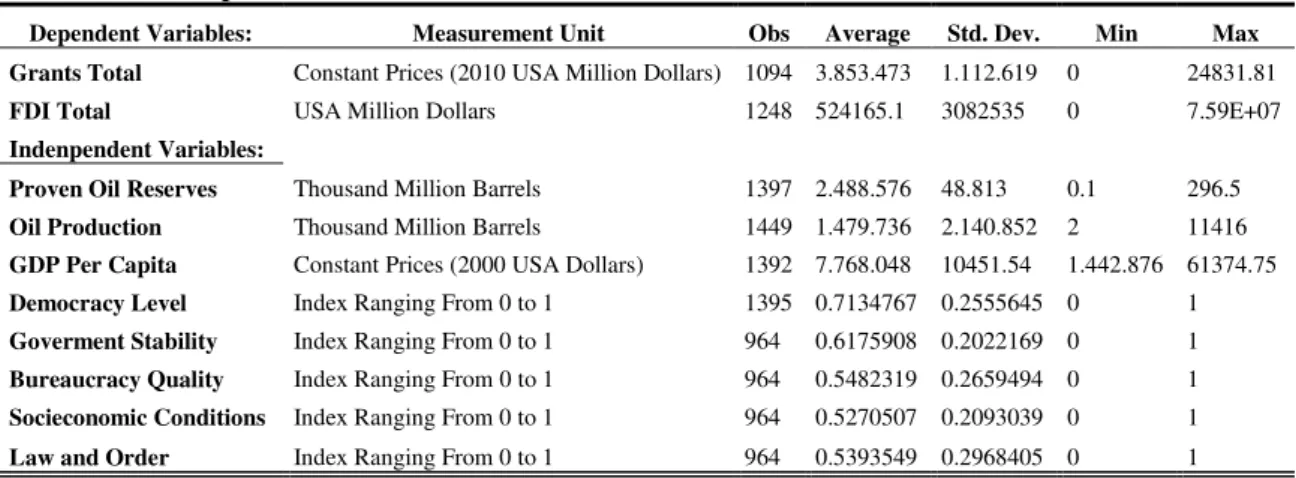
Finally to have a better sense of the variables in analysis, descriptive statistics of the main
variables included in both equations is presented in the following table.
Table III. Descriptive Statistics
Dependent Variables: Measurement Unit Obs Average Std. Dev. Min Max Grants Total Constant Prices (2010 USA Million Dollars) 1094 3.853.473 1.112.619 0 24831.81
FDI Total USA Million Dollars 1248 524165.1 3082535 0 7.59E+07
Indenpendent Variables:
Proven Oil Reserves Thousand Million Barrels 1397 2.488.576 48.813 0.1 296.5
Oil Production Thousand Million Barrels 1449 1.479.736 2.140.852 2 11416
GDP Per Capita Constant Prices (2000 USA Dollars) 1392 7.768.048 10451.54 1.442.876 61374.75
Democracy Level Index Ranging From 0 to 1 1395 0.7134767 0.2555645 0 1
Goverment Stability Index Ranging From 0 to 1 964 0.6175908 0.2022169 0 1
Bureaucracy Quality Index Ranging From 0 to 1 964 0.5482319 0.2659494 0 1
Socieconomic Conditions Index Ranging From 0 to 1 964 0.5270507 0.2093039 0 1
Law and Order Index Ranging From 0 to 1 964 0.5393549 0.2968405 0 1 Note: All variables are described in the previous section.
Aid Results
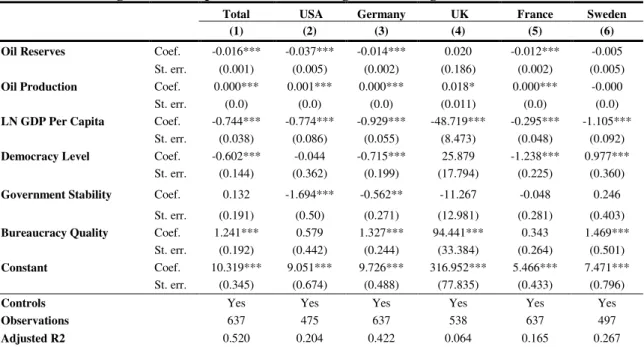
Table IV reports the results obtained through the OLS estimation of equation (I) and it is
possible to conclude that foreign aid has been used as a strategic mechanism by donor countries
to get preferential access to oil. However, a closer look at this result shows a clear difference in
the importance conceived by donor countries to the present, versus the importance given to the
future. In other words, foreign aid has been used as a strategic mechanism to get preferential
access to oil, nonetheless, donor countries seem to be only concerned with their current level of
oil dependence. In fact, table IV shows that a rise in future oil production, which is given as
proxy by the independent variable oil reverses, would imply a reduction in the amount of
foreign aid giving.
Besides the fact that the bulk of the six geographical entities under analysis guide their
foreign aid policy in a strategic manner to get preferential access to oil, there is an outlier in this
giving. Sweden is also an outlier in what respects the rewarding of the democratization process.
Furthermore, table IV also shows that the richer a country is, the lower is the amount of foreign
aid it receives. Indeed, it seems that the process of foreign aid giving takes into consideration the
level of poverty in the receiving country. Finally, the existence of a lower level of bureaucracy
quality in the oil producing countries does not undermine the amount of foreign aid received,
while the same is not true regarding the level of government stability.
Table IV. OLS Regressions - Dependent Variable: Log of total Aid given in the form of Grants
Total USA Germany UK France Sweden
(1) (2) (3) (4) (5) (6)
Oil Reserves Coef. -0.016*** -0.037*** -0.014*** 0.020 -0.012*** -0.005 St. err. (0.001) (0.005) (0.002) (0.186) (0.002) (0.005)
Oil Production Coef. 0.000*** 0.001*** 0.000*** 0.018* 0.000*** -0.000
St. err. (0.0) (0.0) (0.0) (0.011) (0.0) (0.0)
LN GDP Per Capita Coef. -0.744*** -0.774*** -0.929*** -48.719*** -0.295*** -1.105*** St. err. (0.038) (0.086) (0.055) (8.473) (0.048) (0.092)
Democracy Level Coef. -0.602*** -0.044 -0.715*** 25.879 -1.238*** 0.977*** St. err. (0.144) (0.362) (0.199) (17.794) (0.225) (0.360)
Government Stability Coef. 0.132 -1.694*** -0.562** -11.267 -0.048 0.246 St. err. (0.191) (0.50) (0.271) (12.981) (0.281) (0.403)
Bureaucracy Quality Coef. 1.241*** 0.579 1.327*** 94.441*** 0.343 1.469*** St. err. (0.192) (0.442) (0.244) (33.384) (0.264) (0.501)
Constant Coef. 10.319*** 9.051*** 9.726*** 316.952*** 5.466*** 7.471*** St. err. (0.345) (0.674) (0.488) (77.835) (0.433) (0.796)
Controls Yes Yes Yes Yes Yes Yes
Observations 637 475 637 538 637 497
Adjusted R2 0.520 0.204 0.422 0.064 0.165 0.267 Notes: Independent variables are described in detail in the previous section. Standard errors are robust standard errors. *significant at 10%, **significant at 5%, ***significant at 1%.
Overall, despite the usefulness of the OLS estimator it may not be able to address several
problems, which would undermine the validity of the results. Thus, it was necessary to resort to
other estimation methods, the FE and 2SLS estimators. In particular, to overcome the possible
existence of an omitted variables bias, equation (I) was also estimated through the FE estimator
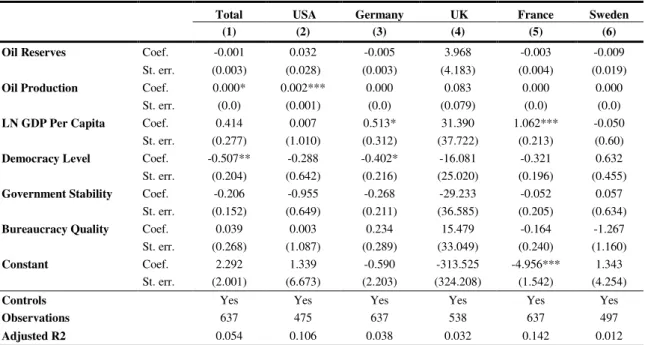
and the results are reported in the table V.
The FE results show that after controlling for omitted variables that may differ between oil
producing countries, but which are constant over time, the strategic use of foreign aid as a
mechanism to get preferential access to oil becomes the exception rather than the rule. In fact,
aid giving and once again only the current level of oil production seems to be considered.
Furthermore, contrarily to what was found with the OLS estimator, it seems that the process of
foreign aid giving does not take in consideration the level of poverty in the receiving country.
Finally, the conclusion regarding the reaming variables do not change as much from the one
achieved with the OLS estimator, being the variables government stability and bureaucracy
quality, the exception since none of them has any impact over the disbursements of foreign aid.
Table V. FE Regressions - Dependent Variable: Log of total Aid given in the form of Grants
Total USA Germany UK France Sweden
(1) (2) (3) (4) (5) (6)
Oil Reserves Coef. -0.001 0.032 -0.005 3.968 -0.003 -0.009 St. err. (0.003) (0.028) (0.003) (4.183) (0.004) (0.019)
Oil Production Coef. 0.000* 0.002*** 0.000 0.083 0.000 0.000
St. err. (0.0) (0.001) (0.0) (0.079) (0.0) (0.0)
LN GDP Per Capita Coef. 0.414 0.007 0.513* 31.390 1.062*** -0.050 St. err. (0.277) (1.010) (0.312) (37.722) (0.213) (0.60)
Democracy Level Coef. -0.507** -0.288 -0.402* -16.081 -0.321 0.632 St. err. (0.204) (0.642) (0.216) (25.020) (0.196) (0.455)
Government Stability Coef. -0.206 -0.955 -0.268 -29.233 -0.052 0.057 St. err. (0.152) (0.649) (0.211) (36.585) (0.205) (0.634)
Bureaucracy Quality Coef. 0.039 0.003 0.234 15.479 -0.164 -1.267 St. err. (0.268) (1.087) (0.289) (33.049) (0.240) (1.160)
Constant Coef. 2.292 1.339 -0.590 -313.525 -4.956*** 1.343 St. err. (2.001) (6.673) (2.203) (324.208) (1.542) (4.254)
Controls Yes Yes Yes Yes Yes Yes
Observations 637 475 637 538 637 497
Adjusted R2 0.054 0.106 0.038 0.032 0.142 0.012 Notes: Independent variables are described in detail in the previous section. Standard errors are robust standard errors. *significant at 10%, **significant at 5%, ***significant at 1%.
Despite the improvement achieved with FE estimator, there is an additional problem that
may undermine the OLS results, the simultaneous causality bias arising from the independent
variable oil production, as explained in section 3.2. Thus, oil production was instrumented by
the variable oil consumption times the variable exports of goods and services, as percentage of
GDP through the 2SLS estimator. The instrument is considered valid due to the following two
reasons: first, it seems reasonable to assume that oil consumption is not correlated with any
other regressors included in equations (I) and (II) nor the error term, yet, it is only possible to
correlated to the exports of goods and services, as percentage of GDP, a reasoning which can be
tested empirically by a result above 10, the threshold in the F-statistic test. Moreover, FE were
still considered to control for omitted variables that may differ between oil producing countries
but which are constant over time. Table VI reports the 2SLS results.
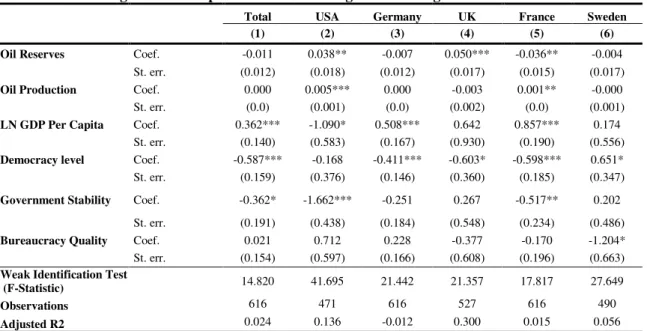
Table VI. 2SLS Regressions - Dependent Variable: Log of total Aid given in the form of Grants Total USA Germany UK France Sweden
(1) (2) (3) (4) (5) (6)
Oil Reserves Coef. -0.011 0.038** -0.007 0.050*** -0.036** -0.004 St. err. (0.012) (0.018) (0.012) (0.017) (0.015) (0.017)
Oil Production Coef. 0.000 0.005*** 0.000 -0.003 0.001** -0.000
St. err. (0.0) (0.001) (0.0) (0.002) (0.0) (0.001)
LN GDP Per Capita Coef. 0.362*** -1.090* 0.508*** 0.642 0.857*** 0.174 St. err. (0.140) (0.583) (0.167) (0.930) (0.190) (0.556)
Democracy level Coef. -0.587*** -0.168 -0.411*** -0.603* -0.598*** 0.651* St. err. (0.159) (0.376) (0.146) (0.360) (0.185) (0.347)
Government Stability Coef. -0.362* -1.662*** -0.251 0.267 -0.517** 0.202 St. err. (0.191) (0.438) (0.184) (0.548) (0.234) (0.486)
Bureaucracy Quality Coef. 0.021 0.712 0.228 -0.377 -0.170 -1.204* St. err. (0.154) (0.597) (0.166) (0.608) (0.196) (0.663)
Weak Identification Test
(F-Statistic) 14.820 41.695 21.442 21.357 17.817 27.649
Observations 616 471 616 527 616 490
Adjusted R2 0.024 0.136 -0.012 0.300 0.015 0.056 Notes: Independent variables are described in detail in the previous section. All regressions use as an instrument for the variable oil production, the world (for the total) or the country oil consumption times the exports of goods and services, as percentage of GDP, of all oil producing countries. Standard errors are robust standard errors. *significant at 10%, **significant at 5%, ***significant at 1%.
The 2SLS results are between the ones found through the OLS and the FE estimators, in the
sense that half of the six geographical entities under analysis – the 44 donors as a whole, Germany and Sweden – do not guide their foreign aid policy as a strategic mechanism to get preferential access to oil; while the remaining three – USA, UK and France – guide their foreign aid policy in that strategic manner. Concerning only the three donors which do in fact drive their
foreign aid disbursements in order to get preferential access to oil, three additional features
should be highlighted. First, the USA case which directs its foreign aid policy to guarantee
immediate and future access to foreign oil. Second the case of the UK which is only concerned
with its future level of oil dependence. Third the particular case of France, a country which aid
future oil production. Finally, the conclusions regarding the reaming variables do not change as
much from the one achieved with the FE estimator.
FDI Results
Table VII reports the results obtained through the OLS estimation of equation (II) and it is
possible to conclude that FDI flows are attracted by the existence of oil in the investment
hosting country. Though, a closer look at this result shows that the current level of oil
production is much more important in determining the location of future investments then the
level of future oil production, which is given as proxy by the independent variable oil reverses.
In fact, a rise in the level of future oil production is associated with a reduction in the amount of
FDI flows.
Additionally, the OLS results allow the conclusion that the more democratic a country is, the
higher will be the amount of FDI that it will receive. Nevertheless, the same is not true
regarding the existence of solid socioeconomic conditions and a well-functioning judicial
system in the investment hosting country.
Table VII. OLS Regressions - Dependent Variable: Log of total FDI outward flows
Total USA Germany UK France Sweden (1) (2) (3) (4) (5) (6) Oil Reserves Coef. -0.023*** -4.637 -0.020*** -0.014*** -0.021*** -0.017***
St. err. (0.004) (12.427) (0.002) (0.003) (0.003) (0.003)
Oil Production Coef. 0.001*** 0.395 0.001*** 0.000*** 0.001*** 0.000***
St. err. (0.0) (0.268) (0.0) (0.0) (0.0) (0.0)
Democracy Level Coef. 0.322 2.324.922*** 1.095*** 1.958*** 0.777*** 3.444*** St. err. (0.532) (442.263) (0.285) (0.395) (0.298) (0.548)
Socioeconomic
Conditions Coef. 2.109*** 5.364.748*** 0.364 1.079** -0.281 2.380***
St. err. (0.758) (1476.213) (0.411) (0.473) (0.467) (0.692)
Law and Order Coef. 2.399*** 1.570.416** 2.143*** 0.532 2.030*** 1.347** St. err. (0.552) (664.281) (0.269) (0.352) (0.354) (0.537)
Constant Coef. 5.232*** -4.206.650*** 1.025*** 2.465*** 1.884*** -2.032*** St. err. (0.425) (963.471) (0.236) (0.355) (0.271) (0.380)
Controls Yes Yes Yes Yes Yes Yes
Observations 858 508 796 424 718 388
Adjusted R2 0.176 0.136 0.330 0.270 0.261 0.437 Notes: Independent variables are described in detail in the previous section. Standard errors are robust standard errors. *significant at 10%, **significant at 5%, ***significant at 1%.
Once again, the OLS estimator may not be able to address an omitted variable bias which
would undermine the validity of the results. Consequently equation (II) was also estimated
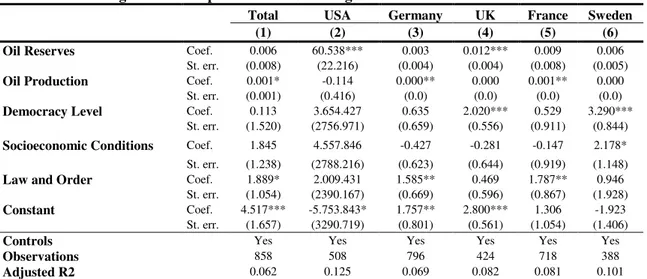
Table VIII. FE Regressions - Dependent Variable: Log of total FDI outward flows
Total USA Germany UK France Sweden
(1) (2) (3) (4) (5) (6)
Oil Reserves Coef. 0.006 60.538*** 0.003 0.012*** 0.009 0.006
St. err. (0.008) (22.216) (0.004) (0.004) (0.008) (0.005)
Oil Production Coef. 0.001* -0.114 0.000** 0.000 0.001** 0.000
St. err. (0.001) (0.416) (0.0) (0.0) (0.0) (0.0)
Democracy Level Coef. 0.113 3.654.427 0.635 2.020*** 0.529 3.290***
St. err. (1.520) (2756.971) (0.659) (0.556) (0.911) (0.844)
Socioeconomic Conditions Coef. 1.845 4.557.846 -0.427 -0.281 -0.147 2.178* St. err. (1.238) (2788.216) (0.623) (0.644) (0.919) (1.148)
Law and Order Coef. 1.889* 2.009.431 1.585** 0.469 1.787** 0.946
St. err. (1.054) (2390.167) (0.669) (0.596) (0.867) (1.928)
Constant Coef. 4.517*** -5.753.843* 1.757** 2.800*** 1.306 -1.923
St. err. (1.657) (3290.719) (0.801) (0.561) (1.054) (1.406)
Controls Yes Yes Yes Yes Yes Yes
Observations 858 508 796 424 718 388
Adjusted R2 0.062 0.125 0.069 0.082 0.081 0.101
Notes: Independent variables are described in detail in the previous section. Standard errors are robust standard errors. *significant at 10%, **significant at 5%, ***significant at 1%.
Table VIII shows that after controlling for omitted variables that may differ between oil
producing countries but which are constant over time, oil still matters as a determinant of FDI.
However, now both the current and the future level of oil production, given as proxy by the
independent variable oil reverses, are important for the attractiveness of FDI. In addition, it is
noteworthy to highlight that for the six geographical entities there is no single case in which
both the current and future levels of oil production matter at the same time for the determination
of future investment projects. Indeed, for some of them as the UK, only the current level of oil
production influences the allocation of FDI, while for others as the USA only the future level of
oil production is relevant. The conclusions regarding the reaming variables do not change as
much from the onesachieved with the OLS estimator.
Despite the improvement achieved with the FE estimator, it was necessary to address the
possible existence of a simultaneous causality bias. As explained above, the solution was to
resort to the 2SLS estimator with FE and the results are reported in table IX.
The major difference between the 2SLS results and the previous ones is the fact that
democracy does not matter for the allocation of FDI flows. Also, the interpretation of the oil
conditions and a well-functioning judicial system seem to be important in attracting FDI, though
only for the case of France and for the aggregate.
Table IX. 2SLS Regressions - Dependent Variable: Log of total FDI outward flows
Total USA UK Germany France Sweden
(1) (2) (3) (4) (5) (6)
Oil Reserves Coef. -0.132*** -0.034** -0.020* -0.048** -0.047*** -0.045** St. err. (0.041) (0.013) (0.011) (0.020) (0.016) (0.019)
Oil Production Coef. 0.010*** 0.003*** 0.003*** 0.005*** 0.004*** 0.004*** St. err. (0.001) (0.001) (0.001) (0.002) (0.001) (0.001)
Democracy level Coef. -0.738 0.318 0.271 -0.873 0.170 -0.217 St. err. (1.166) (0.776) (0.782) (1.820) (0.527) (0.591)
Socioeconomic Conditions Coef. -0.203 -0.532 -0.960 0.149 -1.161* -1.014 St. err. (1.364) (0.813) (0.706) (1.639) (0.613) (0.721)
Law & Order Coef. -4.015*** 0.714 -0.596 -1.307 -0.621 -0.394 St. err. (1.104) (0.535) (0.570) (1.014) (0.509) (0.583)
Weak Indentification Test (F-Statistic) 64.481 24.161 17.399 17.619 49.293 44.406
Observations 809 497 422 386 750 697
Adjusted R2 -2.093 -1.362 -1.23 -2.511 -1.276 -1.163 Notes: Independent variables are described in detail in the previous section. All regressions use as an instrument for the variable oil production, the world (for the total) or the country oil consumption times the exports of goods and services, as percentage of GDP, of all oil producing countries. Standard errors are robust standard errors. *significant at 10%, **significant at 5%, ***significant at 1%.
5. Conclusion
In light of the previous literature, which has uncovered that one of the key factors behind
foreign aid giving is the strategic interest of donors; this paper addressed a particular feature of
this strategic behavior: the usage of foreign aid to get preferential access to one of the most
important raw materials in the world, crude oil. Hence, one of the main questions posed by this
paper was the following: is the increased competition for getting access to oil translated into the
patterns of foreign aid giving?
Indeed, being oil a fundamental input for the well-functioning of any economy, a priori it
was suspected that a rise in the amount of oil reserves and/or a rise in oil production would lead
to an increase in the amount of foreign aid given by the donors analyzed in this paper.
Nevertheless, the results achieved through the estimation of equation (I) do not show a clear
pattern to support this conclusion. In reality, of the six geographical entities considered, only the
former USA president George W. Bush said: “It is clear our nation is reliant upon big foreign
oil. More and more of our imports come from overseas.”Thus, it seems that the USA is doing
everything in itspower to get access to the needed and desired foreign oil, including driving its
foreign aid policy to oil producing countries. At the other end is Sweden, which guides its
foreign aid policy disregarding the existence of oil in the aid receiving countries. Another
noteworthy result was that France´s aid disbursements respond positively to a rise in the amount
of current oil production, but negatively to a rise in the future level of oil production, which was
given as proxy by the variable oil reserves, a result that may constitute the basis of a future
research regarding its causes and consequences. Also, contrarily to Alesina and Dollar (2000)
the pattern of France´s aid disbursements does not seem to be much different from the other 5
geographical entities considered and only Sweden rewards the democratization process.
Additionally, the majority of donors are favoring oil production instead of the quality of
institutions, such as the existence of a well-functioning bureaucratic system, thus it seems that
international donors are not concerned with the possible existence of a resource curse in the aid
receiving countries.
Furthermore, this paper was also devoted to study the link between FDI and oil. Indeed, it
was supposed that a rise in oil reverses and/or production would be translated into a rise in the
amount of FDI outward flows. Though the results obtained through the estimation of equation
(II) were striking: an increase in the current level of oil production leads to a rise in FDI flows
while the same does not apply to a rise in the future level of oil production, which was given as
proxy by the variable oil reserves. Actually, a rise in the amount of oil reserves leads to a
reduction in the amount of FDI outward flows; a counterintuitive result for which future
research is needed in order to understand the rationale behind it. Moreover, Alesina and Dollar
FDI and that what matters is the rule of law and the socioeconomic conditions in place, yet, the
results obtained in this paper only substantiate the result regarding the democratic level.
Finally, future research is needed to complement this paper. In particular, a study to analyze
if the use of foreign aid as a strategic mechanism to get priority access to oil was translated into
more favorable agreements for oil prospection and exploitation for the donors which have
increased their aid disbursements to oil producing countries.
References:
Acemoglu, Daron, Simon Johnson, and James A. Robinson. 2003. "An African Success Story: Botswana.”In Search of Prosperity: Analytic Narratives on Economic Growth, ed. Dani Rodrik, 80-119.Princeton: Princeton University Press.
Alesina, Alberto, and David Dollar.2000. “Who Gives Foreign Aid to Whom and Why?” Journal of Economic Growth, 5(1): 33-63.
Anyanwu, John C. 2011.“Determinants of Foreign Direct Investment Inflows to Africa, 1980-2007.” African Development Bank GroupWorking Paper 136.
BP Statistical Review of World Energy June 2012 – www.bp.com/statisticalreview (accessed January 7, 2013).
Burnside, Craig, and David Dollar. 2000. “Aid, Policies, and Growth.” American Economic Review, 90(4): 847-868.
Corden, W. Max, and J. Peter Neary. 1982. "Booming Sector and De-Industrialisation in
a Small Open Economy." The Economic Journal, 92(368): 825-48.
De Mooij, Ruud A., and Sjef Ederveen. 2003. "Taxation and foreign direct investment: a
synthesis of empirical research." International Tax and Public Finance, 10(6): 673-693.
Development Assistance Committee (OCDE) – www.oecd.org/dac/stats/data (accessed January 7, 2013).
Dudley, Leonard, and Claude Montmarquette. 1976. “A Model of the Supply of
Bilateral Foreign Aid.” American Economic Review, 66(1): 132-142.
Froot, Kenneth A., and Jeremy C. Stein. 1991. “Exchange rates and foreign direct
investment: an imperfect capital markets approach.”The Quarterly Journal of Economics, 106(4): 1191-1217.
Gates, Scot, and Anke Hoeffler. 2004. “Global Aid Allocation: Are Nordic Donors Different?” Centre for the Study of African EconomiesWorking Paper Series 234.
Heckman, James J. 1979. “Sample Selection Bias as a Specification Error.” Econometrica, 47(1): 153-161.
Maizels, Alfred, and Machiko K. Nissanke. 1984. “Motivations for Aid to Developing
Countries.” World Development, 12(9): 879-900.
Mehlum, Halvor, Karl Moene, and Ragnar Torvik. 2006. "Institutions and the Resource Curse." The Economic Journal, 116(508): 1-20.
Political Risk Group Services (International Country Risk Guide)
-http://www.prsgroup.com/prsgroup_shoppingcart/cdwizard5.aspx (accessed January 7, 2013).
Polity IV Project – http://www.systemicpeace.org/inscr/inscr.htm (accessed January 7, 2013).
Prebisch, Raúl. 1950. “The economic development of Latin America and its principal
problems.” Economic Bulletin for Latin America, 7: 1-12.
Sachs, Jeffrey D., and Andrew M. Warner. 1995. "Natural Resource Abundance and
Economic Growth." NBER Working Paper 5398.
Singer, Hans.1950. “Comments to the terms of trade and economic development.” Review of Economics and Statistics, 40: 84-89.
Swenson, Deborah L.1994 “The Impact of U.S. Tax Reform on Foreign Direct Investment
in the United States.” Journal of Public Economics, 54(2): 243-66.
Tsui, Kevin K. 2011. "More Oil, Less Democracy: Evidence from Worldwide Crude
Oil Discoveries." Economic Journal, 121(551): 89-115.
Vicente, Pedro C. 2010. "Does Oil Corrupt? Evidence from a Natural Experiment in
West Africa." Journal of Development Economics, 92(1): 28-38.
Wooldridge, Jeffrey M. 2005. Introductory Econometrics: A Modern Approach. Toronto: Momper, Steven.
A Work Project, presented as part of the requirements for the Award of a Masters
Degree in Economics from the NOVA – School of Business and Economics.
Oil, Foreign Aid and FDI Flows:
The Missing Link?
Appendices
Duarte Jorge Portela Ricardo # 514
A Project carried out under the supervision of: Pedro Vicente
Appendix 1.
The list of the 44 donor countries included in the data set build for this paper is presented in
the following table.
Table X. List of the 44 donor countries
Variable Code Definition
Australia Grants AUSGrants Australia´s Grants (mill. constant 2010 $)
Austria Grants AUTGrants Austria´s Grants (mill. constant 2010 $)
Belgium Grants BELGrants Belgium´s Grants (mill. constant 2010 $)
Canada Grants CANGrants Canada´s Grants (mill. constant 2010 $)
Chinese Taipei Grants TWNGrants Chinese Taipei´s Grants (mill. constant 2010 $)
Cyprus Grants Grants CYPGrants Cyprus´s Grants (mill. constant 2010 $)
Czech Republic Grants CZEGrants Czech Republic ´s Grants (mill. constant 2010 $)
Denmark Grants DNKGrants Denmark´s Grants (mill. constant 2010 $)
Estonia Grants ESTGrants Estonia´s Grants (mill. constant 2010 $)
Finland Grants FINGrants Finland´s Grants (mill. constant 2010 $)
France Grants FRAGrants France´s Grants (mill. constant 2010 $)
Germany Grants DEUGrants Germany´s Grants (mill. constant 2010 $)
Greece Grants GRCGrants Greece´s Grants (mill. constant 2010 $)
Hungary Grants HUNGrants Hungary´s Grants (mill. constant 2010 $)
Iceland Grants ISLGrants Iceland´s Grants (mill. constant 2010 $)
Ireland Grants IRLGrants Ireland´s Grants (mill. constant 2010 $)
Israel Grants ISRGrants Israel´s Grants (mill. constant 2010 $)
Italy Grants ITAGrants Italy´s Grants (mill. constant 2010 $)
Japan Grants JPNGrants Japan´s Grants (mill. constant 2010 $)
South Korea Grants KOREA-NSGrants South Korea´s Grants (mill. constant 2010 $)
Kuwait Grants KWTGrants Kuwait´s Grants (mill. constant 2010 $)
Latvia Grants LVAGrants Latvia´s Grants (mill. constant 2010 $)
Liechtenstein Grants LIEGrants Liechtenstein´s Grants (mill. constant 2010 $)
Lithuania Grants LTUGrants Lithuania´s Grants (mill. constant 2010 $)
Luxembourg Grants LUXGrants Luxembourg´s Grants (mill. constant 2010 $)
Malta Grants MLTGrants Malta´s Grants (mill. constant 2010 $)
Netherlands Grants NLDGrants Netherlands´s Grants (mill. constant 2010 $)
New Zeland Grants NZLGrants New Zeland´s Grants (mill. constant 2010 $)
Norway Grants NORGrants Norway´s Grants (mill. constant 2010 $)
Poland Grants POLGrants Poland´s Grants (mill. constant 2010 $)
Portugal Grants PRTGrants Portugal´s Grants (mill. constant 2010 $)
Romania Grants ROUGrants Romania´s Grants (mill. constant 2010 $)
Russia Grants RUSGrants Russia´s Grants (mill. constant 2010 $)
Saudi Arabia Grants SAUGrants Saudi Arabia´s Grants (mill. constant 2010 $)
Slovak Republic Grants SVKGrants Slovak Republic´s Grants (mill. constant 2010 $)
Spain Grants ESPGrants Spain´s Grants (mill. constant 2010 $)
Sweden Grants SWEGrants Sweden´s Grants (mill. constant 2010 $)
Switzerland Grants CHEGrants Switzerland´s Grants (mill. constant 2010 $)
Thailand Grants THAGrants Thailand´s Grants (mill. constant 2010 $)
Turkey Grants TURGrants Turkey´s Grants (mill. constant 2010 $)
United Arab Emirates Grants AREGrants United Arab Emirates´s Grants (mill. constant 2010 $)
United Kingdom Grants GBRGrants United Kingdom´s Grants (mill. constant 2010 $)
United States of America Grants USAGrants United States of America´s Grants (mill. constant 2010 $) Note: The source of all these variables is the Development Assistance Committee of the Organisation for Cooperation and Development Economy (2012).
Appendix 2.
The list of the 34 investing countries included in the data set build for this paper is presented
in the following table.
Table XI. List of the 34 investing countries
Variable Code Definition
Australia FDI AUSFDI Australia´s FDI outward flows (millions $)
Austria FDI AUTFDI Austria´s FDI outward flows (millions $)
Belgium FDI BELFDI Belgium´s FDI outward flows (millions $)
Canada FDI CANFDI Canada´s FDI outward flows (millions $)
Chile FDI CHLFDI Chile´s FDI outward flows (millions $)
Czech Republic FDI CZEFDI Czech Republic´s FDI outward flows (millions $)
Denmark FDI DNKFDI Denmark´s FDI outward flows (millions $)
Estonia FDI ESTFDI Estonia´s FDI outward flows (millions $)
Finland FDI FINFDI Finland´s FDI outward flows (millions $)
France FDI FRAFDI France´s FDI outward flows (millions $)
Germany FDI DEUFDI Germany´s FDI outward flows (millions $)
Greece FDI GRCFDI Greece´s FDI outward flows (millions $)
Hungary FDI HUNFDI Hungary´s FDI outward flows (millions $)
Iceland FDI ISLFDI Iceland´s FDI outward flows (millions $)
Ireland FDI IRLFDI Ireland´s FDI outward flows (millions $)
Israel FDI ISRFDI Israel´s FDI outward flows (millions $)
Italy FDI ITAFDI Italy´s FDI outward flows (millions $)
Japan FDI JPNFDI Japan´s FDI outward flows (millions $)
South Korea FDI KOREA-NSFDI South Korea´s FDI outward flows (millions $)
Luxembourg FDI LUXFDI Luxembourg´s FDI outward flows (millions $)
Mexico FDI MEXFDI Mexico´s FDI outward flows (millions $)
Netherlands FDI NLDFDI Netherlands´s FDI outward flows (millions $)
New Zeland FDI NZLFDI New Zeland´s FDI outward flows (millions $)
Norway FDI NORFDI Norway´s FDI outward flows (millions $)
Poland FDI POLFDI Poland´s FDI outward flows (millions $)
Slovak Republic FDI SVKFDI Slovak Republic´s FDI outward flows (millions $)
Slovenia FDI SVNFDI Slovenia´s FDI outward flows (millions $)
Spain FDI ESPFDI Spain´s FDI outward flows (millions $)
Sweden FDI SWEFDI Sweden´s FDI outward flows (millions $)
Switzerland FDI CHEFDI Switzerland´s FDI outward flows (millions $)
Turkey FDI TURFDI Turkey´s FDI outward flows (millions $)
United Kingdom FDI GBRFDI United Kingdom´s FDI outward flows (millions $)
United States of America USAFDI United States of America ´s FDI outward flows (millions $) Note: The source of all these variables is the Organisation for Cooperation and Development Economy (2012).
Appendix 3.
The list of the 48 oil producing countries included in the data set build for this paper is
presented in the following table.
Table XII. List of the 48 oil producing countries
Variable Code Definition
Algeria DZAOilP. Algeria´s oil production (thousand million barrels)
Angola AGOOilP. Angola´s oil production (thousand million barrels)
Argentina ARGOilP. Argentina´s oil production (thousand million barrels)
Australia AUSOilP. Australia´s oil production (thousand million barrels)
Azerbaijan AZEOilP. Azerbaijan´s oil production (thousand million barrels)
Brazil BRAOilP. Brazil´s oil production (thousand million barrels)
Brunei Darussalam BRNOilP. Brunei Darussalam´s oil production (thousand million barrels)
Canada CANOilP. Canada´s oil production (thousand million barrels)
Chad TCDOilP. Chad´s oil production (thousand million barrels)
China CHNOilP. China´s oil production (thousand million barrels)
Colombia COLOilP. Colombia´s oil production (thousand million barrels)
Denmark DNKOilP. Denmark´s oil production (thousand million barrels)
Ecuador ECUOilP. Ecuador´s oil production (thousand million barrels)
Egypt EGYOilP. Egypt´s oil production (thousand million barrels)
Equatorial Guinea GNQOilP. Equatorial Guinea´s oil production (thousand million barrels)
Gabon GABOilP. Gabon´s oil production (thousand million barrels)
India INDOilP. India´s oil production (thousand million barrels)
Indonesia IDNOilP. Indonesia´s oil production (thousand million barrels)
Iran IRNOilP. Iran´s oil production (thousand million barrels)
Iraq IRQOilP. Iraq´s oil production (thousand million barrels)
Italy ITAOilP. Italy´s oil production (thousand million barrels)
Kazakhstan KAZOilP. Kazakhstan´s oil production (thousand million barrels)
Kuwait KWTOilP. Kuwait´s oil production (thousand million barrels)
Libya LBYOilP. Libya´s oil production (thousand million barrels)
Malaysia MYSOilP. Malasyia´s oil production (thousand million barrels)
Mexico MEXOilP. Mexico´s oil production (thousand million barrels)
Norway NOROilP. Norway´s oil production (thousand million barrels)
Oman OMNOilP. Oman´s oil production (thousand million barrels)
Peru PEROilP. Peru´s oil production (thousand million barrels)
Qatar QATOilP. Qatar´s oil production (thousand million barrels)
Republic of Congo COGOilP. Republic of Congo´s oil production (thousand million barrels)
Romania ROUOilP. Romania´s oil production (thousand million barrels)
Russia RUSOilP. Russia´s oil production (thousand million barrels)
Saudi Arabia SAUOilP. Saudi Arabia´s oil production (thousand million barrels)
Sudan SDNOilP. Sudan´s oil production (thousand million barrels)
Syria SYROilP. Syria´s oil production (thousand million barrels)
Thailand THAOilP. Thailand´s oil production (thousand million barrels)
Trinidad & Tobago TTOOilP. Trinidad & Tobago´s oil production (thousand million barrels)
Tunisia TUNOilP. Tunisia´s oil production (thousand million barrels)
Turkmenistan TKMOilP. Turkmenistan´s oil production (thousand million barrels)
United Arab Emirates AREOilP. United Arab Emirates´s oil production (thousand million barrels)
United Kingdom GBROilP. United Kingdom´s oil production (thousand million barrels)
United States of America USAOilP. United States of America´s oil production (thousand million barrels)
Uzbekistan UZBOilP. Uzbekistan´s oil production (thousand million barrels)
Venezuela VENOilP. Venezuela´s oil production (thousand million barrels)
Vietnam VNMOilP. Vietnam´s oil production (thousand million barrels)
Yemen YEMOilP. Yemen´s oil production (thousand million barrels) Note: The source of all these variables is the BP Statistical Review of World Energy June 2012.
Appendix 4.
The list of the 48 countries with proven oil reserves included in the data set build for this
paper is presented in the following table.
Table XIII. List of the 48 countries with proven oil reserves
Variable Code Definition
Algeria DZAOilR. Algeria´s proven reserves of oil (thousand million barrels)
Angola AGOOilR. Angola´s proven reserves of oil (thousand million barrels)
Argentina ARGOilR. Argentina´s proven reserves of oil (thousand million barrels)
Australia AUSOilR. Australia´s proven reserves of oil (thousand million barrels)
Azerbaijan AZEOilR. Azerbaijan´s proven reserves of oil (thousand million barrels)
Brazil BRAOilR. Brazil´s proven reserves of oil (thousand million barrels)
Brunei Darussalam BRNOilR. Brunei Darussalam´s proven reserves of oil (thousand million barrels)
Canada CANOilR. Canada´s proven reserves of oil (thousand million barrels)
Chad TCDOilR. Chad´s proven reserves of oil (thousand million barrels)
China CHNOilR. China´s proven reserves of oil (thousand million barrels)
Colombia COLOilR. Colombia´s proven reserves of oil (thousand million barrels)
Denmark DNKOilR. Denmark´s proven reserves of oil (thousand million barrels)
Ecuador ECUOilR. Ecuador´s proven reserves of oil (thousand million barrels)