A Work Project, presented as part of the requirements for the Award of a Master Degree in Finance from the NOVA – School of Business and Economics.
Economic and Financial Performance Model for Private
Social Solidarity Institutions
Pedro Miguel Correia Robalo
# 2341
A Project carried out on the Master in Finance Program, under the supervision of: Prof. Fábio Santos
2
Abstract
The main goal of this work project is to build a model which would allow the user to evaluate the economic and financial performance of Private Social Solidarity Institutions, a particular group of the not-for-profit organizations. The model is composed by a quantitative and qualitative part and provides an output in the form of a score (between O1 and O5) aiming, not to measure the default risk, but to evaluate the financial health and sustainability of these organizations.
Key words: IPSS, not-for-profit, financial performance, scoring
List of Abbreviations
BPI – Banco Português de Investimento;
CIRIEC – Centre International de Recherches et d'Information sur l'Economie
Publique, Sociale et Coopérative, the French expression for International Centre of
Research and Information on Public, Social and Cooperative Economy; DRC – Direção de Riscos de Crédito;
EBITDA – Earnings before interests, taxes, depreciations and amortizations; GVA – Gross Value Added;
IPSS – Instituição Particular de Solidariedade Social, the Portuguese expression for Private Social Solidarity Institutions;
3
Table of Contents
1. Purpose of the Project ... 4
2. Literature Review ... 4
3. Industry Overview... 7
3.1. Social Economy ... 7
3.2. Private Social Solidarity Institutions in Portugal ... 9
3.3. Accounting Specifications ... 10 4. Methodology ... 11 4.1. Quantitative Part ... 12 4.1.1. Ratios ... 12 a) Liquidity ratios: ... 14 b) Solvency ratios: ... 14 c) Profitability ratios: ... 15 d) Activity ratios: ... 16 4.1.2. Score Grids ... 17 4.2 Qualitative Part ... 20 4.3. Weight Assignment ... 22
5. Conclusions and Recommendations ... 24
7. References ... 27
4
1. Purpose of the Project
This work project was done in cooperation with Banco Português de Investimento (BPI), which is one of the biggest private banks in Portugal, in the Credit Risk Department (DRC), in the area in charge of the non-governmental and governmental organizations. This way, it was possible to have access a BPI’s electronic file to collect accounting data about the organizations (publicly available data) but also to have in mind the different models, that the bank uses to evaluate other companies’ default risk, as benchmark. The model will be used by BPI’s team to assess these organizations’ health, but it can also be used by other existing stakeholders to monitor an organization’s situation, such as possible donators to make decisions regarding their willingness to make donations to an organization or even by the organization itself as a helping tool for managing decisions. Regardless of the collaboration with BPI, the methodology and conclusions made in this work project are the sole responsibility of the author.
2. Literature Review
The financial performance appraisal of non-profits is a theme which does not yet have a vast scientific workload, despite the importance of the sector. Likewise, at an institutional level, there are no models to evaluate the financial performance, for neither stakeholders nor the organizations themselves.
Indeed, the idea that this analysis is in fact very important has been growing and the reasons for that importance can be divided into external and internal reasons.
For external reasons, Bray (2010) suggests that the people who finance these organizations, are increasingly more concerned with having access to financial and operational information in order to make sure that their investments are producing the expected effect. Moreover, such an analysis and the communication of its results to the
5
investors demonstrates a greater credibility (Sontag-Padilla et al, 2012) and it can also influence the “public attitudes” (Larsson and Kinnunen, 2008).
On the other hand, it is important because it is helpful in the planning process and it is also important in order to adjust in previous plans and “to reach a better understanding of the organization’s success and failures” (Larsson and Kinnunen, 2008). One of the biggest challenges for a not-for-profit organization is to balance between the organization’s mission and its financial sustainability. The financial sustainability is very important for this kind of institutions because these ones usually “serve high-needed communities” and, therefore, they need to be capable to maintain their services available in the long term (Sontag-Padilla et al, 2012) making it important to evaluate their financial performance together with the fulfilment of their mission.
In order to make such an analysis, many suggested that the use of financial ratios could be as useful for the nonprofits as it has been for the corporate world. The ratio analysis allows a better perception in turn of the financial condition than the “data standing alone”. Consequently, it is possible to make comparisons within different organizations (since it withdraws “the effects of size differences”), comparisons with national averages and to make multi-year analysis to observe tendencies (Chabotar, 1989). Abraham (2004) states that the measurement of the financial performance through the use of ratios allows the organization to identify its strengths and weaknesses by “detecting financial anomalies and focusing attention on issues of organizational importance”. It is a more efficient method to analyze data, making it more observable and easier to identify relationships between its variables. “Each ratio is designed to detect a certain type of symptom in relation to the underlying state of health of the organisation, with a collection of symptoms suggesting an appropriate treatment plan.”
6
However, the use of ratios has its own drawbacks. The ratios are computed with a unique focus on specific areas isolated form the rest of the organization. Thus, when analysing the ratios, it is important to take into account qualitative factors which are not included in the ratios, such as: “economic conditions”, specific characteristics of the non-profit sector or even historical and cultural evolution (A. Abraham, 2004). Similarly, Chabotar (1989) states that “By itself, a ratio almost never provides sufficient evidence for panic or pride” and that there are many other factors which need to be considered that cannot be measured, such as “leadership, reputation, community support”. Additionally, one needs to be careful when examining the ratios (because “few standards exist and those that do may not be relevant”) and national averages (despite that sometimes they can be good benchmarks, they can also reflect undesirable “financial conditions”).
According to Turk et al (1995) the operational and financial analysis is linked with the organization’s mission. This way, they used the following question as the key point for a financial analysis: “What is the organisation’s mission?”. The analysis they propose is based on four other questions that seek to understand the relationship between certain factors such as the origin and uses of resources and its mission, allowing an appropriate analysis of past performance, helping to project future direction. Abraham (2004) emphasizes that since the mission is the primary reason for the existence of any nonprofit, it is appropriate to analyze financial resources according to their relation to the mission. Additionally, Moody’s (a North American rating agency) launched, in December of 2013, a preliminary (“Request for Comment”) credit risk analysis model for not-for-profit organizations (excluding healthcare and educational organizations). This model is composed by two parts: a quantitative component with three different factors (“Market Position”, “Operating Performance” and “Balance Sheet and Capital Investment”) and a qualitative component also with three factors (“Governance and Management”, “Legal
7
Security and Debt Structure” and “Other Credit Specific Considerations”). Both the quantitative and the qualitative factors are composed by multiple indicators.
The rating is computed based on the score it is attributed to each of the quantitative indicators and on the weights attributed to all of them. Afterwards, this “rating outcome” is adjusted according to the impact (negative, positive or neutral) of the qualitative “on the not-for-profit’s credit profile” which “can account for multiple notch differential”.
3. Industry Overview
3.1. Social Economy
The concept of Social Economy (Third Sector, Social Sector, among others) is a concept which has been subject of constant changes, both in time and among different geographies, and a big effort has been made to standardize such concept.
According to the “Handbook on Non-Profit Institutions in the System of National Accounts” from the United Nations, the concept of Social Economy “is used widely in Europe to depict non-governmental institutions that have a social or collective purpose. Typically, three and often four sets of institutions are included in the social economy: mutuals, cooperatives, associations and foundations”.
Moreover, the report “The Social Economy in the European Union” made by the CIRIEC proposes the following definition for Social Economy:
“The set of private, formally-organised enterprises, with autonomy of decision and freedom of membership, created to meet their members’ needs through the market by producing goods and providing services, insurance and finance, where decision-making and any distribution of profits or surpluses among the members are not directly linked to the capital or fees contributed by each member, each of whom has one vote, or at all events take place through democratic and participative decision-making processes. The social economy also includes private, formally organised organizations with autonomy of
8
decision and freedom of membership that produce non-market services for households and whose surpluses, if any, cannot be appropriated by the economic agents that create, control or finance them”
According to the Portuguese Social Economy Basis law (Lei nº 30/2013, de 8 de Maio), Social Economy is the set of economic and social activities, aiming to the persecution of the general interest of society, either directly or through fulfilment of its members, users or beneficiaries’ interests, when socially relevant. The organizations must be autonomous; have primacy for people and social goals; have freedom in their adhesion and participation; their members should have democratic control over the board; there must be a conciliation between beneficiaries’, members’ and general interests; respect values as solidarity, equality, non-discrimination of the social cohesion, justice, transparency, individual responsibility and subsidiarity; have autonomous management and independency from public authorities or other entities not related to the social economy; allocate the surpluses to the pursuit of social economy entities’ goals in accordance with the general interest, without prejudice to the specificity of the surpluses’ distribution, proper to the nature and substrate of each entity of the social economy. In Portugal, the social economy is composed by the following entities, once covered by the Portuguese legal system (Lei nº 30/2013, de 8 de Maio): cooperatives; mutual associations; misericórdias (Portuguese organizations whose mission is based on the 14 acts of mercy1); foundations; other Private Social Solidarity Institutions; altruistic
associations in areas such as culture, recreational, sports and local development; entities covered by the Community and self-managed subsectors, integrated under the Constitution in the cooperative and social sector; other entities with legal personality which follow the values listed above.
1 The definition can be found on the website of the União das Misericórdias Portuguesas:
9
The social economy is already a sector with a big dimension and meaningfulness in the Portuguese economy. It is composed by 55 386 entities spread by multiple distinct activities such as Culture, sports and recreation (48.4%), Cults and other religious bodies (15.8%), social action (14.0%), among others.
Moreover, according to the results of the “Conta Satélite da Economia Social”, for the year of 2010, this sector represented approximately 2.8% of the Gross Value Added (GVA) of the Portuguese economy, being bigger than other important sectors such as electricity, gas, steam and cold air; agriculture, forestry and fishery and even telecommunications. Regarding the paid employment, it used to represent about 5.5% of the total employment of the country, having a bigger weight than the healthcare sector, textile industry, transport and storage, among others (consult Appendix A to a more detailed information regarding the relative importance of the Social Economy).
3.2. Private Social Solidarity Institutions in Portugal
Private Social Solidarity Institutions (IPSS) are, by definition, private legal person (not under government or other public entities’ management), non-profit oriented, constituted by individuals, aiming to give organized expression to the moral duty of justice and solidarity, contributing to the realization of citizens' social rights (art. º 1.º do Decreto-Lei n. º 172-A/2014, de 14 de Novembro).
In order to meet the main goal described above and according to the same law decree, IPSS should operate through the supply of goods or services that allows the improvement of the welfare of the communities, families or people, placing themselves in, at least, one of the following categories: childhood and youth support, family support, support for the elderly people, support for people with disabilities, social integration support, support for the most fragile citizens, healthcare services, education and professional training, housing problem solving or other which appreciate the citizen’s social rights.
10
These different categories can be materialized through several social activities. The scope of these activities can be very wide such as educational services (day care, preschool) social services (social canteen, home support service, street team for homeless people, day centre) or even healthcare services (rehab centres, psychological care centres).The document “Guia Prático – Constituição de Instituições de Solidariedade Social” form the Portuguese Social Security Institute presents a full sorting of many social services among the different categories (presented previously).
An IPSS is a statute, is not a legal form of incorporation of a legal person. Therefore, an IPSS can take two distinct forms, either they assume the form of an association (social solidarity associations, mutual associations and misericórdias), or they assume the form of a foundation (social solidarity foundations, parish centres and other institutions created by the Catholic Church’s or other religions’ entities). These may also be grouped into Unions, Federations or Confederations. Moreover, there are other kinds of institutions to which an equalization to an IPSS can be attributed, like cooperatives and people’s houses. By the year of 2010, according to the “Conta Satélite da Economia Social” there were 5 022 IPSS, representing about 9% of Social Economy´s organizations, 50% of the sector’s GVA and 63.4% its paid employment. The associations and other organizations is by far the biggest type of organizations in the Social Economy. Refer to Appendix A for the distribution by types of organization and by areas of activity.
3.3. Accounting Specifications
Although the financial statements follow the rules of the national account system, the sector has several important differences in comparison with the corporate world. First of all, on social economy there are not organization’s owners and so, instead of term equity, the term used is net assets (since it is equal to the total of assets less liabilities) and it presents the following differences according to the Portuguese accounting system: there
11
is no shareholders’ equity; it can have technical surpluses (only for mutual associations); it has an initial fund which can get bigger through the use of surpluses; it also has other changes in the net assets, which comprises subsidies and donations related to the tangible and intangible assets. Moreover, there are a multiple of accounts specific for the social economy like: meritorious people in the obtained funding; founders, donators and associates in accounts receivables and payables and, additionally, the fixed tangible assets can be split into public domain assets and assets of historical, artistic and culture heritage. All the accounting specifications are present in Portaria nº106/2011 de 14 de Março.
4. Methodology
In order to build the present model two benchmarks were taken into account: the Moody’s methodology for non-profits and the model that BPI uses to compute the rating for small companies, which, according the bank’s criteria, is applied to companies with low annual revenues (because most of the studied IPSS have also low revenues). The Moody’s model is composed by a quantitative part, which has three factors (Market Position, Operating Performance and Balance Sheet and Capital Investment), and by a qualitative part, which also has three factors (Governance and Management, Legal Security and Debt Structure and Other Credit Specific Considerations). Additionally, the BPI’s Model also has two parts, the quantitative (with ratios related to the financial statements) and the qualitative (with other sort of indicators such as financial information’s quality or market share). In both models, the final score is given by the score provided by the quantitative part adjusted to the impact of the qualitative factors (they can change the quantitative score by multiple notches depending on their impact). Therefore, it was decided that the model built in this work project should also be composed by a quantitative and a qualitative part. In order to build the quantitative part, a set of dimensions was established as groups of ratios that aim to evaluate a specific characteristic of the company, such as its liquidity.
12
With the establishment of the dimensions it was easier to choose a set of ratios which were able to evaluate that specific characteristic, without being redundant among them and, at the same time, being able to cover all aspects of that dimension.
After conceptually defining the ratios for the quantitative part it is important to analyse them in order to attribute a score for this part of the model. In BPI’s model, the rating of the quantitative part is computed based on an econometric model which relates the value of the different ratios with the probability of default, based on organizations’ past financial information and on their obligations’ payment situation (overdue debt, default, etc.). On the other hand, the Moody’s proposed model sets intervals for each indicator and attributes a score for each of those intervals. Afterwards, by giving a weight to each indicator, it gets the rating of the quantitative part.
Since this model is not specifically a credit risk model together with the lack of sufficient data, an econometric method based on the probability of default is not the most appropriate one. Therefore, the method used is very similar to the one used by Moody’s. First of all, the values for the intervals were defined for each ratio. To do so, an analysis on the data collected from the BPI’s electronic file was performed. Secondly, to define the weights to be attributed to each of these ratios, an enquiry to many BPI’s employees with experience and knowledge in this field was made, regarding the relative importance they would allocate (personal opinion based on experience) to each quantitative indicator. The indicators of the qualitative part were set by selecting key indicators from BPI’s and Moody’s models and considering the sector’s specifications in the national conjuncture.
4.1. Quantitative Part
4.1.1. Ratios
According to the “International Financial Statement Analysis” (CFA Institute, 2009) the financial ratios can be grouped into five different categories according to their
13
measurement goal: Activity, Liquidity, Solvency, Profitability and Valuation ratios. Moreover, the BPI’s model also groups the quantitative metrics into five similar categories which are: activity, indebtedness, capital structure, liquidity and profitability. There are several important differences between the corporate and the not-for-profit worlds. A big one is the focus on social goals rather than profit. Therefore, since their goal is not to provide financial return to their shareholders (because they do not have shareholders at all), the financial statement analysis needs to be adapted since indicators, like return on equity or other profitability ratios, may not be adequate for these organizations. Hence, the indicators used in the model cannot be the same as the ones used in a typical for-profit company, neither have the same benchmark values when being analysed. Another important difference is that, due to these organization’s charitable orientation and due to the low fees they charge for the services they provide, it is very hard to generate their own strong revenue streams, making it harder to face its operational expenses and even harder to finance the organization through production surpluses. Thus, not-for-profits need to depend on other sources of revenues like Government’s subsidies or private donations and to be more careful with debt raising than for-profit companies. A list of 15 ratios (Table 1) was built in order to fulfil four of the five dimensions suggested by CFA Institute (2009) since the Valuation ratios are meaningless due to the absence of shareholders in these organizations.
Many of these ratios were selected from Monitoring Guide for the Solidarity’s Sector Restructuring Fund (2015) by the Portuguese Social Security, which suggests a set of different ratios divided into financial or economical ratios. Other literature used to select the quantitative part’s ratios were: the “Financial Ratio Analysis Comes to Nonprofits” (Chabotar, 1989) which groups ratios that can be used to assess the non-profits financial condition into five dimensions: Liquidity, Debt Structure, Sources of Funds, Uses of
14
Funds and Net operating Results; the A. Abraham’s “A Model of Financial Performance Analysis Adapted for Nonprofit Organisations” that divides the ratios in concordance with its relation to the mission, by trying to provide answers related to the sufficiency, the availability, the usability and to the efficiency and effectiveness of the resources in order to support the mission; and also the Moody’s model which indicates ratios related to an organization’s balance sheet, to its operating performance and market position. a) Liquidity ratios:
There are two ratios within this dimension: Current Ratio, focused on meeting the short-term liabilities and Days with no Income, focused on covering the operational expenses. The Current Ratio measures the ability to meet the short-term liabilities through the use of current assets. Since these are the liabilities which mature earlier, they need to be met by assets which are either cash or assets that can be converted in the short-term. This is important to be measured because once these obligations are not met it enters in default. Days with Low Income measures the number of days an organization is able to maintain its operations (with the same operational costs) without having any source of income and relying only on cash and short-term financial investments. This is an important indicator because it is another liquidity measure and, since it is a worst-case scenario measure, it analyses how well prepared an organization is to face decreases on its income stream. b) Solvency ratios:
The solvency dimension is composed by two ratios, the Net Assets-to-Assets Ratio, which analyses the organization’s capital structure, and the Debt Service Coverage Ratio, that measures the ability to pay the debt service using its operating income.
The Net Assets-to-Assets Ratio measures how its assets are financed either via debt or via net assets. Due to the nature of these organizations (not-for-profit) it is important that a big portion of the assets is financed by net assets and not from debt, since they generate
15
much less earnings and cash flows than the for-profit companies and therefore their ability to repay the debt is lower. Moreover, since the sources and amount of revenue are usually very small, they should not be jeopardized to pay a massive debt service but to operate in favour of their users. This is an important ratio because it helps to identify if the organization is incurring in a lot of debt or not.
The Debt Service Coverage Ratio measures the size of the EBITDA comparing it with the debt service expenses. These expenses are mostly made by interest payments, and it examines if the operational earnings are large enough to pay for the cost of its debt. It is an important ratio because, it indicates if the organization is able to pay for the costs of its own debt and, at the same time, if the debt level is well adjusted to the organization. c) Profitability ratios:
There are two profitability ratios within this model, the Net Cash Flow, the organization’s ability to generate cash flows discounted for the size effect, and the Operating Margin, which helps identifying the organization’s operational sustainability.
The ratio Net Cash Flow measures the ability of the organization to generate cash flows from its operations, discounted for the size factor. This is an important ratio because it allows an understanding of the organization’s ability to generate cash flows after paying all expenses for further improvement of its operations or facilities, to repay its debt, or to create reserves for future investments or financial drawbacks.
The Operating Margin measures the ability of the organization to generate operational earnings. It is an important indicator, not because it measures the ability of the organization to provide very high margins (because of its not-for-profit orientation), but to understand if it is not generating deficits overtime, and if possible to be capable to generate low margins to create a buffer for harder times, making the operations sustainable overtime and allowing for future investments it might need to do.
16
d) Activity ratios:
This dimension is composed by nine different ratios (the Operational Costs Weights is composed by three different ratios) which measure the relationships between the different sources of revenues, of expenses, their relation and the relations between those two variables and users and employees (two key stakeholders). The rationale for the bigger number of the activity ratios is that the operational efficiency requires a deeper and more complex analysis (multiple sources of expenses and revenues), not meaning that this dimension as a whole is relatively more important than the others.
The ratio Subsidies’ Reliance measures the impact of the subsidies received by the organization on its total revenues. This is an important ratio because it identifies the dependency of the organization on third parties (mainly the National Government) in terms of revenue streaming, exposing it to a higher source of risk.
The three Operational Costs’ Weights ratios measure the revenue’s consumption by each of the three kinds of expenses in which these organizations incur (costs with goods and raw materials, external services and supplies and staff costs). These ratios are important because they allow for a better understanding about how the organization’s resources are being spent within its operations.
The ratio Staff Costs Coverage measures how the staff costs are being covered by the subsidies received by the organization. It is important to understand if the subsidies (mainly the financial support that the organization is receiving by the Government) are big enough to cover the biggest source of expenses of these organizations (most of these organizations are labour-intensive) and the most urgent kind of expense (when comparing to the other types of expenses, this is the one which is more important to keep up-dated). The ratio Cost per Employee measures the cost that the organization is incurring with each of its employees. It is a very important measure of the organization’s operational
17
efficiency, allowing for a better understanding on how well the staff expenses are managed, being, in most cases, the biggest stake of expenses.
The Cost per User ratio measures the cost in which the organization is incurring with each user it serves. It measures the efficiency of the operations by understanding how much of its resources are being spent with each of the users, taking into account all its needs. The Sales per User measures the amount of revenues the organization is collecting, mostly from monthly fees, from each of its users. The users provide two different revenue streams to the organization, through the monthly payments they pay from themselves and through the Social Security’s subsidies, which are given for each user the organization assists. Therefore, the ratio is important to understand if the organization is charging the right amount directly to its users and its margin to increase or decrease that value. Users per Employee measures the number of users each employee can assist to in its labour time. It is important for the organization to allocate efficiently its human resources in its operations, especially because the staff is often the biggest source of expenses.
4.1.2. Score Grids
To evaluate each ratio, and consequently the overall condition of the organization, it is important to build score grids for each indicator. A score grid is composed by several intervals which are delimited by standard values, an upper and a lower bound (with exception of the first and last interval which only have either the upper or the lower bound) and to each of them is attributed a score. A discrete method like this allows for an easier understanding and further communication of the model’s results in comparison to a continuous model, making it easier to compare the scores across different organizations. In the BPI’s model the scoring is made based on a grid with scores from N1 to N10 (N for Negócios, small companies), where N1 is the best score and N10 the worst one. Due to the lower complexity of the present model when compared with the ones from BPI and
18
since the sample used in this model is much smaller there will only be 5 intervals on the grid considered for the scoring of the present model. The grid will be scored from O1 to O5 (where O stands for Organization), being O1 the best score and O5 the worst score. To compute the ratios, financial statements (balance sheet and income statement) from multiple organizations between the years of 2015 and 2008 were used. However, not all of these organizations had available information for all these years. Moreover, the financial statements available in the electronic file were not all in the same format neither in a unique document. Therefore, a unique document was built, including all the organizations and for the years available for each one of them (between 2015 and 2008), using the financial statement’s layout required by the Social Security (refer to Appendix B for a detailed description of the layout).
The sample was composed by 65 different organizations (all data collected from the bank’s electronic file), among which 27 of them are parish social centres, 24 are
misercórdias, and the remaining 14 are other type of organizations. Taking into account
data for several years in some institutions, the sample reaches a number of 315 observations for some indicators, while other indicators have lower number of observations either by lack of information or because in same cases the indicator does not have a meaningful value (for instance, in the Debt Service Coverage Ratio, a case in which the organization does not have financial debt).
The data was considered to be cross-sectional, meaning that for each indicator, the combination of the organization’s ratio value within a specific year is considered independent (for instance the value of the current ratio for the organization A and for 2015 is independent from the one from the same organization but for 2014). The reason why the data was considered to be cross-sectional rather than time-series, is that the number of observations within each of the different years varies a lot, making a
time-19
series analysis inaccurate: in 2013 and 2012 one has balance sheet information available for 60 organizations whereas for years like 2009 and 2008 the same information is only available for 8 and 4 organizations respectively. A time-series analysis would be possible to be performed, allowing for a deeper and more complete analysis, upon the availability of more yearly data for each institution.
Regarding the values obtained for the different ratios, and in order to build the intervals for the score grids, it is important to analyse the results’ distributions (consult Table 2 for a detailed information regarding the descriptive statistics). In the majority of these ratios, the distribution of the sample presents evidence of a high dispersion, taking into account their relative standard deviation (standard deviation divided by the average). The dispersion is mainly caused by the presence of several big outliers which, by its enormous dimension (for instance a Debt Service Coverage Ratio of 676,113 or a Net Cash Flow of -889%), it biases the sample and skews important statistical measures like the average which can no longer be used to make accurate inferences. This can also be verified by checking the differences between the average and the mean. For example, the Current Ratio’s sample has an average of 1.87 and a median of 0.75, meaning that, by the presence of a few positive and big outliers, the average is positively skewed.
Moreover, and despite de presence of the outliers, for all the indicators, the samples are not too dispersed (could contribute to build too big and probably meaningless intervals) neither too concentrated, making it possible to make a good segmentation to build the interval’s grids, avoiding too small and similar intervals, making the scoring irrelevant. Each score grid interval was built based on the samples percentiles. Since the model relies on a score which is composed by 5 different scores, the intervals were built based on the values (rounded) of the 20%, 40%, 60% and 80% percentiles of the sample, a similar method has the one used by Moody’s on its not-for-profit organization’s model, “with
20
values mapped to a broad rating category based on the distribution of values in Moody’s current rated portfolio”. By using percentiles to build the grids, one is avoiding the problem raised by the outliers, present in almost all the indicators, making the values for the intervals more robust and better representative of the entire universe of IPSS.
Nevertheless, for the Current Ratio a deeper analysis needed to be made. Given the economical meaning of the value of this ratio being bellow 1 (the organization might enter into default because it cannot meet its short-term liabilities through the use of current assets), it was assumed that 1 was the upper bound of the O4 interval (the second worst). Once this value corresponds approximately to the 60% percentile and given that the distance between it, the 70% and the 80% percentiles is significantly high (considering the differences between the other percentiles), the rounded values of those percentiles, 1.5 and 2.0 were used as boundaries for the scores above O4. Finally, as it was done for the other ratios, and taking into account the differences between the values of the percentiles, the rounded value of the 20% percentile was used as lower bound of the score O4 and consequently the upper bound for the O5 score.
The full information regarding the score grids can be found in Table 3.
4.2 Qualitative Part
The qualitative part of the model is composed by 4 indicators which cannot be measured directly from the organization’s financial reports but have a direct impact on its financial performance. These indicators are appraised by validating the compliance with several objective and direct requirements.
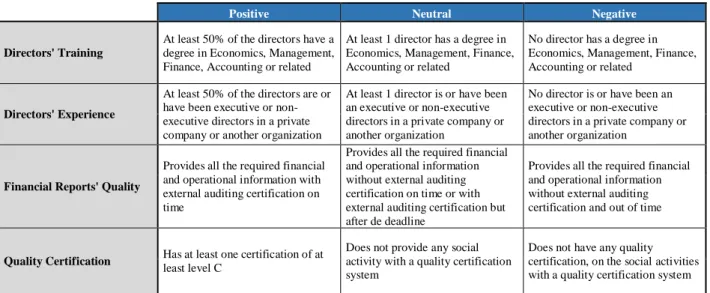
Based on Moody’s rating model for non-profits and on the BPI’s rating model for medium companies (the one which had the qualitative indicators available) a set of four indicators was built to evaluate mainly an organization’s governance and management: Directors’ Training; Directors’ Experience; Financial Reports’ Quality and Quality Certification.
21
The grids used to evaluate these indicators are much simpler than the ones used for the quantitative indicators since they only have three intervals based on its impact for the organization, which can be positive, negative or neutral.
The organization’s governance is something which strongly affects its financial performance. Although these are not-for-profit organizations and in many cases the directors are not paid, it is important to ensure that the board of directors have both people with an appropriate training for the job and with the right professional expertise. The Directors’ Training indicator aims to guarantee that, in the board of directors, there are people with an educational background related with the business area. Additionally, the Directors’ Experience ratio verifies if there are experienced people in the board of directors, analysing the directors’ professional experience in such positions. For the first ratio, the positive sign is attributed if at least half of the directors have a degree in economics, management, finance, and accounting or related to the previous areas, it is neutral if at least one director has such a degree, and negative if no director has training in the previous areas. For the second ratio, the positive sign is assigned if at least half of the directors were previously or are currently executive or non-executive directors in a private company or in another organization, neutral if there is only one director with the previous experience and negative if none of the directors have that same experience. For these organizations, accountability is very important because possible investors can make their donations decisions based on this factor. The quality of the financial reports can be used as a tool to measure it. It is important for these institutions, not only to provide a full report with all financial and operational information, both consolidated and by social activity (as it is required by the Social Security) but also to meet the delivery time of such reports and, additionally, to have an external audit which provide an independent and impartial certification. Therefore, the positive score is obtained if the company
22
provides all the information required by the social security within the established deadline and with external audit, it is neutral if the organization delivers the required information on time but without an external audit or with external audit but after the deadline and it is negative if it does not have an external audit neither it is delivered on time.
At last, another very important factor for the success of these organizations is how the operations are managed and their quality. It goes from the quality of the provided service to how the staff is managed or how the suppliers are chosen. The quality certifications are a good way to measure the quality of these organizations. For that purpose, the Quality Management System for the services provided by social activities, which provides certifications for a specific number of social activities (temporary reception centre, centre for occupational activities, day centre, day care, home for children and youth, residential home, residential structure for the elderly, home support service), will be used. If an organization does not provide any of the social activities that have certification, a neutral score is attributed. If an organization does not have any certification but provides any of the social activities that have certification, it will have a negative score. If it has got any certification, it will get a positive score.
Consult Table 4 a better perception on the grids of these five qualitative indicators. All these indicators together contribute to the change of the score provided by the quantitative part, by moving that score upwards or downwards depending on the outcome of the qualitative part. Since the number of qualitative indicators is relatively small and the score grid has a low number of intervals, the qualitative part as a whole can only upgrade or downgrade the score by one notch.
4.3. Weight Assignment
The quantitative part’s score is attributed by making a weighted average of each ratio’s score. The score of the ratios is translated into integer numbers where O1 is equal to 1,
23
O2 is equal to 2 and so on until O5, in order to obtain that average. The result from the weighted average of these values is rounded to the units and it is translated into the same scale using the inverse process of the one described above.
In order to attribute weights to each ratio, an enquiry was built to be answered by BPI’s most expert professionals in this area (19 BPI’s employees), and, for that reason, these professionals were chosen by the BPI’s advisor (the full enquiry can be found on Appendix C). The enquiry was divided into two phases, firstly it was asked to sort the four dimensions and to attribute weights accordingly (the weights should sum 100%); in the second phase, the same was asked, but this time it was supposed to sort and attribute weights to the ratios within each dimension (within each dimension, the ratios’ weights should sum 100%). Such a procedure, divided into two parts, allows for an easier and more straightforward reasoning when compared to a method which simply puts all ratios together to allocate the weights among them.
Nine answers were obtained and the results were divided into two separate samples, one for the dimensions and the other for the ratios, which allow for a more precise analysis and consequently for better conclusions (refer to Table 5 and 6 for a detailed information on the descriptive statistics). Although for both samples the standard deviations are relatively low, the weights attributed by different people varies substantially, which can be seen by the observations’ range of each dimension and indicator. Moreover, even the importance order attributed to both dimensions and the ratios within each dimension changes from person to person. All these aspects mean that there is no consensus related to the importance of the indicators, which could be in part explained by the fact that this is a sector with a lot of specifications and, probably, the majority of these people does not have a deep knowledge about the sector, leading to different perspectives regarding what is more important to have a good financial health.
24
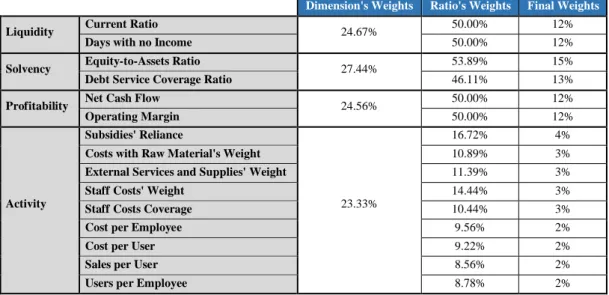
Nevertheless, in order to provide weights for the indicators, the average of each dimension and of each ratio were used, and, by multiplying the average weight of each ratio within a dimension by the average weight of the dimension, the ratios’ final weights (integer numbers) were obtained (Table 7). Despite of these weights are going to be used in the model, further improvements should be made, using the same method but for a bigger number of people and with a full briefing regarding the sector and its specifications. When it comes to the qualitative indicators, the weights are a little bit harder to assign. The relative importance of these indicators can vary both over time and between different organizations. For instance, the corporate governance indicators are, as Moody’s report states, “particularly important when a not-for-profit is facing strategic change”, additionally, since not all social activities have a quality certification system, the indicator Quality Certification becomes less important for the organizations which do not have any of those activities. This way, and as the goal of the model is to be applicable to as many organizations as possible, the qualitative indicators were considered to have all the same impact. Additionally, since the number of qualitative indicators is much smaller and its impact is not as directly measurable as the quantitative ones, the criteria to move the score provided by the quantitative part needs to be tight. Therefore, score is upgraded if there are 3 more positive indicators than negative ones, it is downgraded if there are at least 3 more negative indicators than positive ones, otherwise it does not change the score.
5. Conclusions and Recommendations
The model’s final score can assume values between O1 and O5, were O1 represents the best financial and economic performance possible and O5 is the worst possible score. It is given through the combination of both quantitative and qualitative parts contribution. Images of an excel file with the model built on this work project can be found on Appendix D, the entire document is in Portuguese since the primary goal is to be used by
25
Portuguese analysts and institutions. It is composed essentially by four different sheets, the first one with the index, the second one with the instructions, the third one with the model’s inputs (dropdown lists to indicate the option for the qualitative factors and balance sheet and income statements to be filed by the user) and with the values for the quantitative indicators and the last sheet with the final score for the latest year, the scores for each quantitative ratio for the last 10 years, the impact of the qualitative indicators (only for the last year) and both quantitative and qualitative score grids.
Using the same sample used to build the score grids for the quantitative part, it was computed the score for multiple organizations among different years. The scores only include the quantitative part since there is no information available regarding the qualitative indicators. It was possible to compute 43 different scores and most of the scores obtained were O3 with 23 observations, the distribution was more concentrated around the middle value and more disperse on the tails. Additionally, 12 organizations have scores for multiple years and, in 73% of the cases the score does not change between two consecutive years and in the other 27% it changes only by one score. In conclusion, although it is an in-sample analysis, the combination of the score scales and the attributed weights shows evidence of being well fitted to the sample and of being a robust model. The goal of the final score is to translate the current financial and economic performance of an organization, based on the information provided by the financial statements and on indicators that appraise the governance and management of the organization. Although the model is supposed to be standardized and used by all IPSS, it is important to make the analysis in accordance with the organization’s specifications: the services it provides, the external conditions to which it is subject and, above all, its mission, the social impact the organization is delivering. Therefore, besides the fact that all organizations could use this model, the scores are not quite comparable among very different organizations.
26
The number of social activities an IPSS can provide is very wide, which can mean that the operations from different organizations may differ a lot. Therefore, especially for the activity ratios, the analysis should also be done regarding each of the organization’s social activities, since the values for the ratios can be vary significantly among different social activities (the Figure 1 presents the Subsidies’ Reliance as an example). However, to make good and accurate inferences regarding the score grids, it would be necessary to have access to income statements per social activity for a significant number of organizations, which was not possible during this work project. Moreover, it is important to ensure that all financial statements’ items are standardized and include the same information, both among organizations and overtime.
In conclusion, this model allows for a very complete and deep analysis regarding the performance of IPSS, however, it is necessary to do further improvements, such as to extend the analysis to a broader sample of organizations (the larger the sample of organizations’ statements available the better the sector is represented and the most accurate the inferences will be) and to expand the model in order to include an analysis of the activity ratios by social activity.
27
7.
References
Abraham, Anne. 2004. “A Model of Financial Performance Analysis Adapted for Nonprofit Organisations.” Alice Springs.
Bray, Ilona. 2010. Effective Fundraising for Nonprofits: Real-World Strategies That Work. Berkeley, California: Nolo.
CFA Institute. 2009. International Financial Statement Analysis. New Jersey: Wiley. Chabotar, Kent John. 1989. “Financial Ratio Analysis Comes to Nonprofits.” The Journal of
Higher Education.
Instituto da Segurança Social. 2014. “Guia Prático - Cosntituição de Instituições Particulares de Solidariedade Social.”
Instituto Nacional de Estatística; Cooperativa António Sérgio para a Economia Social. 2013.
Conta Satélite da Economia Social 2010. Lisbon.
Larsson, Jenny, and Joan Kinnunen. 2008. “Performance Measurement in Nonprofits - Much to be gained or a waste of resouces?”
Monzón, José Luis, and Rafael Chaves. 2012. The Social Economy in the European Union. Brussels: Visits and Publications.
Moody's Investors Service. 2013. “Request for Comment: Not-for-Profit Organizatons (other tha Healthcare and Education) Methodology.”
Social Security. 2015. “Guia de Acompanhamento - Fundo de Reestruturação do Sector Solidário.”
Sontag-Padilla, Lisa M., Lynette Staplefoote, and Kristy Gonzalez Morganti. 2012. “Financial Sustainability for Nonprofit Organizations.”
União da Misericórdias Portuguesas. n.d. Misericórdias. Accessed December 12, 2016. http://www.ump.pt/misericordias.
United Nations. 2003. Handbook on Non-Profit Institutions in the System of National Accounts. 2003: United Nations.
Turk, F.J., Gallo, R.P., Gilman, S.A., Mechanick, J.D., Montalbano, C.M., Salluzzo, R.E., Prager, F.J., Cure, H.J., and Deproso, R.L. 1995. Ratio Analysis in Higher Education: Measuring
Past Performance to Chart Future Direction. 3rd Edition. KPMG Peat Marwick and
Prager, McCarthy & Sealy
Decreto Lei nº 172-A/2014 de 14 de Novembro do Ministério da Solidariedade, Emprego e Segurança Social. Diário da República: I série, nº 221 (2014)
Portaria nº 106/2011 de 14 de Março do Ministério das Finanças. Diário da República: I série,
nº 51 (2011)
28
8. Tables and Figures
Table 1 - Quantitative Part Indicators
Dimension Indicator Formula
Liquidity
Current Ratio Days with no Income
Solvency
Net Assets-to-Assets Ratio Debt Service Coverage Ratio
Profitability
Net Cash Flow Operating Margin
Activity
Subsidies’ Reliance Costs with Raw Materials’ Weight External Services and Supplies’ Weight
Staff Costs’ Weight
Staff Costs Coverage Cost per Employee
Cost per User Sales per User Users per Employee
𝐶𝑢𝑟𝑟𝑒𝑛𝑡 𝐴𝑠𝑠𝑒𝑡𝑠 𝐶𝑢𝑟𝑟𝑒𝑛𝑡 𝐿𝑖𝑎𝑏𝑖𝑙𝑖𝑡𝑖𝑒𝑠 𝑁𝑒𝑡 𝐴𝑠𝑠𝑒𝑡𝑠 𝑇𝑜𝑡𝑎𝑙 𝐴𝑠𝑠𝑒𝑡𝑠 𝐸𝐵𝐼𝑇𝐷𝐴 𝐼𝑛𝑡𝑒𝑟𝑒𝑠𝑡 𝑝𝑎𝑦𝑚𝑒𝑛𝑡𝑠 𝑁𝑒𝑡 𝐼𝑛𝑐𝑜𝑚𝑒 + 𝐷𝑒𝑝𝑟𝑒𝑐𝑖𝑎𝑡𝑖𝑜𝑛𝑠 𝑅𝑒𝑣𝑒𝑛𝑢𝑒𝑠 𝐸𝐵𝐼𝑇𝐷𝐴 𝑅𝑒𝑣𝑒𝑛𝑢𝑒𝑠 𝑆𝑢𝑏𝑠𝑖𝑑𝑖𝑒𝑠 𝑅𝑒𝑣𝑒𝑛𝑢𝑒𝑠 𝑆𝑡𝑎𝑓𝑓 𝐶𝑜𝑠𝑡𝑠 𝑅𝑒𝑣𝑒𝑛𝑢𝑒𝑠 𝑆𝑢𝑏𝑠𝑖𝑑𝑖𝑒𝑠 𝑆𝑡𝑎𝑓𝑓 𝐶𝑜𝑠𝑡𝑠 𝑆𝑡𝑎𝑓𝑓 𝐶𝑜𝑠𝑡𝑠 𝑁𝑢𝑚𝑏𝑒𝑟 𝑜𝑓 𝐸𝑚𝑝𝑙𝑜𝑦𝑒𝑒𝑠 𝑂𝑝𝑒𝑟𝑎𝑡𝑖𝑜𝑛𝑎𝑙 𝐶𝑜𝑠𝑡𝑠 𝑁𝑢𝑚𝑏𝑒𝑟 𝑜𝑓 𝑈𝑠𝑒𝑟𝑠 𝑆𝑎𝑙𝑒𝑠 𝑁𝑢𝑚𝑏𝑒𝑟 𝑜𝑓 𝑈𝑠𝑒𝑟𝑠 𝑁𝑢𝑚𝑏𝑒𝑟 𝑜𝑓 𝑈𝑠𝑒𝑟𝑠 𝑁𝑢𝑚𝑏𝑒𝑟 𝑜𝑓 𝑒𝑚𝑝𝑙𝑜𝑦𝑒𝑒𝑠 𝐶𝑎𝑠ℎ + 𝑆ℎ𝑜𝑟𝑡 𝑇𝑒𝑟𝑚 𝐼𝑛𝑣𝑒𝑠𝑡𝑚𝑒𝑛𝑡𝑠 𝑂𝑝𝑒𝑟𝑎𝑡𝑖𝑜𝑛𝑎𝑙 𝐶𝑜𝑠𝑡𝑠 ∗ 365 𝐶𝑜𝑠𝑡𝑠 𝑤𝑖𝑡ℎ 𝐺𝑜𝑜𝑑𝑠 𝑎𝑛𝑑 𝑅𝑎𝑤 𝑀𝑎𝑡𝑒𝑟𝑖𝑎𝑙𝑠 𝑅𝑒𝑣𝑒𝑛𝑢𝑒𝑠 𝐸𝑥𝑡𝑒𝑟𝑛𝑎𝑙 𝑆𝑒𝑟𝑣𝑖𝑐𝑒𝑠 𝑎𝑛𝑑 𝑆𝑢𝑝𝑝𝑙𝑖𝑒𝑠 𝑅𝑒𝑣𝑒𝑛𝑢𝑒𝑠
29
Table 2 - Descriptive Statistics for the Quantitative Indicators
# Observations Average Standard Deviation (SD) Relative SD Minimum 1st Quartile Median 3rd Quartile Maximum
Liquidity Current Ratio 315 1.87 4.50 241% 0.01 0.34 0.75 1.83 56.48
Days with no Income 313 178 997 561% 0 12 40 98 15,033
Solvency Net Assets-to-Assets Ratio 315 60.1% 26.7% 44% -83.4% 48.9% 62.6% 79.6% 97.1%
Debt Service Coverage Ratio 282 2,617.3 40,338.0 1,541% -131.4 2.5 6.8 21.9 676,113.3
Profitability Net Cash Flow 313 5.0% 61.4% 1,218% -889.0% 3.8% 7.9% 14.1% 130.1%
Operating Margin 313 9.4% 40.7% 432% -566.4% 3.7% 8.1% 14.9% 280.7%
Activity
Subsidies' Reliance 313 51.9% 21.0% 40% 0.0% 40.3% 54.6% 65.1% 100.0%
Costs with Raw Material's Weight 313 12.6% 7.0% 56% 0.0% 8.9% 12.7% 16.2% 35.7%
External Services and Supplies' Weight 313 30.3% 44.5% 147% 12.3% 18.5% 23.5% 32.0% 573.2%
Staff Costs' Weight 313 59.1% 16.4% 28% 0.0% 52.1% 62.2% 68.1% 121.8%
Staff Costs Coverage 311 94.1% 102.0% 108% 0.0% 69.4% 84.9% 104.6% 1,674.1%
Cost per Employee 65 11,785 2,710 23% 4,388 10,168 11,476 13,149 19,427
Cost per User 52 5,310 6,522 123% 97 3,151 3,947 6,212 48,636
Sales per User 52 3,197 7,037 220% 72 1,019 1,705 3,303 51,681
Users per Employee 51 14.4 45.2 313% 1.2 2.9 4.3 6.3 254.9
Table 3 - Quantitative Part’s Score Grids
O1 O2 O3 O4 O5
Liquidity Current Ratio X > 2.0 2.0 > X > 1.5 1.5 > X > 1.0 1.0 > X > 0.3 X < 0.3
Days with no Income X > 125 125 > X > 55 55 > X > 25 25 > X > 10 X < 10
Solvency Net Assets-to-Assets Ratio X > 80% 80% > X > 70% 70% > X > 60% 60% > X > 40% X < 40%
Debt Service Coverage Ratio X > 35.0 35.0 > X > 10.0 10.0 > X > 5.0 5.0 > X > 1.5 X < 1.5
Profitability Net Cash Flow X > 15.5% 15.5% > X > 10.0% 10.0% > X > 6.0% 6.0% > X > 2.5% X < 2.5%
Operating Margin X > 16.0% 16.0% > X > 11.0% 11.0% > X > 7.0% 7.0% > X > 2.0% X < 2.0%
Activity
Subsidies' Reliance X < 35% 35% < X < 50% 50% < X < 60% 60% < X < 70% X > 70%
Costs with Raw Material's Weight X < 7% 7% < X < 10% 10% < X < 14% 14% < X < 17% X > 17%
External Services and Supplies' Weight X < 18% 18% < X < 22% 22% < X < 25% 25% < X < 35% X > 35%
Staff Costs' Weight X < 50% 50% < X < 60% 60% < X < 65% 65% < X < 70% X > 70%
Staff Costs Coverage X > 110% 110% > X > 90% 90% > X > 80% 80% > X > 60% X < 60%
Cost per Employee X < 10,000 € 10,000 € < X < 11,000 € 11,000 € < X < 12,200 € 12,200 € < X < 13,500 € X > 13,500 €
Cost per User X < 3,000 € 3,000 € < X < 3,800 € 3,800 € < X < 5,000 € 5,000 € < X < 6,900 € X > 6,900 €
Sales per User X > 4,000 € 4,000 € > X > 2,200 € 2,200 € > X > 1,500 € 1,500 € > X > 900 € X < 900 €
30
Table 4 - Qualitative Indicator's Score Grid
Positive Neutral Negative
Directors' Training
At least 50% of the directors have a degree in Economics, Management, Finance, Accounting or related
At least 1 director has a degree in Economics, Management, Finance, Accounting or related
No director has a degree in Economics, Management, Finance, Accounting or related
Directors' Experience
At least 50% of the directors are or have been executive or non-executive directors in a private company or another organization
At least 1 director is or have been an executive or non-executive directors in a private company or another organization
No director is or have been an executive or non-executive directors in a private company or another organization
Financial Reports' Quality
Provides all the required financial and operational information with external auditing certification on time
Provides all the required financial and operational information without external auditing certification on time or with external auditing certification but after de deadline
Provides all the required financial and operational information without external auditing certification and out of time
Quality Certification Has at least one certification of at least level C
Does not provide any social activity with a quality certification system
Does not have any quality certification, on the social activities with a quality certification system
Table 5 - Descriptive Statistics for the weights of the dimensions
# Observations Average Standard Deviation Minimum Maximum Range
Liquidity 9 24.67% 6.04% 15.00% 35.00% 20.00%
Solvency 9 27.44% 9.13% 15.00% 50.00% 35.00%
Profitability 9 24.56% 7.85% 10.00% 40.00% 30.00%
Activity 9 23.33% 8.82% 10.00% 35.00% 25.00%
Table 6 - Descriptive Statistics for the weights of the ratios
# Observations Average Standard Deviation Minimum Maximum Range
Liquidity Current Ratio 9 50.00% 9.43% 40.00% 60.00% 20.00%
Days with no Income 9 50.00% 9.43% 40.00% 60.00% 20.00%
Solvency Equity-to-Assets Ratio 9 53.89% 13.29% 40.00% 75.00% 35.00%
Debt Service Coverage Ratio 9 46.11% 13.29% 25.00% 60.00% 35.00%
Profitability Net Cash Flow 9 50.00% 10.80% 40.00% 70.00% 30.00%
Operating Margin 9 50.00% 10.80% 30.00% 60.00% 30.00%
Activity
Subsidies' Reliance 9 16.72% 6.86% 3.00% 25.00% 22.00%
Costs with Raw Material's Weight 9 10.89% 4.68% 5.00% 20.00% 15.00%
External Services and Supplies' Weight 9 11.39% 4.43% 5.00% 20.00% 15.00%
Staff Costs' Weight 9 14.44% 4.97% 10.00% 25.00% 15.00%
Staff Costs Coverage 9 10.44% 2.87% 5.00% 15.00% 10.00%
Cost per Employee 9 9.56% 4.27% 5.00% 20.00% 15.00%
Cost per User 9 9.22% 3.33% 5.00% 15.00% 10.00%
Sales per User 9 8.56% 3.50% 5.00% 15.00% 10.00%
31
Table 7 - Quantitative Ratio's Weights
Dimension's Weights Ratio's Weights Final Weights
Liquidity Current Ratio 24.67% 50.00% 12%
Days with no Income 50.00% 12%
Solvency Equity-to-Assets Ratio 27.44% 53.89% 15%
Debt Service Coverage Ratio 46.11% 13%
Profitability Net Cash Flow 24.56% 50.00% 12%
Operating Margin 50.00% 12%
Activity
Subsidies' Reliance
23.33%
16.72% 4%
Costs with Raw Material's Weight 10.89% 3%
External Services and Supplies' Weight 11.39% 3%
Staff Costs' Weight 14.44% 3%
Staff Costs Coverage 10.44% 3%
Cost per Employee 9.56% 2%
Cost per User 9.22% 2%
Sales per User 8.56% 2%
Users per Employee 8.78% 2%
Figure 1 - Subsidies' Reliance by Social Activity
Day Care Preschool Home Support Day Centre Residential Home
0.0% 20.0% 40.0% 60.0% 80.0% 100.0% 120.0%