Efficiency of Local Government Spending: Evidence
for the Lisbon Region
1António Afonso
2and Sónia Fernandes
3 July 2003Abstract
In this paper we measure and analyse expenditure efficiency of Portuguese local governments using a non-parametric technique for production frontier estimation known as Free Disposal Hull. We first construct an index of municipal performance and then compute input and output efficiency scores for 51 Portuguese municipalities located in the region of Lisbon and Vale do Tejo (RLVT) in order to estimate the extent of municipal spending that seems to be “wasted” relative to the “best-practice” frontier. The results of our empirical analysis suggest that RLVT municipalities could achieve, on average, roughly the same level of local output with about 39 percent fewer resources, i.e. local performance could be improved without necessarily increasing municipal spending.
JEL: C14, H72
Keywords: municipal expenditure, efficiency, production possibility frontier, FDH
1 The opinions expressed herein are those of the authors and do not necessarily reflect those of the author’s employers.
2 ISEG/UTL - Technical University of Lisbon, R. Miguel Lúpi 20, 1249-078 Lisbon, Portugal, email: [email protected].
3 ISCSP/UTL – Technical University of Lisbon, Pólo Universitário do Alto da Ajuda, Rua G, 1345-055 Lisbon, Portugal, email: [email protected].
Contents
1. Introduction ... 3
2. Motivation and some stylised facts ... 4
2.1. Theoretical motivation... 4
2.2. Some stylised facts for the Portuguese local sector... 6
3. Analytical framework ... 10
3.1 Modelling local government production and measuring spending efficiency ... 10
3.2 The FDH analysis ... 12
4. Non-parametric efficiency analysis of spending in RLVT... 15
4.1 Total Municipal Performance (TMP) indicator... 15
4.2 Results of FDH analysis ... 21
5. Conclusion... 24
References ... 25
1. Introduction
The debate over spending efficiency of local governments has been renewed with the implementation of decentralisation policies designed to refocus public decision making from central to municipal levels of government. The theoretical rational behind this decentralisation supports that higher participation of local governments, in choosing the use of public resources, allows for a better match between public services provision and the needs and preferences of a heterogeneous citizenry. This type of outcome additionally favours “efforts to make government both more efficient and more democratic” and a more effective control of the overall growth of government (see Marlow (1988) and Rowland (2001)).
We evaluate and analyse public expenditure efficiency of Portuguese municipal governments via the interpretation of public sector activities as production processes which transform inputs such as labour, capital, etc., in outputs/outcomes (Bradford, Malt and Oates (1969) and Fisher (1996)). We use the Free Disposable Hull (FDH) non-parametric methodology to compute input and output Farrel efficiency measures (efficiency scores) for 51 Portuguese municipalities located in the region of Lisbon and Vale do Tejo (RLVT) for 2001. This allows us to estimate the extent of municipal spending that is “wasteful” relative to the “best-practice” frontier.
Our paper contributes to the literature by supplying new evidence concerning the efficiency analysis of local government. Indeed, studies of local spending efficiency are still not abundant in the economic literature and, as far as we know, are not available for Portugal. We also construct a so-called Total Municipal Performance (TMP) index that can in the future be extended to the entire set of Portuguese local governments.
This paper is organised as follows. In Section 2 we give some further theoretical motivation and provide some stylised facts about the institutional structure and the revenue and expenditure components of the Portuguese local government sector. The FDH analytical framework is briefly described in Section 3. In section 4 we address data and measurement issues, and present and discuss the empirical results of the non-parametric efficiency analysis. Section 5 summarises and suggests some conclusions.
2. Motivation and some stylised facts 2.1. Theoretical motivation
Given the role assigned to local governments, there are several reasons for quantifying efficiency measures in order to assess the performance of local governments. Firstly, they make possible the comparison across similar units and allow for the evaluation of relative efficiency (Farrell (1957)). Secondly, if measurement reveals inefficiencies among the units under evaluation, further analysis can be undertaken to explain them (Lovell (1993, 2000), Kalirajan and Shand (1999)). Thirdly, the conclusions of such analysis may have practical policy implications for the improvement of efficiency and it may assist the public decision-making process (Lovell (1993)). Fourthly, as citizens at large have the “uneasy feeling that public resources are not always used in an efficient and effective way” (Moesen (1994)), it helps the application of general principles such as accountability.4
These principles bind upon public sector institutions by giving to local residents and to citizens in general, the information they need to effectively monitor and control their political representatives to perform efficiently and pursue the local interests and objectives motivating decentralisation processes. Finally, if we acknowledge that during the last decade municipalities have been under increasing financial stress, along with the general public government sector in most European countries, the efficiency of local service provision can be seen, in this tight environment, as an alternative to privatisation.
In spite of some recent theoretical and empirical developments of local sector’s economic analysis, the cornerstone of the theory of local finance is the Tiebout (1956) model. Tiebout was the first author to apply the idea of competitive markets to the local
4 The complexity of such a concept is pointed out by several authors as, for example, Bird and Vaillancourt (1999) and Blair (2000), to name such a few. This paper is particularly concerned with one of the possible aspects of accountability, that one concerning the responsiveness of local governments to their constituents and being perceived on the general argument that local residents need information to effectively monitor and control their political representatives.
government sector, arguing that from increased competition among local jurisdictions local service will tend toward more Pareto-efficient provision. 5
Embedded in the Tiebout hypothesis is the implicit assumption that local governments employ local public resources in a cost-minimising way for local public interests.6 However, several authors (Schwab and Oates (1988, 1991), Davis and Hayes (1993) and Deller (1992)) argue that local service provision also depends on factors other than “fiscal considerations” (Musgrave and Musgrave (1989)), such as specific characteristics of local residents.
Card and Krueger’s (1992) and Krueger’s (1997) empirical research demonstrates, for example, that the levels of local provision of educational services strongly depend on factors such as the “composition” of local communities. Schwab and Oates (1991) defined an analytical model where several aspects related to the composition of the local residents were explicitly controlled for, in order to identify the possible determinants of optimal distribution of individuals between jurisdictions. They concluded that the decentralisation of public responsibilities does not necessarily lead to an efficient outcome. Other studies, concerned with the increasing devolution of public responsibilities to local governments, also concluded for the reduced operational or ‘managerial’ capacity of local managers as being one factor that negatively influenced the efficacy and efficiency of local decision-making processes (see Deller and Rudnicki (1992)).
Additionally, public choice literature argues that inefficiencies may exist as a result of the advancement of the private interests of interest groups. Indeed, if we approach the local budgeting process as a representation of several “principal-agent” relationships and envisage local politicians (agents) facing citizens and central government
5 In his model, the “voting by feet” mechanism is envisaged as a market-type solution for local services provision. The local consumer/voter, having full knowledge about local revenue and expenditure patterns, picks “that community which best satisfies his preference pattern for public goods” moving “to that community whose local government best satisfies his set of preferences” (Tiebout (1956)). This ‘competitive’ process would imply a Pareto-efficient use of local resources, had there been no costly mobility and if choice alternatives available to residents were unlimited (Grossman, Mavros and Wassmer (1999)).
6
Under his model, an optimum would result in terms of the number of residents for which the services demanded for “can be produced at the lowest average cost” (Tiebout (1956)).
(principals), one may argue that in principle there would be no scope for increasing efficiency (Mueller (1989)).7 This would be true, had there been no self-interest among local leaders (agents), and if there were no “differences” in objectives among principals and agents (De Borger and Kerstens (2000)). The absence of scope for efficiency would also hold if the principals had been fully informed about the true conditions of service provision by their agents and could therefore effectively monitor the operations without incurring in additional costs
2.2. Some stylised facts for the Portuguese local sector
To put our empirical analysis in perspective, we present some stylised facts about the institutional structure, the revenue and expenditure components of Portuguese local sector for 2001. The actual institutional setting of the Portuguese local government sector was formally established in the 1976 Portuguese Constitution, approved after the 1974 Portuguese democratic revolution. In Figure 1 we illustrate the organisation of the Portuguese Public Sector.
Figure 1. The organisation of the Portuguese Public Sector
7 The reasoning of this argument derives from bureaucracy inefficiency models (Niskanen, 1975), and Migué and Bélanger (1974), where bureaucrats are presumed to have a tendency to develop their own interests and to act as to maximize their total budget (Niskanen (1975)). This model predicts that the common result from bureaucracy inefficient behaviour would be “overspending” (Hayes, Razzolini, Ross (1998)). Migué and Bélanger (1974) also argue that bureaucrats’ behaviour would lead to spending in excess of the production costs that were actually necessary to produce public services, giving rise to inefficiencies or slack.
Public Administrative/General Government sector: . State
. Autonomous Funds and Services; . Social Security. . Regional Administration . Local Administration: · Municipalities; · Parishes (freguesias) Public Empresarial sector Central Government Regional and Local
In Portugal there are currently 308 municipalities, 278 of which are located in Portugal mainland and the remaining 30 are overseas municipalities, belonging to the islands of Madeira and Azores. According to article 237 of 1976 Portuguese Constitution, local governments are territorially based organisations with administrative and fiscal autonomy. They have their own employees and patrimony and fiscal independence, whose activity should be fine-tuned to satisfy local needs and should be concerned with improving the well being of the population that live in their territories.
Since 1976 – the year the first municipal elections took place – there has been an increasing devolution of powers from central to local governments. In fact, with Law 159/99, the last to be approved, the areas of intervention of municipalities and parishes were further extended. Accordingly, they should promote social and economic development, territory organisation, and supply local public goods such as water and sewage, transports, housing, healthcare, education, culture, sports, defence of the environment and protection of the civil population.
According to the recently approved local finances Law (Law 42/98)8, Portuguese municipalities have their own budgets, to which apply budgeting principles and rules, some of which are also common to those binding the central government budget. As for the budgetary process, in the end of each year the executive organ of the municipality (town council) proposes to the legislative organ (municipal assembly) the local budget and the plan of activities for the following year.
Municipal authorities are also subject to several control mechanisms by central government agencies. These control mechanisms limit both their access to revenues and their expenditure choices. In what concerns the former, local governments borrowing is also under control from central government, which has been intensified during the last years, mainly since 2002 for budget consolidation purposes, thus limiting in addition their access to revenue. As for the latter, for example, personnel expenditures may not exceed 60 per cent of their current expenditures. Local sector liabilities vis-à-vis the
banking sector raised about 37% from 2000 to 2001, and according to the Banco de Portugal estimates, local borrowing represented 5% of GDP in 2001 (see Table 1).
Table1. Gross and Net Local Administration Borrowing (mainland and islands) 1995-2001, Thousand euros
1995 1996 1997 1998 1999 2000 2001
Gross banking liabilities (a) (b) 724.8 790.4 988 1238 1428 1745 2382
Variation rate of gross banking liabilities
65.6 197.4 249.8 190.3 317 637
variation in percent 0.09 0.25 0.25 0.15 0.22 0.37
Deposits (a) (c) 382.6 489.2 471.4 667.4 688.4 663.5 731.9
Net banking liabilities 342.2 301.2 516.4 570.2 739.5 1081.3 1649.8
in percent of GDP 0.4 0.3 0.6 0.6 0.7 0.9 1.3
Variation rate of net banking liabilities
-41 215.2 53.8 169.3 341.9 568.4
Source: Banco de Portugal. (a) Values in 31st of December.
(b) Borrowing from resident monetary financial institutions. (c) Deposits in resident monetary financial institutions.
In what concerns the expenditure components of Portuguese mainland municipalities for 20019, salaries accounted for about 24 per cent of total expenditures and 48 per cent of their current expenditures.10
The relevance of those expenditure items limits local governments’ margin of manoeuvre because they are regulated by rigid labour contracts. Employment duration and wage rates are both defined by the central government. As a result we may reasonably assume that there isn’t much labour-input price variability within Portuguese municipalities.
As for the revenue components although in light of article 237 of Portuguese Constitution municipalities are financially autonomous, their main sources of revenue come largely from transfers that accounted for 44 per cent of their total revenues. 28 per
9 According to law 42/98 (Local Finances) and decree-law 54-A/99 (Local Accounting System) municipal expenditures are divided between current expenditure (which include items such as salaries, acquisitions of goods and services and interests, etc.) and capital expenditures. Capital expenditures include, among others, investment expenditures implemented by the municipality in those areas defined in law 159/99 and capital transfers to the counties (“freguesias”). Investment expenditure is divided in four broad categories: (1) acquisition of land, (2) housing, (3) other buildings (including sports, recreational and schooling infrastructures, social equipment and other), and (4) diverse constructions. This last category comprises the following items: overpasses, streets and complementary work; sewage; water pumping, treatment and distribution; rural roads; and infrastructures for solid waste treatment.
cent of these transfers corresponded to central government unconditional grants.11 On the other hand, municipal direct taxes only represented 26 per cent of their total revenues for the same year.12
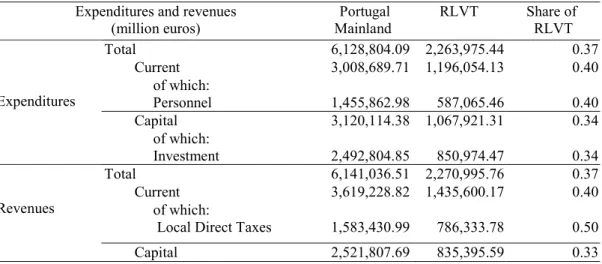
For our purposes, we will here limit the observations to 51 Portuguese municipalities located in the continental region of Lisbon and Vale do Tejo (RLVT).Although there may be some disadvantages of limiting the present analysis only to RLVT municipalities, there are two arguments motivating our choice. First, the 51 RLVT municipalities represent about 37 per cent of total expenditures and revenues of all municipalities located in Portugal mainland (see Table 2). Second, more detailed data is available on a regional basis for fiscal year 2001, allowing us to further expand our efficiency analysis.
Table 1. Lisbon municipal (RLVT) region’s weight in the Portuguese municipal sector
Expenditures and revenues
(million euros) Mainland Portugal RLVT Share of RLVT
Total 6,128,804.09 2,263,975.44 0.37 Current 3,008,689.71 1,196,054.13 0.40 of which: Personnel 1,455,862.98 587,065.46 0.40 Capital 3,120,114.38 1,067,921.31 0.34 Expenditures of which: Investment 2,492,804.85 850,974.47 0.34 Total 6,141,036.51 2,270,995.76 0.37 Current 3,619,228.82 1,435,600.17 0.40 of which:
Local Direct Taxes 1,583,430.99 786,333.78 0.50 Revenues
Capital 2,521,807.69 835,395.59 0.33
Source: Direcção-Geral da Administração Local.
All in all, although law 42/98 may be considered a benchmark in the evolution process of Portuguese local finances, there is still scope for improvement in Portuguese fiscal decentralisation process. This is true particularly in order to “establish an adequate relationship between the decisions to increase [local] expenditures and the responsibility for raising additional revenue (in particular through tax increases)” (Bronchi (2003)).
11For RLVT municipalities these values were respectively, 31% and 16%.
12 While for RLVT municipalities it amounted to 35% for the same year. For further discussion of the local governments financing see Pereira (1998).
3. Analytical framework
3.1 Modelling local government production and measuring spending efficiency
Our evaluation of local spending efficiency derives from microeconomic theory of production, and it will be taken on the interpretation of local sector activities as production processes, which transform inputs (such as labour, capital, etc.) in outputs/outcomes. Consequently, we must prior translate the way local governments transform inputs into outputs and select appropriate indicators.
Following Lovell (2000) and Bradford, Malt and Oates (1969), suppose that for a given set of k=1,…,K municipalities (“producers”), each employs a vector of N inputs/resources, x= (x1, …, xN), to provide a set of D directly produced outputs13,
y= (y1, …, yD) through the development of activities with a variety of characteristics. In
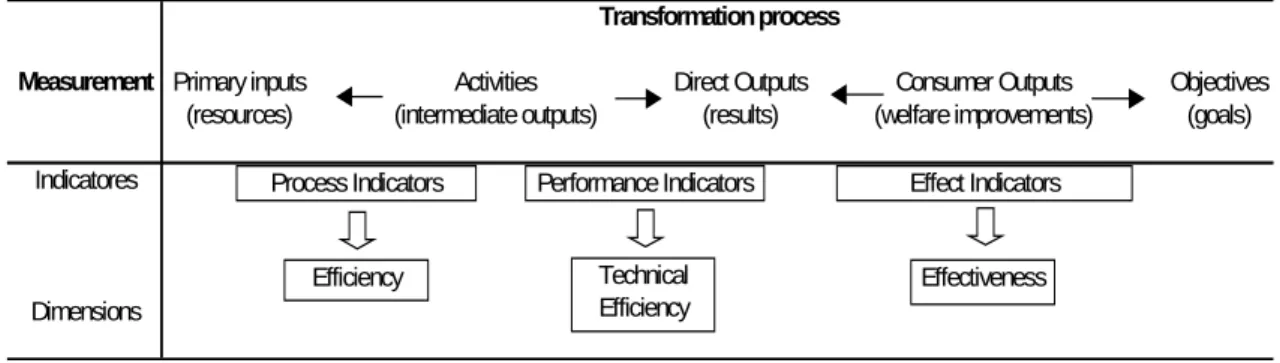
this simple framework (see Figure 2), process indicators would measure the efficiency of municipal transformation process of primary inputs, such as labour and capital, into activities capturing “operational performance” (see Borger and Kerstens (2000), and Agrell and West 2001)).
Figure 2. Modelling local sector production process
Primary inputs Activities Direct Outputs Consumer Outputs Objectives
(resources) (intermediate outputs) (results) (welfare improvements) (goals) Indicatores Transformation process Dimensions Measurement Process Indicators Efficiency Performance Indicators Technical Efficiency Effect Indicators Effectiveness
13 Local outputs may be generally categorised under the conceptual distinction proposed by Bradford, Malt and Oates (1969) between direct local outputs and outcomes demanded by citizens. These authors labelled the direct output as “D-output” and the outcomes demanded by citizens as “C-output”. For example, for police services, municipalities provide surveillance and traffic control. However, citizens ultimately care about safety and smoothness in the flow of travel (for other examples, see Bradford, Malt, and Oates (1969)). Under their model, the transformation of “D-output” into “C-“D-output” is affected by environmental factors such as “community composition”. For a concise explanation of this model, see Fisher (1996).
Conversely, performance indicators measure how those activities are transformed into direct outputs or results for consumption by citizens resulting from a comparison with other comparable units (Agrell and West (2001)). If only input/output quantitative data are available a technical approach is feasible (Lovell (2000)). Farrell’s “technical efficiency” is then defined as the ability of a unit to produce the maximum possible output from a given set of inputs, i.e., the ability to produce on its production possibility frontier, for a given production technology. If, in addition, resources prices are also
available, an economic approach is also feasible (Lovell (2000))14.
The performance indicators defined above do not capture the effectiveness of municipal service provision. In fact, if we consider the conceptual distinction proposed by Bradford, Malt and Oates (1969) between D-Output and C-Output, one may argue that citizens are more concerned about the outcomes/final results of the municipal activities than in the directly produced outputs. Therefore, outputs may not necessarily reflect the services desired by local residents.15 The ultimate outcome of these services is measured by effect indicators, which “reflect the degree to which direct outputs of municipal activities translate into welfare improvements” (de Borger and Kerstens (2000)).
In line with Farrell’s definition of efficiency and recent literature we will herein assume that municipal performance means the results/outcomes of local public policies, and
14 The performance of economic units is conventionally judged through the application of Farrell’s (1957) economic efficiency concept as being composed by two components: (i) technical efficiency and (ii) allocative efficiency. Accordingly, technical efficiency is defined as an economic unit “success in producing maximum output from a given set of inputs” (Farrell (1957)), being measured in terms of the physical relationship between observed output and the maximum attainable (feasible) output for the observed inputs. Differently, allocative or price efficiency reflects an economic unit “success in choosing an optimal set of inputs” (Farrell (1957)), i.e., the optimal choice of input proportions, given their respective prices and the production technology. The way inputs are combined to produce outputs is referred as ‘technology of production.’ This can be represented by a production function defining “the maximum output(s) attainable from a given vector of inputs” (Coelli, Rao Battese (2002)), i.e., it specifies the possible input combinations to produce a given level of output (Farrell (1957)).
15 According to Bradford, Malt and Oates (1969) model, C-Output depends both on the D-Output provided by local governments and on the characteristics of the community and the population (Z), factors often not directly controlled by local governments. For instance, “When the citizen votes on a police budget, however, he is primarily interested, not in the vector D, but rather in such things as the degree of safety from criminal activity and the smoothness and rapidity of the flow of traffic. As these depend only in part on D (…) and by certain environmental variables, such as the “propensity to riot” in the community and the driving habits of local residents” (Bradford, Malt and Oates (1969)).
spending municipal efficiency as the outcome relative to the spending inputs.16 Accordingly, one possible method for assessing efficiency of local public expenditures is to compare how well given expenditures (inputs) are transformed into local services. For that purpose, municipal expenditure and performance data must be assembled upon the basis of which one attempts to make inferences concerning the efficiency with which these spending inputs are translated into local services.
3.2 The FDH analysis
As mentioned before, a possible method for assessing efficiency of local public expenditures is to compare how well municipalities convert spending inputs into local “outputs”. However, for measuring the level of municipal efficiency we must prior estimate a production possibility frontier (PPF) of reference, relative to which each individual decision-making unit (DMU) – in our case, municipalities- will be evaluated in terms of how well it transforms spending inputs into outputs. This frontier will be constructed with the help of a non-parametric technique for production frontier estimation known as Free Disposal Hull (FDH),which reproduces the best combination of results within our sample.17 Some few other studies that apply FDH analysis to assess municipal spending efficiency include Eeckaut, Tulkens and Jamar (1993), De Borger et al. (1994) and De Borger and Kerstens (1996a, b).18
The relative municipal efficiency will be measured by efficiency scores, which measure the distance of individual observations relative to the estimated frontier. FDH analysis provides, therefore, a framework for ranking the efficiency of municipalities through comparison of their performance with the production frontier reflecting “best practices”.
The FDH analytical framework traces its origins to Farrell (1957) who developed an index of technical efficiency measured as the maximum equi-proportionate reduction in all inputs consistent with the production of observed outputs.19 Accordingly, a local
16 See, for example, Clements (2002), Tanzi and Schuknecht (2000), and Afonso, Schuknecht and Tanzi (2003).
17 Deprins, Simar, and Tulkens (1984) first introduced the FDH technology. Eeckaut, Tulkens and Jamar (1993), Fakin and Crombrugghe (1997), and Gupta and Verhoeven (2001) provide systematic accounts of this approach.
18 For a review of the existing empirical studies, see De Borger and Kerstens (2000). 19 See Coelli, Rao, and Battese (2002).
government can be technically inefficient if it is possible to provide the same level of outputs with the employment of fewer input resources. Therefore, technical efficiency reflects the ability of a DMU to produce along the production possibility frontier. If we use local expenditures as inputs, the measurement of relative performance of local governments may be labelled spending efficiency. Concerning the ability of local governments to “produce” the maximum attainable output at the lowest possible cost (expenditure), a local government is said to be input-inefficient relative to another local government when it provides the same or an inferior level of services with higher expenditures. Conversely, it will be said output-inefficient when, for a given level of expenditures, it provides less of all outputs than another “producer.”
As the maximum attainable output (or the “frontier” production function) is not directly observable, one has to estimate the frontier using a sample of observed inputs consumed and outputs produced as large and comparable as possible within the 51 municipalities located in RLVT. The procedure adopted in this paper is as follows. The first step was to establish a production frontier that shows, for each level of expenditures, the highest level of output (the “best practices”) observed among the municipalities in the sample. Then we ranked the inefficient producers located in the interior of the production possibility frontier according to their distance relative to estimated frontier.
The advantage of FDH analysis relative to other production frontier techniques is its ‘parsimonious’ approach to the construction of the production frontier.20 It does not depend, in contrast to parametric techniques, on a previous specification of a production function neither does it imply any restriction on the shape of the frontier, such as convexity which is assumed in Data Envelopment Analysis (DEA), another non-parametric technique. FDH approach envelopes the available data through a frontier, the only assumption of which is that inputs and outputs can be freely disposed of. For the same production technology, a continuous production frontier or free disposal hull can be established that maps any given input level with the highest possible level of output. This assumption easily allows one both to identify directly (see Lovell (2000)) the best practices in municipal spending. It allows evaluating the position of a particular observation relative to these best practices, thus making FDH particularly convenient
for the task at hand, where the DMUs in question are municipal authorities and the output is local goods and services provided to the public.21
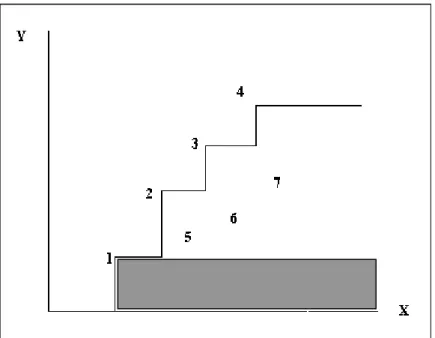
This approach has nevertheless also some disadvantages. Firstly, as a non-parametric approach, the production frontier is more heavily influenced by and indeed determined by (hence the categorisation as deterministic) outliers (see Eeckaut, Tulkens and Jamar (1993)). Secondly, we should mention the “weak vector dominance” limitation. Within the FDH methodology a given municipality is “efficient by default” when: it has the lowest level of spending; it does not dominate nor is dominated by other municipalities; or when there are no other comparable municipalities with better performance for at least one output (Eeckaut, Tulkens and Jamar (1993)). Figure 3 is a graphical representation of this problem, assuming the case of one input (x) and one output (y).
Figure 3. FDH possibility production frontier
In Figure 3, the segment line 1234 represents the FDH staircase frontier, corresponding to efficient observations because they are not dominated by any other observation, i.e., for these observations there are no other comparable units producing the same level of
21 According to Agrell and West (2001), underlying every performance analysis is the indirect assumption that “the behaviour of the decision-making unit (DMU) is coherent with organisational goals.” Thus, if one assumes “that the DMU may freely adjust the resources at his disposable to
output, with at least the same or less inputs. They will be called “un-dominated” units following Eeckaut, Tulkens and Jamar (1993).
For instance, unit 2 dominates unit 5 because the latter produces a higher level of output (y) with less input (x). By the same reasoning, unit 7 is dominated by units 3 and 4, whereas unit 3 dominates units 6 and 7. Now, if we consider unit 1 we directly observe that it cannot be compared to other units because it does not dominate nor is dominated by other units (this situation corresponds to the grey area in Figure 3). In fact, unit 1 it is neither more nor less efficient than the other units and in FDH methodology it will be declared “efficient by default”. Subsequently, and because it is unclear what is the exact meaning of those municipalities that the FDH labels “efficient by default”, it should be take into account “that nothing can be said about the relative efficiency of those municipalities” (cfr. De Borger et al. (1994)).
4. Non-parametric efficiency analysis of spending in RLVT 4.1 Total Municipal Performance (TMP) indicator
We use a “one input/one output” approach for measuring municipal spending efficiency. Accordingly, to proxy for the municipal resources consumption (input) induced by the provision of municipal services, we take for each municipality its total per capita expenditures registered on municipal accounts for year 2001.22
As a result, in our spending efficiency analysis we will not distinguish technical from allocative efficiency. However, as the measurement of the latter requires price information, while the former only requires quantity data (Lovell, 2000), selecting per capita municipal spending gives us at least the guarantee that all inputs will be considered in our analysis (De Borger and Kerstens (2000)). Additionally, this variable is a more realistic municipal input measure (see Fisher (1996), De Borger and Kerstens (2000) and Hayes, Razzolini and Ross (1998)) if we acknowledge the reduced margin of
accommodate given prices for input and outputs, the performance indexes may take technical, scale, allocative and cost efficiency into consideration.”
22 For instance Deller and Rudnicki (1992), on their empirical work about Maine’s public education services, the price of the selected service “administrative services” was proxied by “school expenditures on administration per pupil” variable.
manoeuvre of Portuguese municipal authorities to influence current expenditure choices, mainly those concerning municipal personnel salaries.
Concerning municipal outputs, we focus on global municipal performance stemming form the municipal provision of specific services (e.g., waste collection, road lighting, etc.). However, as we were confronted with the difficulty of directly measuring some of the municipal production results, some performance indicators are surrogate measures of municipal demand. For instance, the selected “Total resident population” and “Centrality index” indicators are used to capture the needs of local authorities to provide common basic administrative services, factors which are beyond the control of individual municipal authorities (see Athanassopoulos (1995)).
The selection of indicators was based upon two general arguments implied within our analysis. First, municipalities with similar demand for homogeneous services should also have similar performance (see Eeckaut, Tulkens and Jamar (1993) and Athanassopoulos (1995)). Second, performance of municipal governments can be measured in terms of the improvement of observable factors directly controlled by municipal governments during the time period under consideration.
In Table 3 we describe the selected performance indicators used to quantitatively proxy the results of individual municipal services provision. As suggested by several authors (see, for example, De Borger and Kerstens (1996b), Afonso, Tanzi and Schuknecht (2003)), to quantify a single municipal performance indicator all values of each sub-indicator mentioned in Table 3 were normalised by setting the average equal to 1. Then, we recalculate each sub-indicator relative to the overall average, giving them an equal weight. Finally, these sub-indicators were grouped under four five broader categories, giving to each sub-indicator an equal weight in order to compute a single municipal performance indicator.
Table 3. Sample output/outcome measures for selected municipal services
D-Output C-Output
Functions Local services Indicators Observations Indicators Observations
General Administration General administrative services provided to local residents
Total resident population Total municipal resident population is used to capture the needs of municipal authorities to provide common administrative services. See Eeckaut, Tulkens and Jamar (1993) and Wallis and Oates (1988). Present population divided
by total Resident population (*) General administrative services provided to
non-residents Resident population who came from other municipalities divided by total Resident Population (*)
Following De Borger et
al.(1994), we included this
proxy of municipal services delivered to non-residents.
(*) Natural Logarithm.
Education Basic Education School
buildings per capita
This indicator was calculated as the number of nursery and primary school buildings in percent of the total number of corresponding school-age persons.
Education attainment This indicator is proxied by the gross enrolment ratio in nursery and primary education as the number of enrolled students in percent of the total number of corresponding school-age persons. See Gupta et al. (1999).
Social activity
Social services for the elderly
Local residents with ≥ 65 years old
This indicator gives us the number of senior citizens, reflecting the supply of municipal social services to the elderly such as home-based general assistance, retirement houses, etc. See Eeckaut, Tulkens and Jamar (1993) and Wallis and Oates (1988).
Basic Sanitation
Water supply % Population
with clean water % Population with draining water systems % Population with water treatment stations
Water pumping, distribution and treatment is mainly municipal responsibility. Solid waste
collection
% Population served with solid waste collection % Buildings with solid waste collection
Solid waste collection is mainly municipal responsibility. Environment Protection Recycling activities Recycled Materials given or sold As a damaging environment translates into negative externalities, our intention is to assess environment protection municipal initiative through this indicator.
Adapted from Fisher (1996).
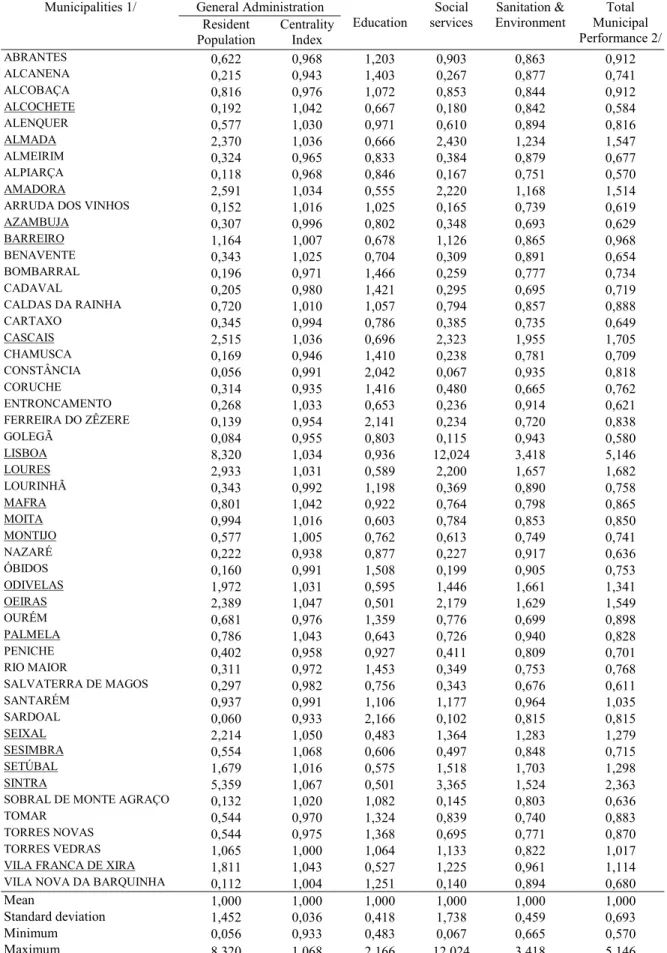
The municipal performance indexes and the Total Municipal Performance (TMP) indicator are reported in Table 4 (data sources are reported in the Annex).
Table 4. Total Municipal Performance (TMP) Indicator General Administration Municipalities 1/
Resident
Population CentralityIndex
Education Social services Sanitation & Environment Total Municipal Performance 2/ ABRANTES 0,622 0,968 1,203 0,903 0,863 0,912 ALCANENA 0,215 0,943 1,403 0,267 0,877 0,741 ALCOBAÇA 0,816 0,976 1,072 0,853 0,844 0,912 ALCOCHETE 0,192 1,042 0,667 0,180 0,842 0,584 ALENQUER 0,577 1,030 0,971 0,610 0,894 0,816 ALMADA 2,370 1,036 0,666 2,430 1,234 1,547 ALMEIRIM 0,324 0,965 0,833 0,384 0,879 0,677 ALPIARÇA 0,118 0,968 0,846 0,167 0,751 0,570 AMADORA 2,591 1,034 0,555 2,220 1,168 1,514
ARRUDA DOS VINHOS 0,152 1,016 1,025 0,165 0,739 0,619
AZAMBUJA 0,307 0,996 0,802 0,348 0,693 0,629 BARREIRO 1,164 1,007 0,678 1,126 0,865 0,968 BENAVENTE 0,343 1,025 0,704 0,309 0,891 0,654 BOMBARRAL 0,196 0,971 1,466 0,259 0,777 0,734 CADAVAL 0,205 0,980 1,421 0,295 0,695 0,719 CALDAS DA RAINHA 0,720 1,010 1,057 0,794 0,857 0,888 CARTAXO 0,345 0,994 0,786 0,385 0,735 0,649 CASCAIS 2,515 1,036 0,696 2,323 1,955 1,705 CHAMUSCA 0,169 0,946 1,410 0,238 0,781 0,709 CONSTÂNCIA 0,056 0,991 2,042 0,067 0,935 0,818 CORUCHE 0,314 0,935 1,416 0,480 0,665 0,762 ENTRONCAMENTO 0,268 1,033 0,653 0,236 0,914 0,621 FERREIRA DO ZÊZERE 0,139 0,954 2,141 0,234 0,720 0,838 GOLEGÃ 0,084 0,955 0,803 0,115 0,943 0,580 LISBOA 8,320 1,034 0,936 12,024 3,418 5,146 LOURES 2,933 1,031 0,589 2,200 1,657 1,682 LOURINHÃ 0,343 0,992 1,198 0,369 0,890 0,758 MAFRA 0,801 1,042 0,922 0,764 0,798 0,865 MOITA 0,994 1,016 0,603 0,784 0,853 0,850 MONTIJO 0,577 1,005 0,762 0,613 0,749 0,741 NAZARÉ 0,222 0,938 0,877 0,227 0,917 0,636 ÓBIDOS 0,160 0,991 1,508 0,199 0,905 0,753 ODIVELAS 1,972 1,031 0,595 1,446 1,661 1,341 OEIRAS 2,389 1,047 0,501 2,179 1,629 1,549 OURÉM 0,681 0,976 1,359 0,776 0,699 0,898 PALMELA 0,786 1,043 0,643 0,726 0,940 0,828 PENICHE 0,402 0,958 0,927 0,411 0,809 0,701 RIO MAIOR 0,311 0,972 1,453 0,349 0,753 0,768 SALVATERRA DE MAGOS 0,297 0,982 0,756 0,343 0,676 0,611 SANTARÉM 0,937 0,991 1,106 1,177 0,964 1,035 SARDOAL 0,060 0,933 2,166 0,102 0,815 0,815 SEIXAL 2,214 1,050 0,483 1,364 1,283 1,279 SESIMBRA 0,554 1,068 0,606 0,497 0,848 0,715 SETÚBAL 1,679 1,016 0,575 1,518 1,703 1,298 SINTRA 5,359 1,067 0,501 3,365 1,524 2,363
SOBRAL DE MONTE AGRAÇO 0,132 1,020 1,082 0,145 0,803 0,636
TOMAR 0,544 0,970 1,324 0,839 0,740 0,883
TORRES NOVAS 0,544 0,975 1,368 0,695 0,771 0,870
TORRES VEDRAS 1,065 1,000 1,064 1,133 0,822 1,017
VILA FRANCA DE XIRA 1,811 1,043 0,527 1,225 0,961 1,114
VILA NOVA DA BARQUINHA 0,112 1,004 1,251 0,140 0,894 0,680
Mean 1,000 1,000 1,000 1,000 1,000 1,000
Standard deviation 1,452 0,036 0,418 1,738 0,459 0,693
Minimum 0,056 0,933 0,483 0,067 0,665 0,570
Maximum 8,320 1,068 2,166 12,024 3,418 5,146
1/ The underlined municipalities (19) belong to the Lisbon Metropolitan Area, formally created by law 44/91. 2/ Each sub-indicator contributes with an equal weight (1/5) for the Total Municipal Performance indicator.
The municipal performance sub-indicators reported in Table 3 suggest the existence of large differences in performance across municipalities belonging to our sample, mainly for general administrative services provided to local residents proxied by “Total Population” sub-indicator and for social services proxied by “Population with ≥ 65 years old” sub-indicator. It is also interesting to notice that Lisbon is “best” in these two services and that Sintra is also in both cases the “second-best” municipality.
As expected, the highest values for “Centrality Index” sub-indicator 23 are recorded in those municipalities that belong to the Lisbon Metropolitan Area. On one hand, the sub-indicator “Present population divided by total Resident population” mainly favoured non-metropolitan municipalities performance, such as Constância and Ferreira do Zêzere. On the other hand, it was the other sub-indicator (“Resident population who came from other municipalities divided by total Resident Population”), which was determinant in identifying the “best” performers for “Centrality Index”, such as Sesimbra, Sintra, Seixal and Oeiras metropolitan municipalities.
We may interpret these findings as follows. First, if those municipalities, which strongly suffer from seasonal population movements for location specific reasons, as Constância and Ferreira do Zêzere, Rio Maior and Lisbon, finance their services mainly through taxation it may be the case that local residents subsidise the consumption of local services by non-residents. If instead of taxation, local services where mainly financed through user charges the “spill over effect” or the indirect subsidisation element would be reduced (see De Borger et al. (1994) and Cullis and Jones (1998)). Second, we may hypothesise that mobile citizens/consumers tend to move into those communities that have a bundle of services that best match their own preferences (see Tiebout (1956)). Then, we may also argue (see Grossman, Mavros and Wassmer (1999) that Sesimbra, Sintra, Seixal and Oeiras metropolitan municipalities were successful in terms of being perceived by mobile consumers as “effective substitutes” for other communities including central metropolitan city. Additionally, although metropolitan areas face more
23
The Centrality Index is computed using two ratios: first, by the ratio between mobile present population in a municipality and its resident population and second, the ratio between local residents that came from other municipalities and resident population for the municipality in question.
costly demands from either residents and non-residents, they favour from “factors such as greater economies of scale deriving from an enlarged population served by -and thus, able to contribute to- for such investments” (see Rowland (2000)), unlike non-metropolitan municipalities
Education performance is best in Sardoal, followed by Ferreira do Zêzere and Constância, all three municipalities belonging to the statistical area of Médio Tejo (NUT III), and within the tenth “best” municipalities for education performance none belongs to Lisbon Metropolitan Area.
Although registering the highest values in “School buildings per pupil” sub-indicator for education services, Ferreira do Zêzere, Constância and Sardoal municipalities also have the lowest number for “Residents with ≤ 9 years old” sub-indicator for the same services. In fact, we noticed that the tenth youngest municipalities within RLVT belong to the Lisbon Metropolitan Area. With the exception of Lisbon it is also in Lisbon Metropolitan Area’s municipalities where the tenth lowest values both for “School enrolment” and “School buildings per capita” sub-indicators for educational services were observed. These findings suggest further investigation in order to answer the following question: “Does the low performance in ‘Education’ observed in these municipalities derive from under-provision relative to the respective demand or from a decreasing demand for education services?”
“Sanitation & Environment” performance is highest in Lisbon, followed by capital Cascais and Oeiras. Notice that within the tenth “best” in the provision of these services, all of them correspond to Lisbon Metropolitan Area’s municipalities.
Finally, in what concerns the “total municipal performance” indicator (TMP), we notice that Lisbon Metropolitan Area’s municipalities lead with the tenth highest values, with Lisbon scoring with the highest of all (5.146), followed by Sintra (2.363), and Alpiarça with the smallest one (0.570).
4.2 Results of FDH analysis
We now compute the efficiency scores for the 51 Portuguese municipalities located in Lisbon and Vale do Tejo Region (RLVT) with the help of the FDH methodology. This allows us to estimate the extent of municipal spending that is “wasteful” relative to the “best-practice” frontier, measured as the distance of individual observations relative to that frontier.
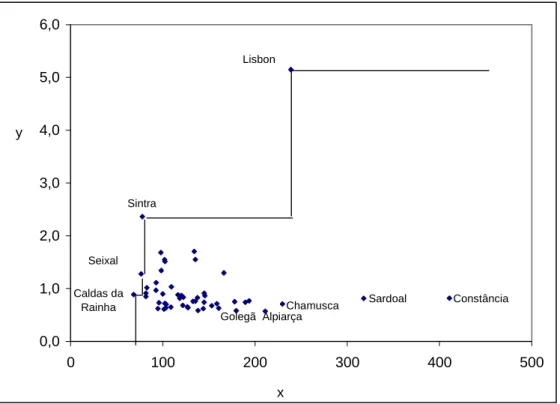
We use one input, measured by total per capita municipal expenditures (x) and one output given by the Total Municipal Performance (y) indicator previously computed (see Table 4). The production possibility frontier (PPF) for our set of municipalities is presented in Figure 4, through which we can observe that the most efficient RLVT municipalities, positioned along the PPF, are Lisbon, Sintra, Seixal and Caldas da Rainha. It is also possible to see that municipalities such as Golegã, Alpiarça, Chamusca, Sardoal and Constância are located well inside the PPF.
Figure 4. Production Possibility Frontier for RLVT municipalities
Caldas da Rainha Seixal Sintra Lisbon 0,0 1,0 2,0 3,0 4,0 5,0 6,0 0 100 200 300 400 500 Constância Sardoal Chamusca Alpiarça Golegã y x
Notes: y – Total Municipal Performance (TMP) indicator; x – Total annual per capita expenditure (euros).
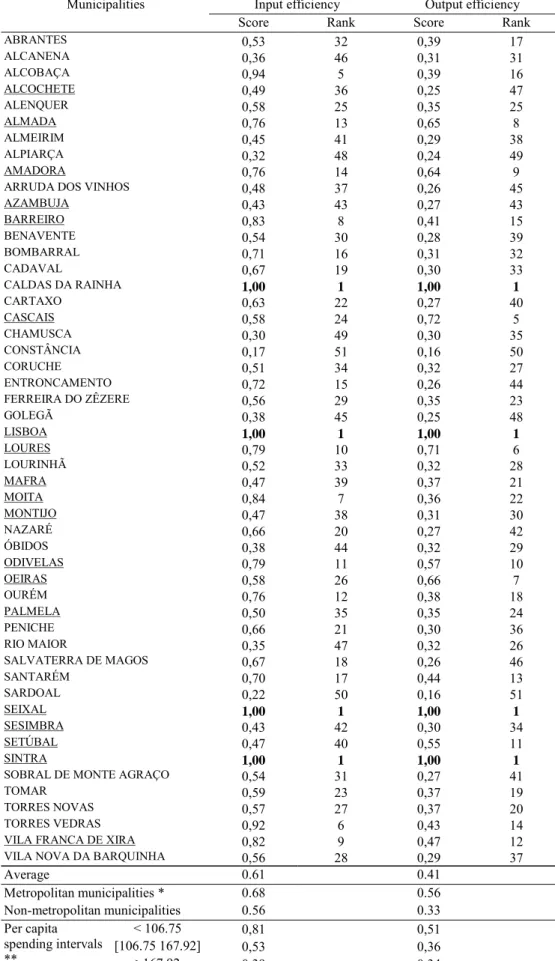
The results for the input and output efficiency scores, along with each municipality’s ranking, are presented in Table 5. We observe that input efficiency scores start at 0.17 (for Constância) and output efficiency scores start at 0.16 (for Contância and Sardoal). The average input efficiency score is 0.61, suggesting the municipalities could achieve on average roughly the same level of local output with about 39 per cent fewer resources, i.e., that local performance could be improved without necessarily increasing municipal spending.
Two interesting patterns are indicated in Table 5. First, “big municipalities” (those municipalities with per capita expenditures levels above the m+s/2 limit), tend to have lower efficiency scores than “small municipalities” (those with per capita expenditures levels below the m+s/2 threshold). Secondly, metropolitan municipalities, which were formally created by law 44/91, enjoy greater efficiency in the use of municipal resources than their non-metropolitan counterparts.
From Table 5 we actually observe some interesting variations in individual ranking positions when first considering input and then output efficiency results. For instance, non-metropolitan municipalities such as Entroncamento, Salvaterra de Magos, and Nazaré, strongly decrease their relative ranking positions when measuring output efficiency compared to theirs in input efficiency results. On the other hand, municipalities such as Setúbal, Rio Maior and Cascais strongly improve their relative ranking when one considers output efficiency instead of input efficiency.
Table 5. Efficiency scores in 2001 and Total Municipal Performance indicator Input efficiency Output efficiency Municipalities
Score Rank Score Rank
ABRANTES 0,53 32 0,39 17 ALCANENA 0,36 46 0,31 31 ALCOBAÇA 0,94 5 0,39 16 ALCOCHETE 0,49 36 0,25 47 ALENQUER 0,58 25 0,35 25 ALMADA 0,76 13 0,65 8 ALMEIRIM 0,45 41 0,29 38 ALPIARÇA 0,32 48 0,24 49 AMADORA 0,76 14 0,64 9
ARRUDA DOS VINHOS 0,48 37 0,26 45
AZAMBUJA 0,43 43 0,27 43 BARREIRO 0,83 8 0,41 15 BENAVENTE 0,54 30 0,28 39 BOMBARRAL 0,71 16 0,31 32 CADAVAL 0,67 19 0,30 33 CALDAS DA RAINHA 1,00 1 1,00 1 CARTAXO 0,63 22 0,27 40 CASCAIS 0,58 24 0,72 5 CHAMUSCA 0,30 49 0,30 35 CONSTÂNCIA 0,17 51 0,16 50 CORUCHE 0,51 34 0,32 27 ENTRONCAMENTO 0,72 15 0,26 44 FERREIRA DO ZÊZERE 0,56 29 0,35 23 GOLEGÃ 0,38 45 0,25 48 LISBOA 1,00 1 1,00 1 LOURES 0,79 10 0,71 6 LOURINHÃ 0,52 33 0,32 28 MAFRA 0,47 39 0,37 21 MOITA 0,84 7 0,36 22 MONTIJO 0,47 38 0,31 30 NAZARÉ 0,66 20 0,27 42 ÓBIDOS 0,38 44 0,32 29 ODIVELAS 0,79 11 0,57 10 OEIRAS 0,58 26 0,66 7 OURÉM 0,76 12 0,38 18 PALMELA 0,50 35 0,35 24 PENICHE 0,66 21 0,30 36 RIO MAIOR 0,35 47 0,32 26 SALVATERRA DE MAGOS 0,67 18 0,26 46 SANTARÉM 0,70 17 0,44 13 SARDOAL 0,22 50 0,16 51 SEIXAL 1,00 1 1,00 1 SESIMBRA 0,43 42 0,30 34 SETÚBAL 0,47 40 0,55 11 SINTRA 1,00 1 1,00 1
SOBRAL DE MONTE AGRAÇO 0,54 31 0,27 41
TOMAR 0,59 23 0,37 19
TORRES NOVAS 0,57 27 0,37 20
TORRES VEDRAS 0,92 6 0,43 14
VILA FRANCA DE XIRA 0,82 9 0,47 12
VILA NOVA DA BARQUINHA 0,56 28 0,29 37
Average 0.61 0.41 Metropolitan municipalities * 0.68 0.56 Non-metropolitan municipalities 0.56 0.33 < 106.75 0,81 0,51 [106.75 167.92] 0,53 0,36 Per capita spending intervals ** >167.92 0,39 0,34 * Underlined municipalities.
** Limits are computed with the following values: ]0; m-s/2[, [m-s/2; m+s/2] and ]m+s/2; +inf[, where m=137.33 and s=61.17.
One distinguishable feature between the above mentioned two groups of municipalities could be pointed out. Municipalities that perform better in terms of input efficiency, despite of registering on average levels of per capita expenditures 38 per cent below the overall average sample (137,33), report also, on average, a total performance indicator equivalent to 0.62, well below the average sample (1.0). Municipalities belonging to the latter group, despite of having on average levels of per capita expenditures 27 per cent above the overall sample average, also report on average a total performance indicator equal to 1.26, considerably higher than the former subset and also superior to the overall average sample (1.0).
An interesting result of our efficiency analysis is that, if instead of municipal per capita expenditures we had used total municipal expenditures as input measure, the average output efficiency score would have risen. Furthermore, a higher number of municipalities would be labelled efficient, but also would be higher the number of those declared efficient by default. This somehow implies means that this per capita “size dimension” implicit in our selected input measure is less conservative, and that it also captures better the uncontrollable demand-based dynamics of local provision.
5. Conclusion
In this paper we assessed the spending efficiency of the 51 RLVT municipalities. We first constructed a composite indicator of municipal performance, Total Municipal Performance index. Using that municipal performance indicator as an output measure and municipal per capita expenditure as the input measure, we then applied the FDH methodology to the data set.
The efficiency results measured in terms of input and output efficiency scores suggest that, on average, RLVT municipalities could be characterised as being relatively inefficient. Among the 51 municipalities assessed we found that they could have achieved, on average, roughly the same level of local output with about 39 percent fewer resources, i.e., that local performance could be improved without necessarily increasing municipal spending.
Considering both individual efficiency scores and ranking positions, we concluded that the results reveal a wide dispersion in performance of RLVT municipalities. Only 4 RLVT municipalities are considered to be efficient, of which only one (Lisbon) is declared “efficient by default” under the FDH methodology. Furthermore, we also found that “wasted” municipal spending in RLVT is, on average, higher within “big municipalities”, vis-à-vis average or smaller municipalities. Additionally, a higher degree of inefficiency seems to exist in the sub-set of “non-metropolitan” municipalities belonging to our sample.
Our results support the general argument that more spending does not necessarily translate into better local living standards. One may hypothesise that the actual Portuguese decentralisation process must be endowed of a rationale that promotes the improvement of spending efficiency based on comparison of Portuguese municipalities with clearly identified “best practices” benchmarks.
Concerning future work avenues, further analysis work could be done using also an alternative methodology (for instance Data Envelopment Analysis), as well as a more detailed approach could also be followed by using several inputs and several outputs, in order to check for the robustness of the results.24 Finally, the current paper could eventually be extended to the entire universe of the Portuguese municipalities or to other sub-samples of that universe.
References
Afonso, A. and St. Aubyn, M. (2003). “Non-parametric Approaches to Public Education and Health Expenditure Efficiency in the OECD,” mimeo, July.
Afonso, A.; Schuknecht, L. and Tanzi, V. (2003). “Public Sector Efficiency: An International Comparison,” ECB Working Paper nº 242, July.
Agrell, P. and West, B. (2001). “A caveat on the measurement of productive efficiency”, International Journal of Production Economics, 69, 1-14.
24
This sort of comparative analysis, still not very common in the literature, is done for instance by De Borger and Kerstens (1996a) and by Afonso and St. Aubyn (2003).
Athanassopoulos, A. (1995). “Goal Programming & Data Envelopment Analysis (GoDEA) for Target-Based Multilevel Planning: Allocating Central Grants to the Greek Local Authorities”, European Journal of Operational Research, 87 (3), 535-550.
Bird, R. and Vaillancourt, F. (1999). “Fiscal decentralization in developing countries: an overview”, in Bird, R. and Vaillancourt, F. (eds), Fiscal decentralization in developing countries, Cambridge, Cambridge University Press, 1-48.
Blair, H. (2000). “Participation and accountability at the periphery: democratic local governance in six countries”, World Development, 28 (1), 21-39.
Bradford, D.; Malt, R. and Oates, W. (1969). “The Rising Cost of Local Public Services: Some Evidence and Reflections”, National Tax Journal, 22 (2), 185-202. Bronchi, C. (2003). “The Effectiveness of Public Expenditure in Portugal”. OECD, Economics Department Working Paper 349.
Card, D. and Krueger, A. (1992). “Does School Quality Matter? Returns to Education and the Characteristics of Public Schools in the United States”, Journal of Political Economy, 100 (1), 1-40.
Clements, B. (2002). “How Efficient Is Education Spending in Europe?” European Review of Economics and Finance, 1 (1), 3-26.
Coelli, Tim; Rao, D. and Battese, G. (2002). “An Introduction to Efficiency and Productivity Analysis”, sixth edition, Massachusetts, Kluwer Academic Publishers. Cullis, J. and Jones, P. (1998). “Public Finance and Public Choice”, second edition. New York, Oxford University Press.
Davis, M. and Hayes, K. (1993). “The Demand For Good Government”, The Review of Economics and Statistics, 75, 148-152.
De Borger, B.; Kerstens, K.; Moesen, W. and Vanneste, J. (1994). “Explaining differences in productive efficiency: An application to Belgian Municipalities”, Public Choice, 80, 339-358.
De Borger, B. and Kerstens, K. (1996a). “Cost efficiency of Belgian local governments: A comparative analysis of FDH, DEA, and econometric approaches”, Regional Science and Urban Economics, 26, 145-170.
De Borger, B. and Kerstens, K. (1996b). “Radial and Nonradial Measures of Technical Efficiency: An Empirical Illustration for Belgian Local Governments Using an FDH Reference Technology”, The Journal of Productivity analysis, 7, 41-62
De Borger, B. and Kerstens, K. (2000). “What Is Known about Municipal Efficiency?” in: Blank, Jos L. T. (ed), Public Provision and Performance: contributions from efficiency and productivity measurement, Amsterdam, North-Holland, 299-330.
Deller, S. (1992). “Production Efficiency in Local Government: A Parametric Approach”, Public Finance, 47 (1), 32-44.
Deller, S. and Rudnicki, E. (1992). “Managerial efficiency in local government: Implications on jurisdictional consolidation”, Public Choice, 74, 221-231
Deprins, D., Simar, L., and Tulkens, H. (1984). “Measuring labor-efficiency in post offices,” in: Marchand, M.; Pestieau, P. and Tulkens, H. (Eds.), The performance of public enterprises: concepts and measurement. Amsterdam: North-Holland.
Eeckaut, P.; Tulkens, H. and Jamar, M.-A. (1993). “Cost Efficiency in Belgian Municipalities”, in: Fried, H.; Lovell, C. and Schmidt, S. (eds), The Measurement of Productive Efficiency – Techniques and Applications. New York, Oxford University Press, 300-334.
Fakin, B. and de Crombrugghe, A. (1997). “Fiscal adjustment in transition economies: social transfers and the efficiency of public spending: a comparison with OECD countries,” Policy Research Working Paper 1803. Washington, DC: World Bank.
Farrell, M. (1957). “The Measurement of Productive Efficiency”, Journal of the Royal Statistical Society Series A (General), 120 (3), 253-281.
Fisher, R. (1996). State and local Public Finance. USA, Irwin.
Grossman, P.; Mavros, P. and Wassmer, R. (1999). “Public Sector Technical Inefficiency in Large U.S. Cities”, Journal of Urban Economics, 46, 278-299.
Gupta, S. and Verhoeven, M. (2001). “The efficiency of government expenditure: Experiences from Africa,” Journal of Policy Modelling, 23, 433– 467.
Hayes, K.; Razzolini, L. and Ross, L. (1998). “Bureaucratic choice and nonoptimal provision of public goods: Theory and evidence”, Public Choice, 94, 1-20.
Kalirajan, K. and Shand, R. (1999). “Frontier Production Functions and Technical Efficiency Measures”, Journal of Economic Surveys, 13 (2), 149-172.
Krueger, A. (1997). “Experimental Estimates of Education Production Functions”, Working Paper 379. Princeton, New Jersey, Princeton University, Industrial Relations Section.
Lovell, C. (1993). “Production Frontiers and Productive Efficiency”, in: Fried, H.; Lovell, C. and Schmidt, S. (eds), The Measurement of Productive Efficiency – Techniques and Applications. New York, Oxford University Press, 3-67.
Lovell, C. (2000). “Measuring Efficiency in the Public Sector”, in: Blank, Jos L. T., (ed), Public Provision and Performance. Amsterdam, North-Holland.
Marlow, L. (1988). “Fiscal Decentralization and Government Size”, Public Choice, 56, 259-270.
Migué, J. and Bélanger, G. (1974). “Toward a general theory of managerial discretion”, Public Choice, 17, 27-43.
Moesen, W. (1994). “The Need for Performance Auditing in the Public sector and the Best-Practice Frontier”, European Journal of Law and Economics, 1 (4), 263-274. Mueller, D. (1989). Public Choice II.Cambridge, Cambridge University Press.
Musgrave, R. and Musgrave, P. (1989). “Public Finance in Theory and Practice”, 5th edition. USA, McGraw-Hill International
Niskanen, W. (1975). “Bureaucrats and politicians”, The Journal of Law and Economics, 18, 617-643.
Pereira, P. (1998). Regionalização, Finanças Locais e Desenvolvimento, ed. Ministério do Equipamento, do Planeamento e da Administração do Território, Lisbon.
Rojas, M. (2000). “Political contestability and economic performance: Mexico’s municipalities, 1989-1995”, in: Lloyd-Reason, L. and Wall, S. (eds). Dimensions of Competitiveness: Issues and Policies. United Kingdom, Edward Elgar Publishing Limited.
Rowland, A. (2001). “Population as a Determinant of Local Outcomes under Decentralization: Illustrations from Small Municipalities in Bolivia and Mexico”, World Development, 29 (8), 1373-1389.
Schwab, R. and Oates, W. (1988). “Economic Competition Among Jurisdictions: Efficiency Enhancing or Distortion Inducing?” Journal of Public Economics, 35, 333-354.
Schwab, R. and Oates, W. (1991). “Community composition and the provision of local public goods”, Journal of Public Economics, 44, 217-237.
Tanzi, V. and Schuknecht, L. (2000). Public Spending in the 20th Century: A Global Perspective, Cambridge: Cambridge University Press.
Tiebout, C. (1956). “A Pure Theory of Local Expenditures”, Journal of Political Economy, 64 (5), 416-424.
Wallis, J. and Oates, W. (1988). “Decentralization in the Public Sector: An Empirical Study of State and Local Government”, in: Rosen, H. (ed), Fiscal Federalism:
Annex – Data and Sources
Table A1. Original data set Municipalities Total resident population Population ≤ 9 years old Enrolled students in primary school Enrolled students in nursery school Nursery and primary school buildings Pop. ≥ 65 years old Present Pop. ABRANTES 42235 3507 1660 463 74 10008 40488 ALCANENA 14600 1302 606 275 33 2961 13957 ALCOBAÇA 55376 5831 2773 713 101 9459 56037 ALCOCHETE 13010 1410 548 142 11 2000 12596 ALENQUER 39180 4158 1708 552 65 6763 38061 ALMADA 160825 14891 7808 813 82 26945 156027 ALMEIRIM 21957 2078 991 249 21 4260 20880 ALPIARÇA 8024 688 311 109 7 1854 7754 AMADORA 175872 17144 8000 589 71 24611 168219
ARRUDA DOS VINHOS 10350 1041 386 139 19 1826 10105
AZAMBUJA 20837 1964 899 36 24 3856 20842 BARREIRO 79012 6723 3643 512 33 12484 74717 BENAVENTE 23257 2659 1217 312 18 3428 22214 BOMBARRAL 13324 1268 688 270 32 2874 12922 CADAVAL 13943 1225 531 207 34 3271 13603 CALDAS DA RAINHA 48846 5054 2425 647 84 8804 48330 CARTAXO 23389 2168 970 239 21 4270 22442 CASCAIS 170683 17019 9251 695 107 25757 164987 CHAMUSCA 11492 870 497 180 20 2638 11119 CONSTÂNCIA 3815 359 250 113 13 741 4622 CORUCHE 21332 1614 882 270 40 5323 20305 ENTRONCAMENTO 18174 2058 933 240 11 2613 17113 FERREIRA DO ZÊZERE 9422 803 445 188 36 2591 9781 GOLEGÃ 5710 518 215 85 5 1279 5440 LISBOA 564657 42422 30100 4200 335 133304 562692 LOURES 199059 20824 9019 1280 111 24394 191008 LOURINHÃ 23265 2432 1232 394 47 4094 22831 MAFRA 54358 5926 2334 724 88 8468 53097 MOITA 67449 7338 3431 407 37 8691 64245 MONTIJO 39168 3922 2025 249 33 6792 38170 NAZARÉ 15060 1451 801 128 15 2514 14596 ÓBIDOS 10875 1003 390 193 31 2204 10682 ODIVELAS 133847 12896 6264 672 57 16034 127817 OEIRAS 162128 15024 5989 495 64 24153 156197 OURÉM 46216 5055 2406 947 123 8600 45443 PALMELA 53353 5754 2389 219 46 8051 51696 PENICHE 27315 2786 1444 303 34 4555 26353 RIO MAIOR 21110 2107 857 433 60 3864 21473 SALVATERRA DE MAGOS 20161 1882 932 178 15 3806 19331 SANTARÉM 63563 5811 2765 849 103 13049 62563 SARDOAL 4104 342 192 101 15 1136 4102 SEIXAL 150271 16773 6929 429 59 15127 145287 SESIMBRA 37567 4190 1831 219 25 5513 37287 SETÚBAL 113934 11681 5673 476 48 16825 109698 SINTRA 363749 46284 18311 1882 191 37311 345669
SOBRAL DE MONTE AGRAÇO 8927 925 394 92 18 1613 8827
TOMAR 36908 3996 2004 805 89 9303 41988
TORRES NOVAS 36908 3289 1647 492 82 7705 35971
TORRES VEDRAS 72250 7473 3494 995 127 12564 70892
VILA FRANCA DE XIRA 122908 13696 5603 668 60 13586 117414
VILA NOVA DA BARQUINHA 7610 696 265 144 16 1555 7698
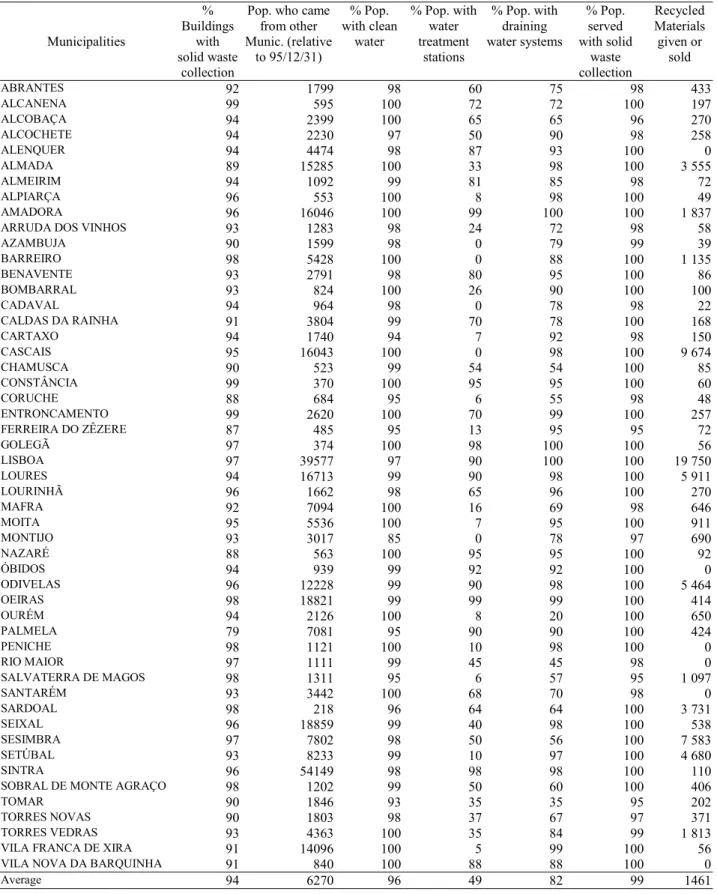
Table A1. Original data set (continued) Municipalities % Buildings with solid waste collection
Pop. who came from other Munic. (relative to 95/12/31) % Pop. with clean water % Pop. with water treatment stations % Pop. with draining water systems % Pop. served with solid waste collection Recycled Materials given or sold ABRANTES 92 1799 98 60 75 98 433 ALCANENA 99 595 100 72 72 100 197 ALCOBAÇA 94 2399 100 65 65 96 270 ALCOCHETE 94 2230 97 50 90 98 258 ALENQUER 94 4474 98 87 93 100 0 ALMADA 89 15285 100 33 98 100 3 555 ALMEIRIM 94 1092 99 81 85 98 72 ALPIARÇA 96 553 100 8 98 100 49 AMADORA 96 16046 100 99 100 100 1 837
ARRUDA DOS VINHOS 93 1283 98 24 72 98 58
AZAMBUJA 90 1599 98 0 79 99 39 BARREIRO 98 5428 100 0 88 100 1 135 BENAVENTE 93 2791 98 80 95 100 86 BOMBARRAL 93 824 100 26 90 100 100 CADAVAL 94 964 98 0 78 98 22 CALDAS DA RAINHA 91 3804 99 70 78 100 168 CARTAXO 94 1740 94 7 92 98 150 CASCAIS 95 16043 100 0 98 100 9 674 CHAMUSCA 90 523 99 54 54 100 85 CONSTÂNCIA 99 370 100 95 95 100 60 CORUCHE 88 684 95 6 55 98 48 ENTRONCAMENTO 99 2620 100 70 99 100 257 FERREIRA DO ZÊZERE 87 485 95 13 95 95 72 GOLEGÃ 97 374 100 98 100 100 56 LISBOA 97 39577 97 90 100 100 19 750 LOURES 94 16713 99 90 98 100 5 911 LOURINHÃ 96 1662 98 65 96 100 270 MAFRA 92 7094 100 16 69 98 646 MOITA 95 5536 100 7 95 100 911 MONTIJO 93 3017 85 0 78 97 690 NAZARÉ 88 563 100 95 95 100 92 ÓBIDOS 94 939 99 92 92 100 0 ODIVELAS 96 12228 99 90 98 100 5 464 OEIRAS 98 18821 99 99 99 100 414 OURÉM 94 2126 100 8 20 100 650 PALMELA 79 7081 95 90 90 100 424 PENICHE 98 1121 100 10 98 100 0 RIO MAIOR 97 1111 99 45 45 98 0 SALVATERRA DE MAGOS 98 1311 95 6 57 95 1 097 SANTARÉM 93 3442 100 68 70 98 0 SARDOAL 98 218 96 64 64 100 3 731 SEIXAL 96 18859 99 40 98 100 538 SESIMBRA 97 7802 98 50 56 100 7 583 SETÚBAL 93 8233 99 10 97 100 4 680 SINTRA 96 54149 98 98 98 100 110
SOBRAL DE MONTE AGRAÇO 98 1202 99 50 60 100 406
TOMAR 90 1846 93 35 35 95 202
TORRES NOVAS 90 1803 98 37 67 97 371
TORRES VEDRAS 93 4363 100 35 84 99 1 813
VILA FRANCA DE XIRA 91 14096 100 5 99 100 56
VILA NOVA DA BARQUINHA 91 840 100 88 88 100 0