Thesis presented as partial requirement for obtaining the master’s
degree in Information Management
GREEN ENERGY FOR SALE: WILLINGNESS TO PAY IN
THE COLLABORATIVE GREEN ENERGY CONTEXT
NOVA Information Management School
Instituto Superior de Estatística e Gestão de Informação Universidade Nova de Lisboa
GREEN ENERGY FOR SALE: WILLINGNESS TO PAY IN THE COLLABORATIVE GREEN ENERGY CONTEXT
By
Domenico De Fano
Thesis presented as partial requirement for obtaining the master’s degree in Information Management, with a specialization in Marketing Intelligence
Supervisor: Prof. Diego Costa Pinto, Ph.D. Co-Supervisor: Saleh Shuqair, Ph.D. candidate
GREEN ENERGY FOR SALE: WILLINGNESS TO PAY IN THE COLLABORATIVE GREEN ENERGY CONTEXT
Domenico De Fano
ABSTRACT
Although there is a growth of interest in the collaborative energy systems as a form of cleaner energy production, research did not explore the factors that influence consumers to compensate collaborative green energy. This study fills this gap by proposing a conceptual framework that integrates green perceived value, perceived customer effectiveness, trust, and perceived risk as the underlying determents to customers’ willingness to pay for collaborative green energy. Based on a quantitative survey with energy customers, we reveal that the green perceived value is the most significant predictor that influences a customer’s willingness to pay for the collaborative green energy. The results also reveal that the main antecedent of green perceived value is the social dimension; indeed, consumers are willing to buy more energy from a collaborative green energy user instead of an energy company. Our findings contribute to the literature on cleaner energy production and on collaborative providers of green energy.
Keywords: collaborative energy, decentralized energy system, green energy, cleaner
1. INTRODUCTION
Today, we have witnessed a growth in collaborative consumption business models (e.g., Airbnb, DoorDash, Uber) with nearly half of the global respondents have engaged in collaborative consumption activities (PwC, 2017). However, most research has focused on traditional collaborative consumption activities related to food delivery, transportation or short-term rentals; yet, there is a growth of interest in the collaborative energy systems (e.g., de Paulo & Porto, 2018).
The collaborative green energy system is viewed as an innovative way to provide green energy through the peer-to-peer mode of exchange (e.g., Belk, 2014). Unlike the traditional energy forms of exchange, the central idea of the collaborative energy system requires “peer-to-peer” activity of energy exchange, where individuals can provide others with energy in exchange for a fee. This type of exchange was proposed by the American company LO3 in Brooklyn in 2016. LO3 used Google Earth to identify houses with photovoltaic panels on the roofs, in order to engage with home-owners in small energy network, where users can independently produce energy and sell the surplus through an “energy community” (Mengelkamp 2017). For example, in Germany, Sonnen, the leading supplier of household batteries, has created a network of about 8,000 customers who exchange their stored energy between them (The New York Times, 2017). In addition, there were 281 collaborative green energy projects across 30 European countries accounting for an investment of € 1.8 billion (Colak et al., 2016, Lawrence et al., 2016).
However, research investigating the factors that predict customer willingness to pay towards the green collaborative energy market is a scant (Hansla et al., 2008; Zografakis et al. 2010). This study fills this gap by proposing a conceptual framework that integrates green perceived value, perceived customer effectiveness, trust, and perceived risk as the underlying determents to customers’ willingness to pay for collaborative green energy. Thus,
this paper aims to make enhance our understanding of how customer’s respond to the collaborative green energy production by offering theoretical and practical contributions to different streams of literature.
First, much of collaborative consumption studies, are mainly discussed within the peer-to-peer activities of sharing (Ert, Fleischer, & Magen, 2016; Guttentag, Smith, Potwarka, & Havitz, 2018; Tussyadiah, 2015; Guttentag, 2015), customers trust in collaborative consumption (Tussyadiah & Park, 2018), price regulations (Wang & Nicola, 2017) and collaborative authenticity (e.g., Shuqair, Pinto, & Mattila, 2019). However, although there is a growth of interest in the collaborative energy systems as a form of cleaner energy production, research did not explore the factors that influence consumers to compensate collaborative green energy.
Second, although the literature substantially contributed towards the understanding of the basics of customers’ willingness to pay towards renewable energy sources (Kim et al., 2012; Borchers et al., 2007; Soliño et al., 2009; Gracia et al., 2012), the green collaborative market is infancy phases. de Paulo and Porto (2018) made only brief remarks on the issue of green energy in peer-to-peer context, this investigation is still in the early phase, as such, conceptualizing and advancing the theory in this filed is worthwhile.
Third, recent literature suggests that customers’ trust can influence consumer’s behavior in collaborative consumption (Ert, Fleischer & Magen, 2016; Möhlmann, 2015; Sparks & Browning, 2011), reduces the perceived risk (e.g., Chen & Chang, 2012). Particularly in green production context (Chen, Bernard, & Rahman, 2019; Harris and Goode, 2010) or green branding (Chen, 2010). Therefore, we address the issue of customers trust and perceived risks in green collaborative energy by showing how different energy providers’ types can affect customers trust.
By doing so, we demonstrate the value of green perceived value, social value, customers trust, perceived customer effectiveness and perceived risk in a cleaner production context. We show that customers’ willingness to pay can be also affected by the green perceived value, and we identify the key drivers and dynamics towards customers’ willingness to pay from the collaborative green energy provider.
2. LITERATURE REVIEW
2.1 Collaborative Production and Consumption
The collaborative production and consumption business model refer to “the peer-to-peer-based activity of obtaining, giving, or sharing access to goods and services, coordinated through community-based online services” (Hamari, Sjöklint, & Ukkonen, 2015). This rapid explosion of collaborative consumption is a result of the latest technologies and peer-to-peer context which enabled peers to become micro freelancers (Belk, 2014).
According to Ertz, Durif, and Arcand (2018) collaborative consumption activities are divided into four streams: 1) The first examines forms of collaborative consumption; 2) The second analyzes collaborative consumption as a whole from an empirical perspective; 3) The third stream investigates modes of exchange and alternative consumption, second-hand purchases, online reselling or swapping; 4) and the fourth focuses on interactions. In the context of this paper, in our context, we mainly focus on the trading collaboration, where the collaborative energy service provider provides green energy towards other peers.
Collaborative consumption users may take pride in their willingness to try out new things, products, ideas, and technologies. Collaborative service providers rely on collaborative consumption commerce to supplement their income. Furthermore, collaborative consumption activities allow people to establish new relationships with other
peers and expand their social community (Dillahunt & Malone, 2015) in addition to try out new things.
One of the most important characteristics of collaborative consumption is a collaboration between the service provider and a customer, this collaboration is viewed as value co-creation. Benoit et al. (2017) have suggested that collaborative consumption activities help in value co-creation as ‘co-creation can occur between the platform provider and the customer, the platform provider and the peer service provider or the peer service provider and the customer. It occurs through shared inventiveness, co-design, or joint production of services’ (2017, p. 225). However, to our knowledge, specific customers’ behaviors in the collaborative green energy field have yet to be empirically validated and studied.
In this study, we propose a conceptual framework that integrates the green perceived value, perceived customer effectiveness, trust and perceived risk as the underlying processes towards willingness to pay from the collaborative green energy provider (Figure 1). In the following sections, we present each of the hypotheses as well as its theoretical background to stablish the relationships.
2.2 Green Purchasing
Green purchasing is defined as “the purchase of environmentally sustainable products, discarding all those products that produce direct or indirect damage to the environment” (Chan, 2001). There is emerging literature focusing on green products and consumer behavior (Antonetti & Maklan, 2014; Biswas & Roy, 2015; Rex & Baumann, 2007; Wang, 2014). As regards sustainable energy, people that already use green products are more likely to support green electricity (Ek & Soderholm, 2008). Besides, the literature clearly shows that customers exhibit positive willingness to pay attitude for green energy: several studies suggest that willingness to pay depends on the social status (Ma et al., 2015), Environmental concerns, altruism related and people's socio-economic profile and their energy consumption patterns (Mozumder,Vásquez, &, Marathe, 2011). For example, Kubli (2018) suggests that the current green users (electric cars and solar panels) exhibit a higher willingness to co-create flexibility than conventional energy users. Further, customers’ green behavior allows for efficient use of resources, thereby enhancing the significant potential of sustainability in collaborative settings (Cohen and Muñoz, 2016). Thus, in this paper, we build upon Borchers, Duke, & Parsons (2007) and Roe, Teisl, Levy, & Russell (2001) in order to estimate customers preferences for collaborative green sources and offer an additional empirical evidence about whether customers preference varies between specific and generic green energy sources, collaborative versus conventional.
2.3 Green Perceived Value
Perceived value refers to the customer’s opinion of a product’s value and it is a critical asset in the customer purchase behavior (Sweeney & Soutar, 2001). Babin (1994) divided
perceived value into two dimensions, utilitarian value, and hedonistic value. Green perceived value has a positive influence on the customer's opinion about a product or service (Sweeney and Soutar, 2001). It is considered as an important driver of consumers’ and producers’ decisions towards eco-friendly products (e.g., Chen & Chang, 2012; Sangroya, 2017), as customers are increasingly concerned about the environmental impacts of their purchases and thus are willing to pay higher prices towards environmental friendly products (REF), and influencing purchasing decisions (Chen and Chang, 2012). Therefore, we suggest that green perceived value of the collaborative green energy would influence customers’ willingness to pay.
H1: Green perceived value influences consumers' willingness to pay towards the
collaborative green energy provider.
2.4 Social dimension
In addition to the green perceived value dimensions, we suggest that the social value may also influence the green perceived value (Sweeney and Soutar, 2001; Sangroya et al., 2017). The social value is defined as “the perceived utility of an alternative resulting from its image and symbolism in association or disassociation with the demographics, socioeconomic and cultural-ethnic referent groups” (Smith & Colgate, 2007, p. 161).
The social value is a vital dimension of green perceived value, particularly in a collaborative energy framework. Douglas (2002) stated that consumers buy products not only for economic reasons but also to create and retain social relationships. As Salazar (2013) noted that social groups (family, friends and colleagues) positively influence the individual’s decision to use green products, and investments in green energy enhance the
individual’s positive self-image (Ek & Matti, 2014; Ozcan, 2014). For all these reasons, in a collaborative energy context, the following hypothesis is stated.
H1a: Social value is the major dimension of Green Perceived Value in a collaborative green
energy context.
2.5 Perceived Customer Effectiveness
Perceived customer effectiveness is defined as “consumers’ evaluation of the extent to which their consumption can make a difference in the overall problem” (Webster, 1975). A rich body of literature shows that perceived customer effectiveness is a potential predictor towards green consumption (Kim et al., 2012; Ellen et al., 1991), willingness to pay premium prices (Zhao et al., 2017) and it drives the engagement in eco-friendly behavior (Gleim et al., 2013, Gupta and Ogden, 2009). Besides, customers who have a high level of perceived customer effectiveness will show the high level of green purchasing (Jeonget al., 2014). However, in collaborative consumption, customer’s participation in using peer-to-peer services may depend on their perceptions of prosocial activities. That is, some customers engage in pro-social behavior, but others are engaged in collaborative activities because of the economic benefits (Eckhardt & Bardhi, 2015; Neoh, Chipulu, & Marshall, 2015) or enjoyment and pleasure (Hamari, Sjöklint, & Ukkonen, 2016), thus put the fourth hypothesis:
H2: Customer Perceived Effectiveness influences consumers' willingness to pay in a
collaborative green energy context.
2.6 Trust
In addition to the green perceived value and customer perceived effectiveness, we suggest that trust can be an additional underlying process towards a willingness to pay.
Trust is defined as a belief or expectation about the performance of such products (Chen, 2013). Several studies suggest that trust influences green buying intentions (Chen et al., 2012) because it increases customer’s confidence and reduces purchasing barriers (Bang et al., 2012, Gupta and Ogden, 2009). In collaborative consumption context, trust has been a key predictor towards purchasing intentions (e.g., Hawlitschek et al. 2016;) because it facilitates the interaction between peers (customers and collaborative service provider).
Kamal and Chen (2016) investigated trust towards the sellers for assurance system, stating that the major hindrance for sharing seems to be the lack of trust in sharing members; instead, Ert, Fleischer, and Magen (2016) linked trust to the reputation and attractiveness of the collaborative service provider (e.g., Airbnb hosts). However, in the present study, we suggest that customers trust in the collaborative green energy system can be a key predictor towards purchasing intentions and willingness to pay. As trust among stranger is a key challenge in all types of collaborative consumption platform (Horton & Zeckhauser, 2016) and due to the systematic review provided by ter Huurne et al. (2017), the paper clearly shows that the research on trust in the sharing economy is still scarce and thus, more research is needed to understand how trust is established in this context. Hence, we hypothesize the following:
H3: Customer trust predicts consumers' willingness to pay towards the collaborative green
energy context.
2.7 Perceived Risk
Perceived risk includes; psychological, physical, financial, social, and performance risk (Jacoby and Kaplan, 1972). Any purchasing decision involves risk (Rao et al., 2007) because it anticipates uncertainty (Sweeney et al., 1999). Drawing on the green perceived
risk (Chan and Chang, 2012) It is defined as “the expectation of negative environmental consequences associated with purchase behavior”. Perceived Risk can have implications for willingness to pay. For this reason, it will be really helpful to analyze as a factor in a context of collaborative energy, especially its influence on willingness to pay. This paper adopts the perceived risk, focusing on environmental, social and performance risks.
H4: Perceived Risk will influence consumers' willingness to pay in a collaborative green
energy context.
3. METHODOLOGY
We developed a survey instrument to test our research hypotheses. Collectively, the five research hypotheses are tested using a quantitative research with Partial Least Squares Structural Equations Modeling (PLS-SEM). The data was collected from an online panel with two hundred and twelve green energy consumers.
3.1 Measures
To investigate the relationship between the four drivers and willingness to pay in a collaborative green energy system, the study was designed after adopting measures of each variable based on previous studies. Given that, some measures of variables in the questionnaire are specifically adapted for the context of collaborative green energy, and the measures were rigorously validated before they could be used in further analysis. Thus, the measures were tested for content validity and reliability through the pre-testing of the questionnaire. This study measures the questionnaire items by means of “nine-point Likert scale from 1 to 9” rating from strong disagreement to strong agreement. The green perceived value survey items were adopted from Sangroya et al. (2018): e.g. “Using green
energy in the collaborative energy network (cen) would help me to feel accepted by others.”, “using green energy in the collaborative energy network would give me social approval.”, “I would use green energy only when the collaborative energy network will be easily available.”, “I will enjoy using green energy in the collaborative energy network (cen).”, “I will feel relaxed after using green energy in the collaborative energy network (cen).”, “using green energy in the collaborative energy network would make me feel good.”, “green energy will be reasonably priced in the collaborative energy network (cen).”, ”using green energy, in the collaborative energy network, offers value for money.” the scale for perceived risk was adapted from (Chen et al., 2013) and trust was assessed with items from De Cremer & Stouten, (2003): e.g. “I trust that others buy green energy in the collaborative energy network.”, “I do not trust that others will buy green energy in the collaborative energy network.”, “I think that others trust me to buy green energy in the collaborative energy network.”, “I think that others do not trust me to buy green energy in the collaborative energy network.”, “there is a chance that in the collaborative energy network will not work properly.”, “there is a chance that you would get an environmental penalty or loss if you join in the collaborative energy network..”, “there is a chance that using the collaborative energy network. will negatively affect the environment.”, “using the collaborative energy network would damage your green reputation or image.” finally, the scale for perceived customer effectiveness was adapted from Webster (1975): e.g. “it is futile for the individual consumer to do anything about pollution.”, “when I buy products, I try to consider how my use of them will affect the environment and other consumers.” Appendix 1 shows all the questionnaire items.
Two-hundred and twelve American customers of energy providers were invited to participate in this study in an online survey. Addressing the demographic profile of the sample, nearly 55% of respondents were from a young age group (18-25), 20% were aged from 26-34, and 18% from 35-44, with only 8% from the respondents being above 45 years old. More than half (56%) of the respondents were male and the remaining 44% females. Most of the respondents had university degrees, 57% bachelor’s degree and 38% postgraduate degrees, while only 5.2% had high school level education background.
To test the proposed research model, participants were presented with a questionnaire, following the study participation consent, the first section of the survey evaluates the effectiveness of the proposed scenario through a manipulation checks using two distinct images (the first represents a conventional energy form of exchange and the second shows a peer to peer energy form of exchange), in the second section are assessed all the items and finally, in the last section of the questionnaire, the demographic variables of the participants are evaluated. Besides, as a manipulations check, respondents will indicate the realism of the scenario.
4. RESULTS
To evaluate the willingness to pay the Structural Equations Modeling (SEM) was employed using the Partial Least Squares Structural Equations Modeling (PLS-SEM). This statistical technique estimates causal relations by combining statistical data and qualitative causal hypotheses (Dijkstra and Henseler, 2015). There are two types of SEM techniques: 1) covariance-based techniques and 2) and variance-based techniques. For this research, we used partial least squares (PLS), which is a variance-based technique, since it does not require a big sample, has no restriction on a normal distribution of the items and because the research model is considered complex. The analysis was completed adopting a
two-steps development: first, the measurement model was examined to ensure the reliability and validity of the research instrument, then, the analysis of the structural model to test the hypotheses.
4.1 Measurement Model
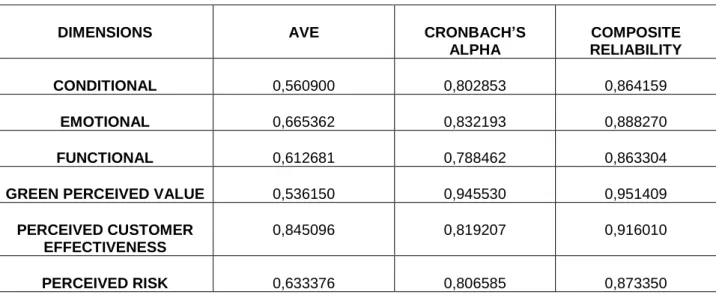
The first step of the analysis was to evaluate the measurement model, the first aspect to be observed of the measuring models are the Convergent Validities obtained by the observations of the Average Variance Extracted (AVEs). Therefore, when the AVEs are greater than 0.50 we can say that the model converges with a satisfactory result (Fornell & Larcker, 1981). The table shows all the AVEs are greater than 0.5.
The second step, after guaranteeing the Convergent Validity, is to observe the internal consistency values (Cronbach’s Alpha) and the Composite Reliability (CR). Table 2 demonstrates that the CA and CR values are adequate because CA values above 0.60 and 0.70 are considered fitting in exploratory studies and CR values of 0.70 and 0.90 are considered satisfactory (Hair et al., 2014). The table below, shows the Cronbach’s alpha, composite reliability and average variance extracted for all the measurement items.
Table 1. Reliability and convergent validity
DIMENSIONS AVE CRONBACH’S
ALPHA COMPOSITE RELIABILITY CONDITIONAL 0,560900 0,802853 0,864159 EMOTIONAL 0,665362 0,832193 0,888270 FUNCTIONAL 0,612681 0,788462 0,863304
GREEN PERCEIVED VALUE 0,536150 0,945530 0,951409
PERCEIVED CUSTOMER EFFECTIVENESS
0,845096 0,819207 0,916010
Furthermore, the Discriminant Validity (DV) of the SEM is evaluated, checking indicators with higher factorial loads in their respective Latent Variable (or constructs) than in others (Chin, 1998). Appendix 3 demonstrates that the factorial loads of the OVs in the original constructs (LVs) are always greater than the others, which it means that the constructs or latent variables are independent of one another (Hair et al., 2014). Additionally, another criterion to assess discriminant validity is to verify that the square root of the AVE is greater than the correlations coefficients between the constructs (Fornell & Larcker, 1981). The table below shows the results.
Table 2. Discriminant Validity
GPV PCE PR TRUST WTP GPV 0.732 PCE 0.536 0.919 PR 0.706 0.807 0.796 TRUST 0.781 0.609 0.688 0.743 WTP 0.736 0.357 0.581 0.567 0.867 4.2 Structural Model
As regards the structure models, the analysis of hypotheses and constructs’ relationships was done through the examination of the standardized paths. A bootstrapping with 500 resamples was used to estimate the path significance levels, based on Student
T-SOCIAL 0,693580 0,852223 0,900429
TRUST 0,508897 0,719123 0,795970
test values. In the first step of the structural analysis, the interrelation among construct is evaluated. The Student T-test must be over 1,96 to have significant values. Next, since we are dealing with correlations and linear regressions, we should evaluate if these relations are significant (p > 0.05). Therefore, it should be interpreted that for the degrees of freedom, values above 1.96 correspond to p-values > 0.05 (between -1.96 and +1.96 corresponding to the probability of 95% and 5% outside of this interval, in a normal distribution). The table below shows that only trust is rejected because has a t-test value smaller than +1,96.
Table 3. Bootstrapping results
Consequently, the significance of the cited relations is evaluated using the Bootstrapping module (re-sampling technique). It is used the configuration provided by Hair (2014), inserting the Missing Value Algorithm. This result provides support for all the hypothesis (H1,H2, H4, and H1a) except for H3.
Original Sample (O) Sample Mean Standard Deviation Standard Error (STERR) T Statistic CONDITIONAL -> GPV 0,295851 0,298125 0,016659 0,016659 17,759228 EMOTIONAL -> GPV 0,266985 0,265912 0,013076 0,013076 20,418025 FUNCTIONAL -> GPV 0,254459 0,255589 0,013814 0,013814 18,419756 GPV-> WTP 0,643464 0,575430 0,188680 0,188680 3,410345 PCE-> WTP -0,254749 -0,264962 0,120590 0,120590 2,112525 RISK -> WTP 0,344371 0,341761 0,012677 0,181103 1,901515 SOCIAL -> GPV 0,265215 0,262540 0,198031 0,012677 20,920987 TRUST -> WTP -0,017802 0,060025 0,198031 0,198031 0,089897
Figure 2. Results of structural equation modelling
Following SEM analysis, the GPV has the highest standardize regression rate. To sum it up, the result of this research is that in a collaborative green energy context, the willingness to pay for green energy is influenced by Green Perceived Value, and specifically, the Social dimension can raise the Green Perceived Value. In other words, the higher is Green Perceived Value the higher is Willingness to pay for green energy in a collaborative green energy system. Besides, it can be stated that the sample of this research is really willing to buy more energy from a user in a collaborative energy framework (Mwtp_user= 7,29) instead of an energy company.
Table 4. Results of structural equation modeling
Hypotheses Path
Coefficient
T Statistic P value Result
H1 0,643464 3,410345 p < 0.01 Supported
H3 -0,017802 0,089897 p = 0.895 Not significant
H4 0,344371 1,901515 p < 0.05 Supported
H1a 0,265215 20,920987 p < 0.01 Supported
Mediation Factors Analysis. In order to enhance our analysis of factors influencing willingness to pay in a collaborative green energy system, we have examined possible boundary conditions with the variables collected. The possible mediating effect of Trust, Perceived Risk and Perceived Customer Effectiveness on the willingness to pay through the GPV was also analyzed (Appendix 2). This analysis did not bring any results because the Sobel T statistic is below 1,96 and for this reason, there is not significant for the mediation effect (Sobel, 1982).
5. GENERAL DISCUSSION
5.1 Theoretical Implications
Empirical research provides deep insights on customer’s willingness to pay for renewable energy sources. Little is known on the collaborative green energy service provider type and the factors the predicts customers willingness to pay in collaborative consumption settings. This work deepens our understanding of the factors that influence willingness to pay in the collaborative green energy context.
First, results indicated that the proposed model has good explanatory power in predicting the willingness to pay and its antecedents in a collaborative green energy system. Hence, the main academic contribution is the original conceptual framework - using the theories of green perceived value, trust, perceived risk and perceived customer effectiveness - that could be useful for other researches in green consumption field applied
to collaborative settings. Moreover, it has been stated that in this context, the green perceived value major affects the willingness to pay, and this result provides further findings in the already extensive knowledge about the perceived value (Chen & Chang, 2012; Sangroya, 2018) giving a deeper understanding of the construct in a collaborative green energy framework. Researchers could examine these dimensions further with respect to other constructs related to consumer behavior. Then, due to the social impact as the main characteristic of a collaborative green energy system, the study adds further insights to the current literature, confirming the theories of Shao et al. (2017), which envisages the social aspect as the first factor influencing – directly or indirectly - the willingness to pay. Perceived Customer Effectiveness has a negative influence on the willingness to pay for collaborative green energy. This interesting result differs from previous theories on Perceived Customer Effectiveness (Zhao et al., 2017), emphasizing the consumers’ willingness to pay a higher price if they do not commit pro-environmental actions. Another noteworthy result is the positive influence of the perceived risk on the willingness to pay for collaborative green energy. This means that the higher is the perceived risk, the more consumers are willing to pay for collaborative green energy.
Our data clearly determines the willingness of consumers to adopt and pay for collaborative green energy although the perceived risk is high. Finally, research suggests trust can influence consumers' purchase intention (e.g., Chen, Bernard, & Rahman, 2019; Harris and Goode, 2010), reduces the risks related to willingness to pay or purchasing behavior; particularly in green production context (Chen et al., 2019) and green brand (Chen, 2010). However, in collaborative consumption, customers trust is influenced by the service provider personal photo “Airbnb host or Uber driver”, that is, the service provider photo acts as a brand name in influencing customers trust (Ert et al., 2016). We suggest that green collaborative consumption is a relatively new trend and the familiarity with such a concept could impact consumers’ trust (Hwang and Griffiths, 2017). Such findings are very important
in the context of green energy production “collaborative” as more and more networks are created via the Internet to share resources, cleaner energy is one the new emerging services (Mengelkamp, 2018). To encourage people to engage in cleaner production, new platforms, should know how to establish trust among peers. Especially for new community members who are not motived in engaging in green energy collaborative consumption. As trust may be particularly the case if consumers do not choose collaborative consumption such as Airbnb. However, as result of this research, in a collaborative green energy context, trust is a non-significant dimension, in statistical terms, to influence the willingness to pay, confirming the exigency to investigate the influence of trust in collaborative settings (ter Huurne et al. 2017) and, on the other hand, moving away from the theory of Horton & Zeckhauser (2016), which place trust as a crucial dimension in a collaborative system.
Second, this research project summarizes the literature on collaborative systems, identifying the main features of this framework. Furthermore, previous research on collaborative green energy systems mainly concerns the technical aspects (Hamari, Sjöklint, & Ukkonen, 2015; Giositas et al., 2018) and types of exchange platforms (Ertz & Durif, (2018) and few of them focus on consumer behavior (Guttentag et al., 2017; Ert, Fleischer, and Magen, 2016; Biggs, 2016). Therefore, this paper adds to the current stream of literature interesting insights on collaborative green energy systems.
5.2 Social and Practical Implications
Besides its substantial theoretical contributions, this study also reveals practical implications in a collaborative green energy system. From a practitioners’ point of view, results from this study confirm that the green perceived value is the most important factor that induces the consumer willingness to pay in a peer to peer energy context. Managers of collaborative energy systems should focus on the green perceived value, and specifically
the social dimension, in order to inspire the desire to adopt a collaborative system and to raise their willingness to pay for collaborative green energy. Moreover, since our findings suggest that customers trust may not predicts customers willing to pay, we recommend that the new collaborative energy platforms should focus on the two-sided review process in order to establish trust between both parties and facilitate the peers’ trust (Ert et al., 2016).
Moreover, the collaborative green energy system can be a solution for the environmental pollution problems. In this way the production of cleaner energy can grow in a dizzying way, increasing a pro-environmental sense of people, who will be able to monitor their consumption by adhering to a cleaner energy production and consumption system. With a global development of this system, the surplus of clean energy would allow more automated processes and ubiquitous artificial intelligence. The human energy released from the necessary work would, therefore, be used for new purposes. In such a future, production could move into global workshops (global and local) and other grassroots organizations.
Furthermore, traditional energy companies would still play a central role in a collaborative green energy system. In fact, they could benefit from a reduction in the cost of energy in order to allocate more investments for other eco-sustainable activities, and the collaboration with peer-to-peer networks can be the key to radically changing the clean energy production.
Furthermore, in the experiences of the collaborative economy, there is often particular attention to the inclusion of an element of sociality. This study confirms the power of social value, emphasizing the clear preference of consumers to purchase green energy from a user of the collaborative green energy system, rather than buying it from the national distributor. In other words, the results show that the social bond is the drive that leads people to collaborate, and the "meeting with the other" is built by the platform as an additional experiential and relational element in order to enrich what is basically a normal economic
transaction between people. In general, through collaborative models, people create a network, they know each other, they enjoy the pleasure of making an exchange without the intrusion of a vertical institution. In this sense, it can be said that the collaborative green energy platforms intrinsically have a social value, even when the exchange is mediated by money. The production relies on social relations rather than price or managerial strategies to allocate tasks and resources. Everything is organized by the community of producers themselves. It makes use value freely accessible, through new common property regimes (Orsi, 2009).
5.3 Limitations and Suggestions for Future Research
Like any other study, this study is also not without limitations. First, the collaborative green energy system is something ahead of time and the lack of clarity over boundaries between the concept of collaborative green energy, smart energy technologies and green technology (Biresselioglu et al., 2018) is a huge limit for people to understand this new energetic scenario.
Secondly, small sample size can cause some issues on generalizing the results to the larger target population. Nevertheless, according to Hair (2014), the PLS-SEM results are supported even if the sample size is small. Furthermore, the participants in this research had no restriction about age, since people with different age groups may have a different perception towards green energy consumption in a non-traditional energy system provider. With this being said, the same study applied in distinct countries with different cultures could generate interesting results and consequently, enrich the theoretical contributions.
Thirdly, future research could improve the original conceptual model provided, using other independent variables which affect the willingness to pay in a collaborative setting.
Then, according to the feedback received from the respondents of a pretest, the scale items may be rephrased in future studies, as it causes confusion in comprehending.
Finally, this research evaluates the factors influencing the willingness to pay in a collaborative green energy system without defining the purchase phase. Future research could use the conceptual model to define the willingness to pay in two different moments (pre and post-purchase phases) in order to define how and in what extent the Green Perceived Value, Perceived Risk, Trust and Perceived Customer Effectiveness affect the dependent variable.
REFERENCES
Abeliotis, K., Koniari, C., & Sardianou, E. (2010). The profile of the green consumer in Greece. International Journal of Consumer Studies, 34, 153–160.
Abramova, O., Shavanova, T., Fuhrer, A., Krasnova, H., Buxmann, P., & Abramova, O. (2015). Understanding the Sharing Economy: The Role of Response to Negative Reviews in the Peer‐to‐peer Accommodation Sharing Network. ECIS 2015 Proceedings.
Alanne K, Saari A, (2006). Distributed energy generation and sustainable development. Renew Sustain Energy Rev 2006;10(6):539–58.
P. Antonetti, S. Maklan, (2014). Feelings that make a difference: how guilt and pride convince consumers of the effectiveness of sustainable consumption choices.
Journal of Business Ethics, 124 (1) (2014), pp. 117-134
Babin, B.J., Darden, W.R., Griffin, M., 1994. Work and/or fun: measuring hedonic and utilitarian shopping value. Journal of Consumer Research. 644-656.
Bang, K.-H., Ellinger, E. A., Hadjimarcou, J., & Traichal, A. P. (2000). Consumer concern, knowledge, belief, and attitude towards renewable energy: An application of the reasoned action theory. Psychology & Marketing, 17, 449–468.
Bigerna S., Polinori P. Italian households' willingness to pay for green electricity. Renew Sustain Energy Rev, 34 (2014), pp. 110-121
Biggs c., A resource-based view of opportunities to transform Australia's electricity sector. Journal of Cleaner Production. 123 (2016) 203–217.
Biresselioglu M.E., Nilsen M., Muhittin Hakan Demir, Røyrvik J., Koksvik G. Examining the barriers and motivators affecting European decision-makers in the development of smart and green energy technologies. Journal of Cleaner Production. Volume 198, 2018. Pages 417-429.
Biswas, A., & Roy, M. (2015). Green products: an exploratory study on the consumer behaviour in emerging economies of the East. Journal of Cleaner Production, 87, 463-468.
Borchers A.M, J.M. Duke, G.R. Parsons. Does willingness to pay for green energy differ by source? Energy Policy, 35 (2007), pp. 3327-3334
Botsman, R., & Rogers, R. (2010). What’s mine is yours: The rise of collaborative consumption. New York: Harpers Collins.
Bridges, J., & Vásquez, C. (2018). If nearly all Airbnb reviews are positive, does that make them meaningless? Current Issues in Tourism, 21(18), 2057-2075.
Chan R.Y. (2010), Determinants of Chinese consumers’ green purchase behavior, Psychology & Marketing, 18 (4), 389-413.
Chekima B., Azizi S., Syed W., Wafa S., Aisat O., Chekima S., S. Laison Jr, (2016). Examining green consumerism motivational drivers: does premium price and
demographics matter to green purchasing. Journal of Cleaner
Production. 112 (2016), pp. 3436-3450.
Chen, Y. S., & Chang, C. H. (2012). Enhance green purchase intentions: The roles of green perceived value, green perceived risk, and green trust. Management Decision, 50(3), 502-520.
Chen YS, Chang CH, (2013). "Towards green trust: The influences of green perceived quality, green perceived risk, and green satisfaction", Management Decision, Vol. 51 Issue: 1, pp.63-82
Chin, W. W. (1998). The partial least squares approach for structural equation modeling. in Marcoulides, G.A. (Ed.). Modern methods for business research. London: Lawrence Erlbaum Associates, p. 295-236, 1998.
Cohen B., P. Muñoz P. (2016). Sharing cities and sustainable consumption and production: towards an integrated framework. Journal of Cleaner Production, 134 (2016), pp. 87-97
Colak I., Sagiroglu S., Fulli G., Yesilbudak m., Covrig C.F., 2016. A survey on the critical issues in smart grid technologies. Renew. Sustain. Energy Rev, 54 (2016), pp. 396-405
Dijkstra, T.K., Henseler, J. (2015). Consistent and asymptotically normal PLS estimators for linear structural equations. Comput. Stat. Data Anal. 81, 10–23 (2015a)
de Paulo, A. F., & Porto, G. S. (2018). Evolution of collaborative networks of solar energy applied technologies. Journal of Cleaner Production, 204, 310-320.
Dharshing S., Household dynamics of technology adoption: a spatial econometric analysis of residential solar photovoltaic (PV) systems in Germany, Energy Res. Soc. Sci., 23 (2017), pp. 113-124
Eckhardt, G. M., & Bardhi, F. (2015). The sharing economy isn’t about sharing at all. Harvard business review, 28(01), 2015.
Ek, K., Matti, S., 2014. Valuing the local impacts of a large-scale wind power establishment in northern Sweden: public and private preferences toward economic, environmental and sociocultural values. J. Environ. Plan. Manag. 58 (8), 1327e1345.
Ek, K., Soderholm, P., 2008. Norms and economic motivation in the Swedish green electricity market. Ecol. Econ. 68 (1), 169e182.
Ert, E., Fleischer, A. and Magen, N. (2016), “Trust and reputation in the sharing economy: The role of personal photos in Airbnb”, Tourism Management, Vol. 55, pp. 62-73 Fornell, C.; Larcker, D.F. Evaluating structural equation models with unobservable variables
and measurement error. Journal of Marketing Research. v.18, n. 1, p. 39-50, 1981. T.J. Gerpott, I. Mahmudova. Determinants of price mark-up tolerance for green electricity -
lessons for environmental marketing strategies from a study of residential electricity customers in Germany. Bus Strategy Environ, 19 (2010), pp. 304-318
Giotitsas, Pazaitis A., Kostakis, 2015. A peer-to-peer approach to energy production. Technology in Society 42 (2015) 28-38.
Gleim M.R., J.S. Smith, D. Andrews, J.J. Cronin Jr. Against the green: A multi-method examination of the barriers to green consumption, Journal of Retailing, 89 (1) (2013), pp. 44-61
A. Gracia, J. Barreiro-Hurlé, L. Pérez y Pérez. Can renewable energy be financed with higher electricity prices? Evidence from a Spanish region. Energy Policy, 50 (2012), pp. 784-794
Gupta S., D.T. Ogden. To buy or not to buy? A social dilemma perspective on green buying, Journal of Consumer Marketing, 26 (6) (2009), pp. 376-39
Guttentag, D., Smith, S., Potwarka, L., & Havitz, M. (2017). Why tourists choose Airbnb: a
motivation-based segmentation study. Journal of Travel Research,
0047287517696980.
Hair, J.F., Hult, G.T.M., Ringle, C.M., Sarstedt, M., 2017. A Primer on Partial Least Squares Structural Equation Modeling (PLS-SEM). Sage Publications.
Hamari, J., & Ukkonen, A. (2013). The Sharing Economy: Why People Participate in Collaborative Consumption. SSRN Electronic Journal. doi:10.2139/ssrn.2271971. Hansla A., Gamble A., Juliusson A., and Gärling T. (2008). "Psychological determinants of
attitude towards and willingness to pay for green electricity," Energy Policy, vol. 36, pp. 768-774.
Hartmann P., Apaolaza-Ibáñez V., (2012). Consumer attitude and purchase intention toward green energy brands: The roles of psychological benefits and environmental concern. Journal of Business Research. Volume 65, Issue 9, September 2012, Pages 1254-1263.
Hawlitschek, F., Teubner, T., Adam, M. T. P., Borchers, N., Möhlmann, M., & Weinhardt, C. (2016). Trust in the Sharing Economy: An Experimental Framework. ICIS 2016 Proceedings
Horton, J., & Zeckhauser, R. (2016). Owning, using and renting: Some simple economics of the ‘sharing economy’. NBER Working Paper No. 22029
Hur, W.-M., Kim, Y., Park, K., 2013. Assessing the effects of perceived value and satisfaction on customer loyalty: a “green” perspective. Corp. Soc. Responsib. Environ. Manag. 20 (3), 146e156.
Lv T, Ai Q. Interactive energy management of networked microgrids-based active distribution system considering large-scale integration of renewable energy resources. Appl. Energy 2016; 163:408–22.
Jacoby, J. and Kaplan, L.B. (1972), “The components of perceived risk”, in Venkatesan, M. (Ed.), Proceedings of the Third Annual Conference, Association for Consumer Research, Iowa City, Iowa.
Jeong, EunHa, SooCheong (Shawn) Jang, Jonathon Day, Sejin Ha. 2014. The impact of eco-friendly practices on green image and customer attitudes: An investigation in a café setting, International Journal of Hospitality Management 41, 10–20.
Kaenzig, S.L. Heinzle, R. Wüstenhagen Whatever the customer wants, the customer gets? Exploring the gap between consumer preferences and default electricity products in Germany, Energy Policy, 53 (2013), pp. 311-322
Kaenzig, S.L. Heinzle, R. Wüstenhagen, 2008. Understanding the Green Energy Consumer. Marketing Review St. Gallen, 2008 – Springer.
Kallbekken, S., Sælen, H. & Hermansen, E.T. 2013. Bridging the energy efficiency gap: a field experiment on lifetime energy costs and household appliances. Journal of Consumer Policy, 36, 1–16.
Kamal, P., & Chen, J. (2016). Trust in sharing economy. PACIS 2016 Proceedings
A. Kontogianni, C. Tourkolias, M. Skourtos. Renewables portfolio, individual preferences and social values towards RES technologies. Energy Policy, 55 (2013), pp. 467-476 Kubli M., Loock M., The flexible prosumer: Measuring the willingness to co-create distributed flexibility. Energy Policy, 114, 2018, pp. 540-548.
Lamberton C.P, Rose R.L, (2012). When ours is better than mine? A framework for understanding and altering participation in commercial sharing systems.
J. Mark., 76 (4) (2012), pp. 109-12
Lawrence T.M., M.C. Boudreau, L. Helsen, G. Henze, Mohammadpour
J., D. Noonan, Patteeuw D, T. Pless, Watson R.T., 2016. Ten questions concerning integrating smart buildings into the smart grid. Build. Environ, 108 (2016), pp. 273-283
Liang, L. J., Choi, H. C., & Joppe, M. (2018). Understanding repurchase intention of Airbnb consumers: Perceived authenticity, electronic word-of-mouth, and price sensitivity. Journal of Travel & Tourism Marketing, 35(1), 73-89.
Ma, C., Rogers, A. A., Kragt, M. E., Zhang, F., Polyakov, M., Gibson, F., ... & Tapsuwan, S. (2015). Consumers’ willingness to pay for renewable energy: A meta-regression analysis. Resource and Energy Economics, 42, 93-109.
Martin C.J. (2016). The sharing economy: a pathway to sustainability or a nightmarish form of neoliberal capitalism? Ecol. Econ., 121 (2016), pp. 149-159 Mathwick C., Malhotra N.K., Rigdon E., 2002. The effect of dynamic retail experiences on
experiential perceptions of value: An Internet and catalog comparison. J. Retail. 78 (1), 51-60.
Medium, 2017. Can the Brooklyn Microgrid project revolutionize the energy market? Urszula
Papajak.
[https://medium.com/thebeammagazine/can-the-brooklyn-microgrid-project-revolutionise-the-energy-market-ae2c13ec0341]
Medium, 2017, Solshare, the Startup for Sharing Solar Energy in Bangladesh. We Lab.
[https://medium.com/le-lab/solshare-the-startup-for-sharing-solar-energy-in-bangladesh-en-377002b21716]
Mengelkamp E., Gärttner j., Rock K., Kessler S., 2017. Designing microgrid energy markets. A case study: The Brooklyn Microgrid. Applied Energy 210 (2018) 870–880.
Mozumder, P., Vásquez, W. F., & Marathe, A. (2011). Consumers' preference for renewable energy in the southwest USA. Energy Economics, 33(6), 1119-1126.
Neoh, J. G., Chipulu, M., & Marshall, A. (2017). What encourages people to carpool? An evaluation of factors with meta-analysis. Transportation, 44(2), 423-447
Orsi C. (2009), Knowledge-based society: peer production and the common good. Cap. Class 33 (2009) 31–51.
Oskam, J., & Boswijk, A. (2016). Airbnb: the future of networked hospitality businesses. Journal of Tourism Futures, 2(1), 22-42.
Ozcan, M., 2014. Assessment of renewable energy incentive system from investors’ perspective. Renew. Energy 71, 425e432.
Papista, E., Krystallis, A., 2012. Investigating the types of value and cost of green brands: proposition of a conceptual framework. J. Bus. Ethics 115 (1), 75-92
Rao, S.S., Truong, D., Senecal, S. and Le, T.T. (2007), “How buyers’ expected benefits, perceived risks, and e-business readiness influence their e-marketplace usage”, Industrial Marketing Management, Vol. 36 No. 8, pp. 1035-45.
Rex, E., Baumann, H., 2007. Beyond ecolabels: What green marketing can learn from conventional marketing. Journal of Cleaner Production. 15 (6), 567e576.
Roe B., M.F. Teisl, A. Levy, M. Russell, (2001). US consumers' willingness to pay for green electricity. Energy Policy, 29 (2001), pp. 917-925.
Salazar, H.A., Oerlemans, L., Van Stroe-Biezen, S., 2013. Social influence on sustainable consumption: evidence from a behavioural experiment. Int. J. Consumer Stud. 37 (2), 172e180.
Sangroya D., J.K. Nayak, 2017. Factors influencing buying behavior of green energy consumer. Journal of Cleaner Production 151 (2017) 393-405.
Sheth, J. N., Newman, B. I., & Gross, B. L. (1991). Why we buy what we buy: A theory of consumption value. Journal of Business Research, 22(1), 159-170.
Shuquair S., Costa Pinto D., Mattila, A.S., (2019). The benefit of authenticity: Post-Failure loyalty in Sharing economy. Annals of Tourism Research.
Smith, J., Colgate, M., 2007. Customer value creation: a practical framework. J. Mark. Theory Pract. 15 (1), 7-23.
Sobel, Michael E. (1982). "Asymptotic Confidence Intervals for Indirect Effects in Structural Equation Models". Sociological Methodology. 13: 290–312.
M. Soliño, B. a Farizo, P. Campos. The influence of home-site factors on residents’ willingness to pay: an application for power generation from scrubland in Galicia, Spain. Energy Policy, 37 (2009), pp. 4055-4065
Sweeney, J.C., Soutar, G.N. and Johnson, L.W. (1999), “The role of perceived risk in the quality-value relationship: a study in a retail environment”, Journal of Retailing, Vol. 75 No. 1, pp. 77-105.
Sweeney, J.C., Soutar, G.N., 2001. Consumer perceived value: the development of a multiple item scale. J. Retail. 77 (2), 203-220.
ter Huurne M, Ronteltap A, Corten R, Buskens V (2017). Antecedents of trust in the sharing economy: A systematic review. J Consumer Behav. 2017; 485–498.
Tsai, S., 2005. Utility, cultural symbolism and emotion: a comprehensive model of brand purchase value. Int. J. Res. Mark. 22 (3), 277-291.
Walsh, G., Shiu, E., Hassan, L.M., 2014. Replicating, validating, and reducing the length of the consumer perceived value scale. J. Bus. Res. 67 (3), 260-267.
Wang, P., Liu, Q., Qi, Y., 2014. Factors influencing sustainable consumption behaviors: a survey of the rural residents in China. Journal of Cleaner Production. 63, 152e165. Webster F.E. Jr. Determining the characteristics of the socially conscious consumer,
Journal of consumer research (1975), pp. 188-196.
Williams, P., Soutar, G.N., 2009. Value, satisfaction and behavioral intentions in an adventure tourism context. Ann. Tour. Res. 36 (3), 413-438.
R. Zhao, Y. Geng, Y. Liu, X. Tao, B. Xue. Consumers’ perception, purchase intention, and willingness to pay for carbon-labeled products: a case study of Chengdu in China.
Journal of Cleaner Production. 171 (2018), pp. 1664-1671.
Zervas G., Prosepio D., Byers J. (2015). The rise of the sharing economy; Estimating the impact of Airbnb on the hotel industry. Journal of Marketing Research, 54(5), 687-705.
Zografakis N., Sifaki E., Pagalou M., Nikitaki G., Psarakis V., and Tsagarakis K. P., Assessment of public acceptance and willingness to pay for renewable energy sources in Crete. Renewable and Sustainable Energy Reviews, vol. 14, pp. 1088-1095.
APPENDIX 1: SCALES USED IN THE STUDY
How much do you currently pay for the electricity bills? (cost per month) _________
How much would you maximally pay for green energy from a user in the Collaborative energy network? (cost per month)
---
How much do you want to pay for the electricity bills in the Collaborative Energy Network? (cost per month) ________
Please indicate your level of agreement or disagreement with the following statements. Do you want to participate in the Collaborative Energy Network?
1 _ _ _ _ _ _ _ _ 9 NO YES
How willing would you be to buy more energy from your neighbor? 1 _ _ _ _ _ _ _ _ 9
How willing would you be to pay more for green electricity in the Collaborative energy network if the energy is sold by your neighbor?
1 _ _ _ _ _ _ _ _ 9
How willing would you be to pay more now in exchange for lower electric rates in the future? 1 _ _ _ _ _ _ _ _ 9
GREEN PERCEIVED VALUE (Sangroya et al., 2018) Factor 1: CONDITIONAL VALUE
I would use green energy in the Collaborative Energy Network if it is offered with a discount or with other promotional incentives.
I would use green energy in the Collaborative Energy Network if it is offered at a subsidized rate. I would use green energy only when the Collaborative Energy Network will be easily available. I would use green energy over conventional energy under unsustainable environmental conditions.
Factor 2: SOCIAL VALUE
Using green energy in the Collaborative Energy Network would help me to feel accepted by others. Using green energy in the Collaborative Energy Network would improve the way I’m perceived by others. Using green energy in the Collaborative Energy Network would make a good impression on others. Using green energy in the Collaborative Energy Network would give me social approval.
Factor 3: EMOTIONAL VALUE
I will enjoy using green energy in the Collaborative Energy Network. The business of green energy should be increased
I will feel relaxed after using green energy in the Collaborative Energy Network. Using green energy in the Collaborative Energy Network would make me feel good.
Factor 4: FUNCTIONAL VALUE
Green energy in the Collaborative Energy Network is well made for reducing environment distortion. Green energy has an acceptable level of standard of quality in the Collaborative Energy Network. Green energy will be reasonably priced in the Collaborative Energy Network.
TRUST (De Cremer and Stouten, 2003)
I trust that others buy green energy in the Collaborative Energy Network.
I do not trust that others will buy green energy in the Collaborative Energy Network. I think that others trust me to buy green energy in the Collaborative Energy Network. I think that others do not trust me to buy green energy in the Collaborative Energy Network.
PERCEIVED RISK (Chen et al., 2013)
There is a chance that in the Collaborative Energy Network will not work properly.
There is a chance that you would get an environmental penalty or loss if you join in the Collaborative Energy Network..
There is a chance that using the Collaborative Energy Network. will negatively affect the environment. Using the Collaborative Energy Network would damage your green reputation or image.
PERCEIVED CUSTOMER EFFECTIVENESS (Webster, 1975). It is futile for the individual consumer to do anything about pollution.
APPENDIX 2: MEDIATION FACTORS ANALYSIS
2A. PERCEIVED CUSTUMER EFFECTIVENESS AS MEDIATOR [GPV -> PCE -> WTP] Model (BOOTSTRAPPING)
Analysis:
DIRECT NO MEDIATOR: 0,735 DIRECT WITH MEDIATOR: 0,764 GPV -> PCE: 0.5385
PCE -> WTP: -0.0547
GPV -> PCE STANDARD ERROR: 5.3535 PCE -> WTP STANDARD ERROR: 0.6682
2B. PERCEIVED RISK AS MEDIATOR [GPV -> PR -> WTP]
Model (BOOTSTRAPPING)
Analysis:
DIRECT NO MEDIATOR: 0,735 DIRECT WITH MEDIATOR: 0,649 GPV -> PR: 0.7072
PR -> WTP: 0.1215
GPV -> PR STANDARD ERROR: 8.7817 PR -> WTP STANDARD ERROR: 0.9345
2C. TRUST AS MEDIATOR [GPV -> TRUST -> WTP]
Model (BOOTSTRAPPING)
Analysis:
DIRECT NO MEDIATOR: 0,735 DIRECT WITH MEDIATOR: 0,773 GPV -> TRUST: 0,7751
TRUST -> WTP: -0,0489
GPV -> TRUST STANDARD ERROR: 10,9189 TRUST -> WTP STANDARD ERROR: 0,2588
APPENDIX 3: CROSS LOADINGS CONDITI ONAL EMOTIO NAL FUNCTI
ONAL GPV PCE RISK SOCIAL TRUST WTP GPV_C1 0.771 0.631 0.618 0.682 0.207 0.430 0.475 0.495 0.615 GPV_C1 0.771 0.631 0.618 0.682 0.207 0.430 0.475 0.495 0.615 GPV_C2 0.722 0.559 0.546 0.636 0.244 0.434 0.512 0.495 0.501 GPV_C2 0.722 0.559 0.546 0.636 0.244 0.434 0.512 0.495 0.501 GPV_C3 0.810 0.684 0.720 0.762 0.302 0.444 0.595 0.525 0.582 GPV_C3 0.810 0.684 0.720 0.762 0.302 0.444 0.595 0.525 0.582 GPV_C4 0.763 0.603 0.624 0.710 0.361 0.476 0.623 0.522 0.578 GPV_C4 0.763 0.603 0.624 0.710 0.361 0.476 0.623 0.522 0.578 GPV_C5 0.671 0.528 0.574 0.647 0.558 0.613 0.602 0.597 0.552 GPV_C5 0.671 0.528 0.574 0.647 0.558 0.613 0.602 0.597 0.552 GPV_E1 0.651 0.800 0.698 0.750 0.293 0.479 0.621 0.660 0.589 GPV_E1 0.651 0.800 0.698 0.750 0.293 0.479 0.621 0.660 0.589 GPV_E2 0.664 0.832 0.728 0.768 0.321 0.469 0.619 0.500 0.528 GPV_E2 0.664 0.832 0.728 0.768 0.321 0.469 0.619 0.500 0.528 GPV_E3 0.618 0.799 0.683 0.745 0.417 0.543 0.664 0.705 0.462 GPV_E3 0.618 0.799 0.683 0.745 0.417 0.543 0.664 0.705 0.462 GPV_E4 0.694 0.831 0.702 0.776 0.352 0.551 0.642 0.514 0.534 GPV_E4 0.694 0.831 0.702 0.776 0.352 0.551 0.642 0.514 0.534 GPV_F1 0.622 0.657 0.762 0.722 0.299 0.480 0.642 0.603 0.487 GPV_F1 0.622 0.657 0.762 0.722 0.299 0.480 0.642 0.603 0.487 GPV_F2 0.665 0.690 0.803 0.753 0.411 0.497 0.630 0.534 0.568 GPV_F2 0.665 0.690 0.803 0.753 0.411 0.497 0.630 0.534 0.568 GPV_F3 0.693 0.702 0.825 0.783 0.512 0.625 0.678 0.662 0.594 GPV_F3 0.693 0.702 0.825 0.783 0.512 0.625 0.678 0.662 0.594 GPV_F4 0.605 0.648 0.738 0.692 0.426 0.548 0.574 0.469 0.535 GPV_F4 0.605 0.648 0.738 0.692 0.426 0.548 0.574 0.469 0.535 GPV_S1 0.615 0.642 0.667 0.744 0.556 0.584 0.832 0.645 0.497 GPV_S1 0.615 0.642 0.667 0.744 0.556 0.584 0.832 0.645 0.497 GPV_S2 0.641 0.643 0.648 0.745 0.475 0.542 0.818 0.583 0.537 GPV_S2 0.641 0.643 0.648 0.745 0.475 0.542 0.818 0.583 0.537 GPV_S3 0.591 0.640 0.650 0.721 0.444 0.508 0.801 0.577 0.431 GPV_S3 0.591 0.640 0.650 0.721 0.444 0.508 0.801 0.577 0.431 GPV_S4 0.652 0.674 0.722 0.790 0.490 0.565 0.879 0.638 0.552 GPV_S4 0.652 0.674 0.722 0.790 0.490 0.565 0.879 0.638 0.552 PCE_1 0.383 0.325 0.430 0.431 0.899 0.753 0.461 0.503 0.285 PCE_2 0.429 0.442 0.531 0.542 0.939 0.736 0.609 0.607 0.363 RISK1 0.402 0.421 0.498 0.490 0.661 0.760 0.495 0.497 0.426 RISK2 0.556 0.548 0.533 0.587 0.501 0.759 0.529 0.521 0.487 RISK3 0.515 0.532 0.558 0.569 0.678 0.818 0.501 0.563 0.419 RISK4 0.541 0.487 0.593 0.592 0.732 0.843 0.569 0.602 0.505 TRUST1 0.590 0.653 0.598 0.653 0.357 0.519 0.572 0.842 0.485 TRUST2 0.305 0.290 0.303 0.343 0.638 0.541 0.374 0.520 0.121 TRUST3 0.669 0.668 0.682 0.733 0.471 0.549 0.690 0.887 0.561 TRUST4 0.282 0.281 0.353 0.351 0.653 0.541 0.387 0.520 0.224 WTP_1 0.651 0.527 0.614 0.622 0.383 0.543 0.495 0.487 0.821 WTP_2 0.586 0.524 0.543 0.591 0.227 0.447 0.524 0.440 0.868 WTP_U SER 0.721 0.627 0.654 0.695 0.316 0.519 0.556 0.540 0.909