Do subsidies drive technical efficiency? The case of
portuguese firms in the agribusiness sector
Os subsídios geram eficiência técnica? O caso das empresas portuguesas no
setor do agronegócio
Silvia Ferreira Marques Salustiano1, Natália Barbosa2, Tito Belchior Silva Moreira3
1Instituto Federal de Educação, Ciência e Tecnologia Goiano (IF Goiano), Rio Verde (GO), Brasil. E-mail: silvia.salu@gmail.com 2Escola de Economia e Gestão (EEG), Universidade do Minho (UMinho), Braga (Minho), Portugal. E-mail:
natbar@eeg.uminho.pt
3Departamento de Economia, Universidade Católica de Brasília (UCB), Brasília (DF), Brasil. E-mail: titoeco@yahoo.com.br
How to cite: Salustiano, S. F. M., Barbosa, N., Moreira, Tito B. S. (2020). Do subsidies drive technical efficiency? The case of portuguese firms in the agribusiness sector. Revista de Economia e Sociologia Rural, 58(3), e216150. https://doi.org/10.1590/1806-9479.2020.216150
Abstract: Successive reforms in the Common Agricultural Policy (CAP), enlargements of the European Union (EU) and pressures in the public budget increase the need for empirical studies to assess the role of subsidies in shaping firms’ performance and, hence, to support policy-makers decisions and decision-making in the productive sector. This paper assesses whether subsidies affect the technical efficiency of 1,943 Portuguese agribusiness firms over 2007-2015. By applying stochastic frontier models and fixed-effects models, to calculate the average efficiency of these firms, the results show different effects of subsidies among agribusiness sectors. The stochastic frontier model revealed that the subsidies have a positive and significant impact on the technical efficiency of three sectors, animal production, manufacture of food, and manufacture of paper. Further, except for firms in the forestry and logging sector, Portuguese agribusiness firms had higher average efficiency levels when subsidised, which provides evidence that subsidies could be important and contribute positively to the technical efficiency of Portuguese firms.
Keywords: agribusiness, stochastic frontier, efficiency, subsidies.
Resumo: As sucessivas reformas na Política Agrícola Comum (PAC), os alargamentos da União Europeia (UE) e as pressões no orçamento público aumentam a necessidade de estudos empíricos para avaliar o papel dos subsídios na definição do desempenho das empresas e, dessa forma, apoiar os tomadores de decisões, tanto para definições de políticas públicas quanto para o setor produtivo. Este artigo avalia se os subsídios afetam a eficiência técnica de 1.943 empresas portuguesas do agronegócio no período de 2007 a 2015. Utilizaram-se modelos de fronteira estocástica e modelo de efeitos fixos para calcular a eficiência média dessas empresas. Os resultados mostram diferentes efeitos dos subsídios entre os setores do agronegócio. O modelo de fronteira estocástica revelou que os subsídios têm um impacto positivo e significativo na eficiência técnica de três setores: produção animal, fabricação de alimentos e fabricação de papel. Além disso, com exceção das empresas dos setores florestal e madeireiro, as empresas do agronegócio português apresentaram níveis médios de eficiência mais altos quando subsidiadas, o que fornece evidências de que os subsídios podem ser importantes e contribuir positivamente para a eficiência técnica das empresas portuguesas.
Palavras-chave: agronegócio, fronteira estocástica, eficiência, subsídios. 1 Introduction
Apart from being a major food and fibre supplier, agriculture is the main contributor to the rural vitality, because it generates employment and it prevents rural depopulation whilst keeping traditions alive (Organisation for Economic Co-operation and Development, 2013; McManus et al., 2012). While the abandonment of agricultural land represents significant
threats to the environment in terms of biodiversity and loss of natural capital (MacDonald et al., 2000; Cramer et al., 2008), it may also fuel negative socio-economic impacts in rural areas. Additionally, various activities and businesses are created and developed in sectors related to agriculture, resulting in the agribusiness sector.
To avoid the abandonment of agricultural land, rural depopulation, and to foster sustainable agricultural activities, Giannakis & Bruggeman (2015) highlight the importance of maintaining compensatory subsidies to farmers with permanent natural handicaps, to increase rural income and prevent the rural exodus. The Common Agricultural Policy (CAP) within the framework of the European Union, is the main political instrument designed to support and develop the Member States agriculture. Ever since its launch in 1962, CAP has gone through a series of reforms, which modify producers' decisions regarding the choices of inputs and production, affecting their economic performance (Zhu & Lansink, 2010; Giannakis & Bruggeman, 2015; Daugbjerg et al., 2005). Moreover, further enlargements of the European Union (EU) and the pressure on the public budget increase the need to investigate the impact of subsidies on the efficiency of production units. Hence, empirical studies, personal experiments, and reliable studies are essential for policymakers (Minviel & Latruffe, 2017) as well as for decision-making in the agricultural sector.
It is worth stressing that theoretical results on the link between subsidies and efficiency are rather ambiguous. If, on the one hand, subsidies can reduce the efforts of producers (Martin & Page Junior, 1983) or change their attitudes when facing risk (Serra et al., 2008) thereby resulting in a reduction of technical efficiency, on the other, one should expect that subsidies increase technical efficiency while offering producers the means to maintain cutting-edge technologies and to improve organisational efficiency (Roe et al., 2003; Zhu & Lansink, 2010; Zhu et al., 2012; Góral, 2015). In this light, empirical evidence unfolding the path (significantly negative, significantly positive, or not significant) of the observed effects is sensitive to how subsidies are specified in the studies (Minviel & Latruffe, 2017; Latruffe & Desjeux, 2016; McCloud & Kumbhakar, 2008). Due to controversial results found in the literature on subsidies and efficiency, several authors such as Serra et al. (2008), Kumbhakar & Lien (2010), Zhu & Lansink (2010), argue that investigating the effects of subsidies on efficiency is an essentially empirical matter.
Overall, available studies portray subsidies negatively associated with efficiency and productivity (Giannakas et al., 2001; Rezitis et al., 2003; Iraizoz et al., 2005; Karagiannis & Sarris, 2005; Zhengfei & Lansink, 2006). In contrast, there are also empirical studies whose results shed light on the positive impact of subsidies on technical efficiency and productivity (McCloud & Kumbhakar, 2008; Kumbhakar & Lien, 2010; Kumbhakar et al., 2014). Most of the studies are focused on the United States and Europe. However, efficiency analyses considering Portuguese firms operating in the agribusiness sector are quite rare (Giannakis & Bruggeman, 2015; Daugbjerg et al., 2005; Tranter et al., 2007), even though the recent dynamism of Portuguese agribusiness sector. In this context, to the best of our knowledge, this is the first study examining the effects of subsidies on technical efficiency of firms belonging to the Portuguese agribusiness sector, mainly firms in the sector of animal production, processing and preservation of meat, milk and its by-products, the animal feed production, logging, paper manufacture, and related products. To this end, we use the stochastic frontier model with panel data as well as the fixed effects model to calculate the average efficiency of the production units. The sample embodies data obtained in the Amadeus platform by selecting 1,943 firms whilst covering for nine years (2007-2015).
The remaining part of the paper is organised as follows. Section 2 discusses the relationship between subsidies and efficiency. Section 3 presents the data, empirical variables, and the two econometric approaches applied to estimate technical efficiency and its main explanatory factors. Section 4 provides the discussion on empirical results, while Section 5 presents the main conclusions and offers some research avenues for further work.
2 Subsidies and technical efficiency: Is there a link?
It is interesting to underline that research into the impacts of subsidies on the technical efficiency of productive units has stood out significantly in the last 10 years. Most of the studies have mainly addressed developed countries, especially Europe, Canada, and the United States, while there is somewhat restricted literature on the emerging countries about
this matter. The exception is only India, China, and Brazil to which there can be found some evaluating literature (Minviel & Latruffe, 2017). The empirical results differ not only in the context of the studies (e.g., country, period, level of education of producers and production types) but also on the data used (for example, number of production units, cross-section data or panel data) and also in what relates to the used methodology (for example, parametric or non-parametric approach). Moreover, the empirical results are not conclusive, as there can be found significant effects, both positive and negative, of subsidies on the firm’s technical efficiency, as well as effects without any statistical significance. Hence, the orientation of the subsidy-efficiency relationship found in the empirical literature may be related to a variety of factors, empirical contexts, data, and methodology used, so it is recommended some precaution when interpreting these results (Zhu & Lansink, 2010; McCloud & Kumbhakar, 2008; Minviel & Latruffe, 2017).
Overall, subsidies do not explicitly envision to improve efficiency, but rather increase productivity, promote environmental sustainability, animal health and welfare, and food safety, whilst improving the income of the producers or encouraging the production of certain resources, including environmental resources (European Union, 2013). The concepts of productivity and efficiency are two different phenomena (Coelli et al., 2005). While the productivity of a farm or firm refers to a given level of output per unit of input, the productive efficiency is to better decision-making processes. It can be classified as technical efficiency (TE) geared for input or output, whereas the allocative efficiency (AE) represents the ability of a firm to use inputs in optimal proportions, given their respective prices and production technology. Technical efficiency when input-oriented shows how a firm can reduce its costs or inputs without changing its production level. Otherwise, the measurement of TE can also be output-oriented when it analyses the amount of revenue that could increase without adding any input. The methodology for measuring efficiency was firstly used by Farrell (1957) and a more detailed treatment has been offered by Färe et al. (1985), Lovell (1996), Cooper et al. (2011).
Theoretical studies on the effects of subsidies on efficiency support either the negative or the positive impacts. The first may result from income effects, and it means that a stable income can distort investment decisions (Zhu & Lansink, 2010; Young & Westcott, 2000; Hubbard, 1998) and reduce incentives to produce efficiently. Insurance effects can exacerbate that result when producers are risk-averse. Any measure that reduces risk or increases the expected income will affect production (Burfisher & Hopkins, 2003; Lopez, 2001). Hennessy (1998) highlighted that the agricultural income support policies affect directly risk-averse producers' decisions in contexts of uncertainty. On the other hand, subsidies may also help to overcome those limitations that prevent an efficient restructuring or modernisation of firms. Therefore, firms may increase technical efficiency, thereby improving their production capacity, if they have available the financial resources to realise the required investments to maintain or update firm’s production technologies (Roe et al., 2003; Zhu & Lansink, 2010; Zhu et al., 2012; Góral, 2015).
Giannakis & Bruggeman (2015) investigated the factors that explain the different performance of agriculture among the 27 countries of the European Union (EU) for five years (2007-2011). It is one of the scarce studies that addressed the issue of efficiency in Portugal, which is why some results are used in this study. The investigation focused on the productivity indicators of labour and land, and also gross value added. The results pinpointed that the characteristics of the farming population, the location in more favourable environments, and financial investments do have significant effects on the economic performance of the agricultural sector. The research has shown that the odds of achieving high economic performance are almost 9 times higher for those countries with a highly trained young agricultural population, namely the Netherlands (72%) and Germany (69%) than countries where farmers hold a poor rural training and there is a high proportion of farmers with more than 55 years, for example in Portugal (72%), Bulgaria (66%) and in Italy (64%). These countries are 92% less likely to be outperforming. It is also of paramount importance to note that environmental conditions did also show significant impacts, such as the countries with a high share of agricultural land used in less-favoured areas are 94% less likely to achieve high performance. This is the case of countries where the participation of
agricultural area used in Less Favoured Areas (LFA) is greater than 50% as in Portugal (92%) in Spain (82%) in Greece (78%) and Malta (100%). Another important issue is the economic disparities among EU members. The results suggested that countries displaying high economic performance are those who receive greater financial support to stimulate rural exploitation, such as Denmark (23,665 euros/farm), Luxembourg (17,700 euros/farm), and France (17,185 euros/farm). These countries are 17 times more likely to achieve high performance as compared to countries displaying a low-performance level. The wide variation in government support to rural income deteriorates further the position of the agricultural regions with chronic structural constraints and with small economies of scale. As per Smit et al. (2001), the high economic resources increase adaptive capacity, while the lack of these financial resources limits the ability to adapt to adverse conditions.
3 Data, empirical variables, and econometric approach
The latest techniques used to measure the efficiency and its relationship with subsidies refer to the parametric frontier and non-parametric frontier. The most popular non-parametric approach is Data Envelopment Analysis (DEA) which does not impose restrictions while specifying functional forms of production and restrain from making assumptions about one side of the error term because the non-parametric frontiers use approaches of linear programming. This is consistent with the line of thought as offered by Charnes et al. (1978), Fried et al. (2008) and Cooper et al. (2011). Indeed, the parametric frontier approach imposes constraints on the specification of the functional form of production and materialises assumptions about the unilateral distribution of the error term. The most common functional forms are the translog production function and Cobb-Douglas. Another distinction between the two models is that the non-parametric frontier is deterministic, while the parametric frontier is stochastic. Deterministic frontiers assume that all deviations from the frontier are the result of the inefficiency of the decision-makers, while in the stochastic frontier, it is assumed that part of the bypass is due to random shocks (reflecting on measurement errors and statistical noise) and part is due to the firm-specific inefficiency (Førsund et al., 1980; Battese, 1992; Coelli et al., 1998, 2005; Ajibefun, 2008; Greene, 2008).
The parametric frontier uses an econometric model to estimate the parameters of the stochastic frontier production function and also the model that affects inefficiency. The major advantage of the stochastic frontier approach is the introduction of a stochastic variable representing exogenous shocks, such as statistical noise, measurement errors,
etcetera, which is not part of the component inefficiency and they are not beyond the control
of the production unit. The parametric approach proves to be more applicable to the productive sector than a non-parametric approach, because the production units are subject to uncertainties (Battese & Coelli, 1995).
3.1 Data
Data were collected from Amadeus and SABI (Analysis of Iberian Balance Sheets) databases and withdrawn from the balance sheets of 1,943 Portuguese agribusiness firms. These databases cover the population of Portuguese firms as they encompass all firms that are obligated to report balance sheets and financial results. Therefore, our sample comprises all firms in the database with available information on the selected empirical variables, which could be seen as representing adequately the population of Portuguese firms in the agribusiness sector. Specifically, the sample gathers 208 firms from the manufacture of the paper sector, 18% (37) of which have been subsidised, 563 firms from the forestry and logging sector, of which 25% (140) have been allocated subsidies, 442 firms from the manufacture of food sector (processing and preserving of meat, dairy products, and prepared animal foods), of which 30% (134) have received subsidies, and 730 firms from the livestock industry sector (raising of swine, poultry, dairy cattle, sheep and other animals) of which 56% (408) have been subsidised.
For each sampled firm, we obtained a series on nominal values of operating revenue, intermediate inputs, and factor inputs (labour and capital) over the period 2007-2015.
Additionally, data on public subsidies and exports were collected from SABI. As both databases use the same firm identifier, matching the data proved to be an easy and reliable task.
The monetary values are calculated in euros and they were properly deflated using the GDP deflators for deflating the operating income, Gross Fixed Capital Formation to deflate capital and materials, the wages were deflated using the Private Consumer index, whereas we used the Public Consumption index to deflate the subsidies and the export used its respective index. Table 1 summarises the definition of each variable used in the empirical analysis and the respective descriptive statistics.
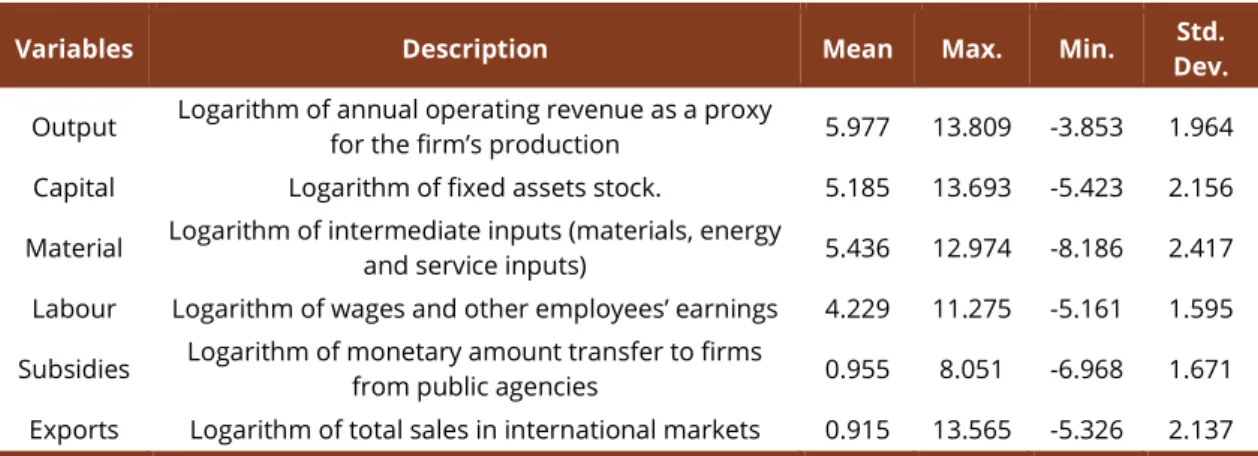
Table 1 – Variables description and descriptive statistics.
Variables Description Mean Max. Min. Dev. Std.
Output Logarithm of annual operating revenue as a proxy for the firm’s production 5.977 13.809 -3.853 1.964
Capital Logarithm of fixed assets stock. 5.185 13.693 -5.423 2.156
Material Logarithm of intermediate inputs (materials, energy and service inputs) 5.436 12.974 -8.186 2.417 Labour Logarithm of wages and other employees’ earnings 4.229 11.275 -5.161 1.595 Subsidies Logarithm of monetary amount transfer to firms from public agencies 0.955 8.051 -6.968 1.671 Exports Logarithm of total sales in international markets 0.915 13.565 -5.326 2.137 Notes: Monetary variables are in the 2011 prices.
The descriptive statistics (Table 1) show the heterogeneity of firms under scrutiny, when observing the values of the standard deviation, mainly for exports and subsidies variables. This is an expected result since they involve different phases of the production chain. As released in Appendix 1, the manufacture of food and manufacture of paper sectors, besides their being far more labour intensive, capital, and material display an export average of (1.862) and (2.684) respectively. These values are far beyond the average as achieved by the other two sectors, animal production (0.302) and forestry and logging (0.321). Another relevant issue is the average of subsidies for firms in different sectors. At the beginning of the production chain, animal production (1.535) and forestry and logging (0.628) are far superior to the average of subsidies for firms operating the manufacturing sectors, namely manufacture of food (0.683) and manufacture of paper (0.377).
Table 2 – Correlation coefficients among selected variables
Variable Output Capital Material Labour Subsidy Exports
Output 1 Capital 0.687 1 Material 0.888 0.558 1 Labour 0.848 0.659 0.690 1 Subsidy 0.088 0.289 0.036 0.059 1 Exports 0.549 0.433 0.484 0.556 0.042 1
Looking at the correlation among empirical variables, Table 2 summarises some high correlations between the inputs. Nonetheless, it does not represent a problem because the main interest of this research is not to estimate the contribution of each input to the production. In this light, the correlations do not indicate the existence of any significant econometric problem.
3.2 Econometric approach
To analyse the efficiency of productive units of the Portuguese agribusiness sector, this study has resorted to the Stochastic Frontier method of evaluation of efficiency, which is based on regression analysis for Maximum Likelihood. This method defines a specific functional form for a firm's technology and a probability distribution for the coefficient of efficiency and regression error (Bauer et al., 1998). As for the former one, it used the translog functional form, and as for the probability distributions, we opted for the half-normal one.
It should be noted that the results in terms of inefficiency obtained under certain conditions may actually offer more consistent values. Bauer (1990) and Rossi & Ruzzier (2000) propose a set of criteria to evaluate whether the estimated inefficiency obtained according to different models are consistent with each other, that is, comparing levels of inefficiency among the surveyed units. Therefore, we used the stochastic frontier model and the fixed effects model for analysing the effects of subsidies on the efficiency of firms.
Among the frontier methods for the assessment of efficiency, the stochastic statistical method is based on an econometric estimation technique, in which the deviations observed in the existing frontier are the result of both trends of random factors, which the firm does not control for, and the statistical noise. In this analysis, we used the method of the stochastic frontier through the measurement of total production, given the firm’s operating revenues.
Whilst appraising the technical efficiency of the Portuguese firms operating in the agribusiness sector, the study used a production function, which assumes a stochastic production frontier model embodying technical effects that affect the component inefficiency. Also, we used a logarithmic transformation for all variables of the equation.
The specification of the production function is taken from the Cobb-Douglas family and we used a normal model-half-normal for the error structure. The normal components of random errors show zero mean and variances depending on the effects of the firms. The error components of inefficiency are independent of the random error components, with variations depending upon a set of technical effects, according to Aigner et al. (1977), Kumbhakar & Lovell (2003), Coelli et al. (2005), Greene (2008) and Fried et al. (2008). The model materialises into the following equation:
'
lnyit=x βit +vit−uit i 1= …, , ,I
Where yi represents the log of the outputs of the firms’ sample, xi is a vector containing K x 1 logarithm of the inputs, β is a vector of unknown parameters (elasticities of inputs), the
( )
~ , 2
i vi
v N 0σ are the components of random errors which are independent of the inefficiency
errors components ~
( )
, 2i ui
u N 0+ σ . The total component error is
i v ui i
ε = − . Based on the stochastic frontier model, the technical efficiency of the firms’ sample is given by
( )
{
}
|Ei=E exp u ε− i i .
Alternatively, the efficiency analysis can be realised by using the regression models applied to Panel data. This analysis can substantially improve the quality of the estimates, in particular, because over time, it allows the analysis of the efficiency of firms; moreover, it permits more accurate estimates as it allows to incorporate fixed and individual random effects. Finally, the main gain in using panel data is to offer consistent estimators of the individual parameters of efficiency (Kumbhakar & Lovell, 2003).
The fixed-effects model, the calculation of average efficiency is computed according to Kumbhakar et al. (2015, p 244). This model assumes that the most efficient unit in the sample is 100% efficient and thus, it is considered as the reference for the calculation of the average efficiency of the other production units. In this study, subsidies are used as a contextual factor, that is, as an explanatory variable of production and technical efficiency as found in several publications such as empirical studies by Zhu & Lansink (2010), Bojnec & Latruffe (2013), Kumbhakar et al. (2014) and Sipiläinen et al. (2014).
4 The impact of subsidies on the firm’s technical efficiency
We estimated alternative empirical models to assess whether public subsidies can boost agribusiness firms’ technical efficiency. Table 3 shows the estimation results of firms’ production function based on the fixed-effects model, while Table 4 displays the estimates based on a stochastic frontier model. In both cases, the empirical results were obtained using the entire sample (i.e. all firms) and sub-samples for each agribusiness sector under analysis. This allows us to do a robustness check on the main findings.
In Table 3, the estimates were based on Ordinary Least Squares applied to panel data with fixed effects. The average efficiency was computed according to Kumbhakar et al. (2015, p. 244-245). Where the average efficiency was calculated using
{ }
ˆ ˆ ,ˆi i i i , ,
u max= ∝ − ∝ ≥0 i 1= …N and TEi=exp u{ }−ˆi , i 1= …, ,N. The values of ∝ˆi were recovered from the mean of the residual for each cross-sectional unit.
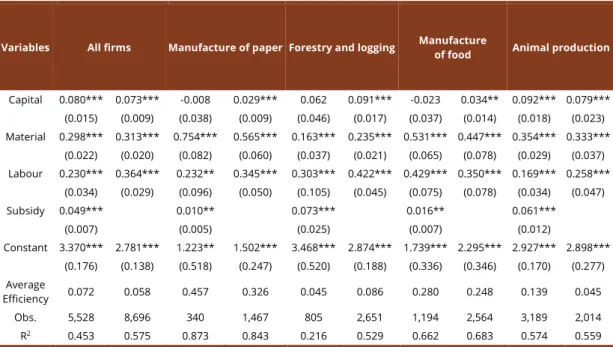
Overall, the estimates indicate that production is strongly driven by the intensity of the use of inputs as in the theory. Furthermore, public subsidies seem to be an important driver of technical efficiency, even though there are significant differences among agribusiness sectors.
Looking at the fixed effects model, firms with subsidies displayed an average efficiency higher than those without subsidies. The results show that the largest effect was on the livestock industry (production cattle, pigs, poultry, goats, sheep) in which 56% of firms are funded, and those that received subsidies outperformed in terms of average efficiency: over three times higher than those without subsidies. The manufacture of paper and the manufacture of food sectors unveil the largest average efficiency levels among the sectors examined, but subsidised firms are 1.40 and 1.129 times higher in efficiency terms than firms without subsidies, respectively. This seems to indicate that subsidies could have a decreasing impact on technical efficiency. If so, the role of subsidies in shaping technical efficiency seems to lose power as sectors improve their technical efficiency levels.
Table 3 – OLS estimates of Cobb-Douglas production function with fixed effects
Variables All firms Manufacture of paper Forestry and logging Manufacture of food Animal production
Capital 0.080*** 0.073*** -0.008 0.029*** 0.062 0.091*** -0.023 0.034** 0.092*** 0.079*** (0.015) (0.009) (0.038) (0.009) (0.046) (0.017) (0.037) (0.014) (0.018) (0.023) Material 0.298*** 0.313*** 0.754*** 0.565*** 0.163*** 0.235*** 0.531*** 0.447*** 0.354*** 0.333*** (0.022) (0.020) (0.082) (0.060) (0.037) (0.021) (0.065) (0.078) (0.029) (0.037) Labour 0.230*** 0.364*** 0.232** 0.345*** 0.303*** 0.422*** 0.429*** 0.350*** 0.169*** 0.258*** (0.034) (0.029) (0.096) (0.050) (0.105) (0.045) (0.075) (0.078) (0.034) (0.047) Subsidy 0.049*** 0.010** 0.073*** 0.016** 0.061*** (0.007) (0.005) (0.025) (0.007) (0.012) Constant 3.370*** 2.781*** 1.223** 1.502*** 3.468*** 2.874*** 1.739*** 2.295*** 2.927*** 2.898*** (0.176) (0.138) (0.518) (0.247) (0.520) (0.188) (0.336) (0.346) (0.170) (0.277) Average Efficiency 0.072 0.058 0.457 0.326 0.045 0.086 0.280 0.248 0.139 0.045 Obs. 5,528 8,696 340 1,467 805 2,651 1,194 2,564 3,189 2,014 R2 0.453 0.575 0.873 0.843 0.216 0.529 0.662 0.683 0.574 0.559
Notes: All regressions include time effects. Standard errors in parentheses. *, **, and *** mean that coefficients are statistically significant at 10%, 5%, and 1% level, respectively
A different finding emerges from the forestry and logging sectors, where the subsidised firms seem to unfold a lower average efficiency to those without subsidies. In this sector, most firms were not allocated subsidies, only 25% received subsidies and they have
unwrapped the lowest average efficiencies among the sectors examined. Several factors, such as environmental context, climatic conditions, manager training, could explain such poor performance in terms of technical efficiency. Giannakis & Bruggeman (2015) and Tranter et al. (2007) have already discussed the performance specificities of that agribusiness sector in Portugal and other European countries.
In accordance to Roe et al. (2003) under the assumption of imperfect markets, in the short and medium run, subsidies are likely to have a positive effect but small on the production, but technical progress should be achieved in the long run, because subsidised producers have fewer restrictions to credit and they are much more prone to invest more in cutting-edge technologies and development. McCloud & Kumbhakar (2008) have also found a positive effect when they assess the impact of subsidies on agricultural productivity in Denmark, Sweden, and Finland. They have pinpointed the fact that the effect on technical efficiency sheds light upon the link between subsidies and production.
Evidence showed that the estimated average efficiency in rural activities such as forestry and logging and animal production is between 4% and 14%. Although these values are low, they may be considered reasonable when compared to the values estimated by Zhu & Lansink (2010) for agriculture efficiency in Germany (64%), Netherlands (76%) and Sweden (71%) which are considered to be countries that hold the highest levels of efficiency in Europe. It is also important to mention the insightful Giannakis & Bruggeman (2015) study, which unveils that countries such as Germany, Sweden, and the Netherlands are 9 times more likely to outperform in rural activities countries such as Portugal, Spain, Greece, and Malta. These differences may be explained if we consider the rural population profile, the plot of land used in areas considered less favourable and also due to unequal financial support.
For that, Table 4 reports estimates from a stochastic frontier model in which firm’s technical efficiency is specified as a function of public financial support – subsidy –, the variable of interest, and a firm’s specific characteristics – export – that can be seen as a synthesis of several firm’s specific characteristics, apart from subsidies, that would affect its efficiency level. Various studies offer robust evidence on the distinctive characteristics of exporters relative to non-exporters (see, e.g., Alvarez & López, 2005; Garcia-Marin & Voigtländer, 2019).
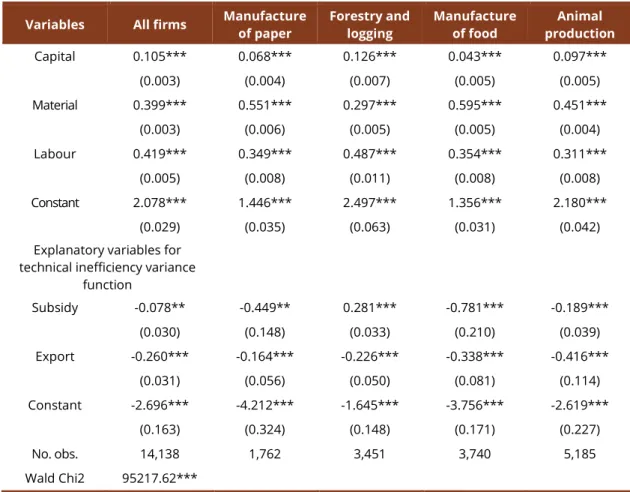
Overall, the estimates from the stochastic frontier model (Table 4) suggest that subsidies can drive the technical efficiency of agribusiness firms, even though there is significant heterogeneity among sectors. In three sectors - manufacture of paper, manufacture of food and animal production – subsidies appear to be a significant factor in reducing technical inefficiency, indicating that such agribusiness firms seem to use public financial support to foster investments in innovation and/or new technologies as a way to gain efficiency and competitiveness. In turn, firms in the forestry and logging sector seem to fail to use subsidies to restructuring production and improving efficiency through investing in efficiency-enhancing technologies. In fact, for those firms, subsidies seem to distort the incentives to improve efficiency. Those firms may use subsidies to improve other performance measures, such as exporting intensity, without a significant effect on efficiency. Also, on average, the estimated efficiency of those firms (see Table 3) is smaller than the estimated efficiency for other firms in the Portuguese agribusiness sector. Jointly, these findings suggest that the role of subsidies to improve efficiency may be restricted to specific sectors.
Table 4 – Estimates of Cobb-Douglas production function with half-normal distribution for inefficiency term: stochastic frontier half-normal model
Variables All firms Manufacture of paper Forestry and logging Manufacture of food production Animal
Capital 0.105*** 0.068*** 0.126*** 0.043*** 0.097*** (0.003) (0.004) (0.007) (0.005) (0.005) Material 0.399*** 0.551*** 0.297*** 0.595*** 0.451*** (0.003) (0.006) (0.005) (0.005) (0.004) Labour 0.419*** 0.349*** 0.487*** 0.354*** 0.311*** (0.005) (0.008) (0.011) (0.008) (0.008) Constant 2.078*** 1.446*** 2.497*** 1.356*** 2.180*** (0.029) (0.035) (0.063) (0.031) (0.042)
Explanatory variables for technical inefficiency variance
function Subsidy -0.078** -0.449** 0.281*** -0.781*** -0.189*** (0.030) (0.148) (0.033) (0.210) (0.039) Export -0.260*** -0.164*** -0.226*** -0.338*** -0.416*** (0.031) (0.056) (0.050) (0.081) (0.114) Constant -2.696*** -4.212*** -1.645*** -3.756*** -2.619*** (0.163) (0.324) (0.148) (0.171) (0.227) No. obs. 14,138 1,762 3,451 3,740 5,185 Wald Chi2 95217.62***
Notes: All regressions include time effects. Standard errors in parentheses. *, **, and *** mean that coefficients are statistically significant at 10%, 5%, and 1% level, respectively. The difference between the number of observations in Table 4 and Table 3 (about 86 observations and not firms) is due to the lack of information on exports for some (few) firms.
Looking at international market involvement, exports appear to have a positive effect on the efficiency of agribusiness firms. This finding corroborates the results found in previous studies, such as Granér & Isaksson (2009), for firms in Kenya, Alvarez, & López (2005) for the firms in Chile, and Baldwin & Gu (2003) for firms in Canada. Overall, these findings show that exporters are more efficient than other firms and that exporting activities could yield efficiency and productivity gains.
5 Main conclusions
The objective of this study was to analyse the effect of subsidies on the technical efficiency of firms operating in the Portuguese agribusiness sector, specifically, it focused upon four main activities: (1) manufacture of paper, (2) forestry and logging (3) manufacture of food and (4) livestock production. The models used, fixed effects regression and stochastic frontier, have unveiled significant results and suggest that subsidies are likely to enhance the average efficiency and to gear positive effect on technical efficiency of the Portuguese firms, as well as exports as found in several empirical studies which analyse other countries (Granér & Isaksson, 2009; Alvarez & López, 2005; Baldwin & Gu, 2003).
Evidence shows that subsidised firms in livestock production hold an average efficiency three times higher than firms without subsidies. In what concerns the firms in the manufacture of paper, and manufacture of food, these have materialised the highest levels of average efficiency among the sectors examined, although those that received subsidies display values between 1.40 and 1.129 times higher the efficiency level than firms without subsidies in the same sector. As for the forestry and logging sector, the results showed that
subsidies harm technical efficiency and the average value of the efficiency is between 4 and 8%, which can be explained by the less favourable natural conditions and the profile of the Portuguese rural producers, which is consistent with the study by Giannakis & Bruggeman (2015). These differences also show that subsidies alone are not enough to make productive units fully adjusted to their economic and political environments. The social complexity that is specific to each region and other local factors seems to be useful to explain the different effects of subsidies on productivity (McCloud & Kumbhakar, 2008). Hence, further research and discoveries involving different factors are needed to fully explain the ongoing agricultural problems.
The study contributes to the literature by featuring interesting results on the average efficiency of Portuguese agribusiness firms. It also contributes to political issues, providing necessary insights into the development of policies that can enhance and strengthen the efficiency and productivity of the sector. As Minviel & Latruffe (2017) argue, there is no consensus in the empirical literature on the effects of subsidies on firm’s technical efficiency, therefore it is necessary to continue researching and use advanced techniques and case studies to help policymakers in their decision-making processes by providing them with insightful studies and results.
References
Aigner, D. J., Lovell, C. A. K., & Schmidt, P. (1977). Formulation and estimation of stochastic frontier production function models. Journal of Econometrics, 6(1), 21-37.
Ajibefun, I. A. (2008). An evaluation of parametric and non-parametric methods of technical efficiency measurement: application to small scale food crop production in Nigeria. Journal of Agriculture and
Social Sciences, 4(3), 95-100.
Alvarez, R., & López, R. A. (2005). Exporting and performance: evidence from Chilean plants. The
Canadian Journal of Economics. Revue Canadienne d’Economique, 38(4), 1384-1400.
Baldwin, J. R., & Gu, W. (2003). Export-market participation and productivity performance in Canadian manufacturing. The Canadian Journal of Economics. Revue Canadienne d’Economique, 36(3), 634-657. Battese, G. E. (1992). Frontier production functions and technical efficiency: a survey of empirical
applications in agricultural economics. Agricultural Economics, 7(3-4), 185-208.
Battese, G. E., & Coelli, T. J. (1995). A model for technical inefficiency effects in a stochastic frontier production functions for panel data. Empirical Economics, 20(2), 325-332.
Bauer, P. W. (1990). Recent developments in the econometric estimation of frontiers. Journal of
Econometrics, 46(1-2), 39-56.
Bauer, P. W., Berger, A. N., Ferrier, G. D., & Humphrey, D. B. (1998). Consistency conditions for
regulatory analysis of financial institutions: a comparison of frontier efficiency methods. Journal of
Economics and Business, 50(2), 85-114.
Bojnec, S., & Latruffe, L. (2013). Farm size, agricultural subsidies and farm performance in Slovenia.
Land Use Policy, 32, 207-217.
Burfisher, M. E., & Hopkins, J. W. (2003). Decoupled payments: household income transfers in contemporary
U.S. agriculture (USDA-ERS Agricultural Economic Report, No. 822, 33 p.).
Charnes, A., Cooper, W. W., & Rhodes, E. (1978). Measuring the Efficiency of Decision Making Units.
European Journal of Operational Research, 2(6), 429-444.
Coelli, T. J., Rao, D. S. P., O’donnell, C. J., & Battese, G. E. (2005). An introduction to efficiency and
productivity analysis (2nd ed.). Boston: Springer.
Coelli, T., Rao, D. S. P., & Battese, G. E. (1998). An introduction to efficiency and productivity analysis. Boston: Kluwer Academic Publishers.
Cooper, W. W., Seiford, L. M., & Zhu, J. (2011). Handbook on data envelopment analysis (International Series in Operations Research and Management Sciences). New York: Springer-Verlag.
Cramer, V. A., Hobbs, R. J., & Standish, R. J. (2008). What’s new about old fields? Land abandonment and ecosystem assembly. Trends in Ecology & Evolution, 23(2), 104-112.
Daugbjerg, C., Tranter, R., Jones, P., Little, J., Costa, L., Knapp, T., Sottomayor, M., & Swinbank, A. (2005). The visibility of agricultural subsidies and market illusions in the Common Agricultural Policy: some
evidence from farmers’ views in Germany, Portugal and the United Kingdom. European Journal of
Political Research, 44(6), 749-766.
European Union. (2013, December 20). Regulation (EU) No. 1307/2013 of the European Parliament and of the Council of 17 December 2013 establishing rules for direct payments to farmers under support schemes within the framework of the common agricultural policy (CAP). Official Journal of
the European Union. Retrieved in 2017, July 25, from
http://eur-lex.europa.eu/legal-content/EN/ALL/?uri=CELEX:32013R1307
Färe, R., Grosskopf, S., & Lovell, C. A. K. (1985). The measurement of efficiency of production. Boston: Kluwer-Nijhoff Publishing.
Farrell, M. J. (1957). The measurement of productive efficiency. Journal of the Royal Statistical Society.
Series A (General), 120(3), 253-290.
Førsund, F., Lovell, C. A. K., & Schmidt, P. (1980). A survey of frontier production functions and of their relationship to efficiency measurement. Journal of Econometrics, 13(1), 5-25.
Fried, H. O., Lovell, C. A. K., & Schmidt, S. S. (2008). The measurement of productive efficiency. Oxford: Oxford University Press.
Garcia-Marin, A., & Voigtländer, N. (2019). Exporting and plant-level efficiency gains: it’s in the measure.
Journal of Political Economy, 127(4), 1777-1825. http://dx.doi.org/10.1086/701607
Giannakas, K., Schoney, R., & Tzouvelekas, V. (2001). Technical efficiency, technological change and output growth of wheat farms in Saskatchewan. Canadian Journal of Agricultural Economics, 49(2), 135-152.
Giannakis, Z., & Bruggeman, A. (2015). The highly variable economic performance of European agriculture. Land Use Policy, 45, 26-35. http://dx.doi.org/10.1016/j.landusepol.2014.12.009
Góral, J. (2015). Subsidies and technical efficiency of large-scale farms. Poland: National Research Institute, Agricultural Finance Department. Retrieved in 2017, July 20, from
https://www.researchgate.net/publication/277618010_SUBSIDIES_AND_TECHNICAL_EFFICIENCY_OF _LARGE-SCALE_FARMS
Granér, M., & Isaksson, A. (2009). Firm efficiency and the destination of exports: Evidence from Kenyan plant-level data. The Developing Economies, 47(3), 279-306. http://dx.doi.org/10.1111/j.1746-1049.2009.00087.x
Greene, W. H. (2008). Econometric analysis (6th ed.). New Jersey: Prentice Hall.
Hennessy, D. A. (1998). The production effects of agricultural income support policies under uncertainty. American Journal of Agricultural Economics, 80(1), 46-57.
http://dx.doi.org/10.2307/3180267
Hubbard, R. G. (1998). Capital-market imperfections and investment. Journal of Economic Literature,
36(1), 193-225.
Iraizoz, B., Bardaji, I., & Rapun, M. (2005). The Spanish beef sector in the 1990s: Impact of the BSE crisis on efficiency and profitability. Applied Economics, 37(4), 473-484.
http://dx.doi.org/10.1080/0003684042000295359
Karagiannis, G., & Sarris, A. (2005). Measuring and explaining scale efficiency with the parametric approach: The case of Greek tobacco growers. Agricultural Economics, 33(s3), 441-451. http://dx.doi.org/10.1111/j.1574-0864.2005.00084.x
Kumbhakar, S. C., & Lien, G. (2010). Impact of subsidies on farm productivity and efficiency. In V. E. Ball, R. Fanfani & L. Gutierez (Eds.), The economic impact of public support to agriculture, studies in
productivity and efficiency (pp. 109-124). New York: Springer.
Kumbhakar, S. C., & Lovell, C. A. K. (2003). Stochastic frontier analysis. Cambridge: Cambridge University Press.
Kumbhakar, S. C., Lien, G., & Hardaker, J. B. (2014). Technical efficiency in competing panel data models: a study of Norwegian grain farming. Journal of Productivity Analysis, 41(2), 321-337.
http://dx.doi.org/10.1007/s11123-012-0303-1
Kumbhakar, S. C., Wang, H. J., & Horncastle, A. P. (2015). A practitioner’s guide to stochastic frontier
analysis using stata. New York: Cambridge University Press.
Latruffe, L., & Desjeux, Y. (2016). Common Agricultural Policy support, technical efficiency and productivity change in French agriculture. Review of Agricultural, Food and Environmental Studies,
97(1), 15-28.
Lovell, C. A. K. (1996). Applying efficiency measurement techniques to the measurement of productivity change. Journal of Productivity Analysis, 7(2-3), 329-340.
MacDonald, D., Crabtree, J., Wiesinger, G., Dax, T., Stamou, N., Fleury, P., Gutier-Rez Lazpita, J., & Gibon, A. (2000). Agricultural abandonment in mountain areas of Europe: environmental consequences and policy response. Journal of Environmental Management, 59(1), 47-69.
Martin, J. P., & Page Junior, J. M. (1983). The impact of subsidies on X-Efficiency in LDC Industry: Theory and an Empirical Test. The Review of Economics and Statistics, 65(4), 608-617.
McCloud, N., & Kumbhakar, S. C. (2008). Do subsidies drive productivity? A cross-country analysis of nordic dairy farms. In S. Chib, W. Griffiths, G. Koop, D. Terrel & D. Bingley (Eds.), Bayesian
econometrics (Advances in Econometrics, No. 23, pp. 245-274). Bingley: Emerald Group Publishing.
McManus, P., Walmsley, J., Argent, N., Baum, S., Bourke, L., Martin, J., Pritchard, B., & Sorensen, T. (2012). Rural community and rural resilience: what is important to farmers in keeping their country towns alive? Journal of Rural Studies, 28(1), 20-29.
Minviel, J. J., & Latruffe, L. (2017). Effect of public subsidies on farm technical efficiency: a meta-analysis of empirical results. Applied Economics, 49(2), 213-226.
Organisation for Economic Co-operation and Development – OECD. (2013). Cross country analysis of
farm performance: working party on agricultural policies and markets, TAD/CA/APM/WP (2012)20/FINAL.
OECD. Retrieved in 2017, July 25, from
http://www.oecd.org/officialdocuments/publicdisplaydocumentpdf/?cote=TAD/CA/APM/WP(2012)2 0/FINAL&docLanguage=En
Rezitis, A., Tsiboukas, K., & Tsoukalas, S. (2003). Investigation of factors influencing the technical efficiency of agricultural producers participating in farm credit programs: the case of Greece.
Journal of Agricultural and Applied Economics, 35(3), 529-541.
Roe, T., Somwaru, A., & Diao, X. (2003). Do direct payments have intertemporal effects on U.S. agriculture? In C. B. Moss & A. Schmitz (Eds.), Government policy and farmland markets: the
maintenance of farmer wealth. Iowa: Iowa State University Press.
Rossi, M., & Ruzzier, C. (2000). On the regulatory application of efficiency measures. Utilities Policy, 9(2), 81-92.
Serra, T., Zilberman, D., & Gil, J. M. (2008). Farms’ technical inefficiencies in the presence of government programs. The Australian Journal of Agricultural and Resource Economics, 52(1), 57-76.
Sipiläinen, T., Kumbhakar, S. C., & Lien, G. (2014). Performance of dairy farms in Finland and Norway from 1991 to 2008. European Review of Agriculture Economics, 41(1), 63-86.
Smit, B., Pilifosova, O., Burton, I., Challenger, B., Huq, S., Klein, R. J. T., & Yohe, G. (2001). Adaptation to climate change in the context of sustainable development and equity. In J. J. McCarthy, O. F. Canziani, N. A. Leary, D. J. Dokken & K. S. White (Eds.), Climate Change 2001: impacts, adaptation and
vulnerability: contribution of Working Group II to the Third Assessment Report of the Inter-governmental Panel on Climate Change (pp. 879-906). Cambridge: Cambridge University Press.
Tranter, R. B., Swinbank, A., Wooldridge, M. J., Costa, L., Knapp, T., Little, G. P. J., & Sottomayor, M. L. (2007). Implications for food production, land use and rural development of the European Union’s single farm payment: indications from a survey of farmers’ intentions in Germany, Portugal and the UK. Food Policy, 32(5-6), 656-671.
Young, C. E., & Westcott, P. C. (2000). How decoupled is U.S. agricultural support for major crops?
American Journal of Agricultural Economics, 82(3), 762-767.
Zhengfei, G., & Lansink, A. O. (2006). The source of productivity growth in Dutch agriculture: a perspective from finance. American Journal of Agricultural Economics, 88(3), 644-656. Zhu, X., & Lansink, A. O. (2010). Impact of CAP subsidies on technical efficiency of crop farms in
Germany, the Netherlands and Sweden. Journal of Agricultural Economics, 61(3), 545-564. Zhu, X., Demeter, R. M., & Lansink, A. O. (2012). Technical efficiency and productivity differentials of
dairy farms in three EU countries: the role of CAP subsidies. Agricultural Economics Review, 13(1), 66-92.
Submetido: 5/Nov./2018. Aceito: 30/Set./2019 Classificação JEL: H23
Appendix 1 - Descriptive statistics by sector
Variable Manufacture of paper
Mean Max Min Std. Dev.
Operating revenue 6.928 13.809 -0.535 1.908 Capital 5.412 13.693 -2.920 2.653 Material 6.402 12.974 0.221 2.054 Labour 5.281 11.275 0.402 1.603 Subsidies 0.377 7.609 -5.396 1.220 Exports 2.684 13.565 -4.632 3.153
Forestry and logging
Mean Max Min Std. Dev.
Operating revenue 5.230 11.318 -3.853 1.616 Capital 4.597 12.030 -4.304 2.027 Material 4.017 10.811 -5.529 2.266 Labour 3.835 8.466 -5.161 1.266 Subsidies 0.628 7.159 -6.968 1.420 Exports 0.321 8.342 -4.826 1.207 Manufacture of food
Mean Max Min Std. Dev.
Operating revenue 7.274 12.285 -2.754 1.958 Capital 6.104 11.632 -5.423 2.039 Material 6.918 12.300 -3.799 2.155 Labour 5.265 9.858 -2.801 1.539 Subsidies 0.683 8.051 -5.187 1.456 Exports 1.862 11.098 -5.326 2.787 Animal Production
Mean Max Min Std. Dev.
Operating revenue 5.477 11.139 -3.133 1.709 Capital 5.019 11.061 -3.755 1.967 Material 5.042 11.074 -8.186 2.091 Labour 3.513 8.423 -4.694 1.297 Subsidies 1.535 7.388 -6.091 1.900 Exports 0.302 10.283 -3.538 1.207