Different levels of
hsp70
and
hsc70
mRNA expression in Iberian fish exposed
to distinct river conditions
Tiago F. Jesus, Ângela Inácio and Maria M. Coelho
Centro de Biologia Ambiental, Faculdade de Ciências, Universidade de Lisboa, Campo Grande, Lisbon,
Portugal.
Abstract
Comprehension of the mechanisms by which ectotherms, such as fish, respond to thermal stress is paramount for understanding the threats that environmental changes may pose to wild populations. Heat shock proteins are molec-ular chaperones with an important role in several stress conditions such as high temperatures. In the Iberian Penin-sula, particularly in Portugal, freshwater fish of the genusSqualius are subject to daily and seasonal temperature variations. To examine the extent to which different thermal regimes influence the expression patterns ofhsp70 and hsc70 transcripts we exposed two species of Squalius (S. torgalensis and S. carolitertii) to different temperatures (20, 25, 30 and 35 °C). At 35 °C, there was a significant increase in the expression ofhsp70 and hsc70 in the south-ern species,S. torgalensis, while the northern species, S. carolitertii, showed no increase in the expression of these genes; however, some individuals of the latter species died when exposed to 35 °C. These results suggest thatS. torgalensis may cope better with harsher temperatures that are characteristic of this species natural environment; S. carolitertii, on the other hand, may be unable to deal with the extreme temperatures faced by the southern species.
Keywords: Cyprinidae, heat shock proteins,Squalius, thermal stress.
Received: June 18, 2012; Accepted: December 14, 2012.
Introduction
Many organisms are frequently exposed to stressful environmental conditions, such as temperature variations, that pose substantial challenges to their survival and repro-duction (López-Maury et al., 2008). Stressful conditions
may limit the geographical distribution of organisms by causing them to move to more suitable locations (Hoffmann and Sgrò, 2011). Organisms can also deal with stressful conditions by adapting to them, either through changes in the genetic composition of populations as a re-sult of selection, and/or by phenotypic plasticity; without this adaptability many species would become extinct (Sørensenet al., 2003; Dahlhoff and Rank, 2007; Berget al., 2010; Hoffmann and Sgrò, 2011). Most animal species
(> 99%), including fish, are ecthoterms that cannot regulate their body temperature and this ultimately affects their me-tabolism (Berget al., 2010). Since increases in temperature
are one of the major consequences of climate change it is important to know how organisms, particularly ecthoterms, respond to high temperatures.
Heat shock proteins (Hsp) are part of an important mechanism that helps organisms to cope with adverse envi-ronmental conditions such as thermal stress. This
mecha-nism has a significant ecological and evolutionary role in natural populations (Sørensenet al., 2003; Fangueet al.,
2006; Straalen and Roelofs, 2006). In addition to thermal stress, other factors such as insecticides, heavy metals, des-iccation, diseases and parasites can also induce Hsp (Lindquist and Craig, 1988; Sørensenet al., 2003; Fangue et al., 2006). Heat shock proteins are vital for proper cell
functioning since they facilitate the folding and refolding of proteins and the degradation of misfolded, aggregated or denaturated proteins (Lindquist and Craig, 1988; Ohtsuka and Suzuki, 2000; Sørensen et al., 2003; Wegele et al.,
2004).
Several closely relatedhspgenes have been
identi-fied and grouped into families based on their evolutionary relationships (Lindquist and Craig, 1988). The exten-sively studied 70-kDa heat shock protein (Hsp70) belongs to a multi-gene family and its gene expression varies un-der different physiological conditions (Lindquist and Craig, 1988). The genes that encode the Hsp70 proteins (hsp70s) are considered the major hsp gene family and
consist of exclusively inducible (hsps), exclusively
con-stitutive [Heat shock cognates (hscs)] and even
simulta-neously inducible and constitutive genes (Lindquist and Craig, 1988; Ohtsuka and Suzuki, 2000; Place and
Hofmann, 2001; Sørensenet al., 2003). Thehsp70genes
and the genes that encode the Hsc70 protein (hsc70)
be-long to thehsp70gene family. Whereashsp70genes are
www.sbg.org.br
Send correspondence to T.F. Jesus. Faculdade de Ciências, Edifício C2, Room 2.3.12, Universidade de Lisboa, Campo Grande, 1749-016 Lisbon, Portugal. E-mail: [email protected].
induced by several types of stress,hsc70genes are mainly
constitutively expressed under normal (non-stress) condi-tions (Lindquist and Craig, 1988; Ohtsuka and Suzuki, 2000; Yamashitaet al., 2004).
Members of thehsp70gene family have been widely
studied in many organisms and distinct expression patterns have been found. Several studies have reported a relation-ship between the expression patterns ofhsp70and
environ-mental variations throughout a species range (Sørensenet al., 2001; Fangueet al., 2006; Karlet al., 2009; Sørensenet
al., 2009; Blackman, 2010; Sarup and Loeschcke, 2010).
For example, Fangueet al.(2006) detected significant
dif-ferences in the gene expression levels ofhsp70between
northern and southern populations ofFundulus heteroclitus
in North America, with the latter being exposed to higher temperatures. Similarly, Sørensenet al.(2009) found that
southern populations ofRana temporaria from Sweden,
when exposed to higher temperatures, had the highest lev-els of Hsp70 protein expression.
Thehsc70gene was initially described as being
con-stitutively expressed under normal and stressful conditions (Lindquist and Craig, 1988; Place and Hofmann, 2001; Yeh
and Hsu, 2002; Yamashita et al., 2004). Fangue et al.
(2006) reported that individuals from southern populations ofF. heteroclitusshowed enhanced expression of this gene
at higher temperatures. This finding demonstrates the
im-portance of studying the expression of hsp70 genes in
closely related species or populations exposed to different temperature regimes in their natural habitats. These find-ings also suggest that Hsps play an important role in ther-mal tolerance and that, despite being occasionally parado-xical, the expression patterns of these genes must be interpreted according to the ecological context of each spe-cies (Sørensenet al., 2003).
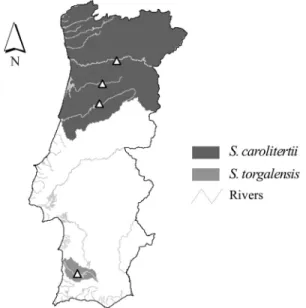
In the Iberian Peninsula, particularly in Portugal, the congeneric freshwater fish species, Squalius carolitertii
(Cyprinidae) (Doadrio, 1988), a species of least concern (Rogadoet al., 2006), andSqualius torgalensis(Coelhoet al., 1998), a critically endangered species (Cabral et al.,
2006), inhabit distinct regions.Squalius carolitertii
inhab-its the northern region whereasS. torgalensisis restricted to
a small river basin (the Mira river) in the southwestern re-gion (Figure 1) (Cabralet al., 2006). In these areas, the two
species are exposed to different environmental conditions with distinct seasonal and even daily water temperature variations. The northern rivers of Portugal have lower tem-peratures and fewer temperature fluctuations than the southern rivers (Henriqueset al., 2010; SNIRH). In
north-ern rivers, the maximum temperature usually does not ex-ceed 31 °C (range: 3-31 °C), whereas southern rivers are characterized by an intermittent regime of floods and droughts in which, during the dry season, freshwater fish are trapped in small pools in which temperatures can reach 38 °C (range: 4-38 °C) (Magalhãeset al., 2003; Henriques et al., 2010; SNIRH).
The main goal of this study was to gain insights into the potentially important molecular mechanism involved in the response ofS. carolitertiiandS. torgalensisto thermal
stress, particularly since these species inhabit regions with distinct environmental regimes. Specifically, we examined thehsp70 andhsc70gene transcription patterns for each
species exposed to different temperatures and compared the patterns between the two species; we also tried to correlate our findings with the ecological context of each species. Finally, we examined whether the patterns of transcript ex-pression (for the genes of interest) were similar to those of muscle, which is the most frequently used tissue in such studies (Yamashitaet al., 2004). The results described here
provide useful insights into the roles ofhsp70andhsc70
gene expression in the response of IberianSqualiusto
ther-mal stress.
Methods
Sampling and maintenance of fish
Adult fish (6-8 cm long) of S. carolitertii and S.
torgalensiswere collected from Portuguese rivers by
elec-tro-fishing (300 V, 4 A) (Figure 1). The pulses used were of low duration to avoid killing juveniles. Sampling was done during the spring, when the water temperature in the south-ern and northsouth-ern rivers is ~18-22 °C. Fish of both sexes were used since there is no sexual dimorphism in either spe-cies.Squalius torgalensisindividuals were sampled in the
Mira river basin since this species is endemic to this region and individuals ofS. carolitertiiwere collected in the
Mon-dego, Vouga and Douro river basins of the northern region. The fish were maintained in ~30 L aquaria at 20 °C (mean temperature observed during sampling) on a 12 h photo-period and were fed daily with commercial flake fish food.
Experimental design
After two weeks of acclimatization (to reduce the stress caused by fishing and confinement), individuals of each species were subjected to four temperature regimens: 20 °C (control temperature) and increases in temperature from 20 °C to 25 °C, 30 °C and 35 °C (testing tempera-tures). These increases in temperature were achieved with gradual increments of 1 °C per day and, once the testing temperature was reached, individuals were kept at this tem-perature for 24 h. Six to seven individuals of each species were exposed to each experimental condition, with each in-dividual being exposed to only one experimental condition. After acclimatization at the desired test temperature, fish were anesthetized with 300 mg/L tricaine mesylate (MS-222; Sigma-Aldrich, St. Louis, MO, USA) and fin clips were collected from the pectoral, pelvic and upper caudal fins. The fin clips from each fish were pooled and stored at -80 °C until RNA extraction. To compare the expression patterns of fins and muscle and determine whether fin clips could be used instead of muscle to assess transcript expres-sion, four individuals ofS. torgalensis(one per test temper-ature) and 16 individuals ofS. carolitertii (four per test temperature) were euthanized with MS-222 and muscle tis-sue was collected. SinceS. torgalensisis a critically endan-gered species, our study was designed to minimize the number of individuals euthanized.
RNA extraction and cDNA synthesis
For RNA extraction, TRI Reagent (Ambion, Austin, TX, USA) was added to fin clips and muscle samples. After homogenization with an Ultra-Turrax homogenizer (IKA, Staufen, Germany), RNA was extracted according to the manufacturers protocol and TURBO DNase (Ambion) was used to degrade any remaining genomic contaminants, fol-lowed by phenol/chloroform purification and LiCl precipi-tation (Cathalaet al., 1983). Glycogen was used as a
co-precipitant in RNA precipitation (Sigma-Aldrich). The quality of the samples was checked using a Nanodrop-1000 spectrophotometer (Thermo Scientific, Waltham, MA, USA) based on the 260/280 nm and 260/230 nm absorbance ratios. The concentrations of the samples were determined to ensure a sufficient amount of homogeneous RNA for complementary DNA (cDNA) synthesis. cDNA was synthesized using a RevertAid H Minus First Strand cDNA synthesis kit (Fermentas Inc., Glen Burnie, MD, USA), according to the manufacturer’s instructions and stored at -20 °C.
Semi-quantitative RT-PCR
Sixty-one individuals (31 S. torgalensis and 30 S.
carolitertii)were used for quantification of the target
tran-scripts. The hsp70-specific primers
GGCCCTCATCAAACGC (forward) and
TTGAAGGCGTAAGACTCCAG (reverse) and the
hsc70-specific primers GTTCAAGCAGCCATCTTAGC
(forward) and TGACCTTCTCCTTCTGAGC (reverse) were designed using PerlPrimer software v.1.1.19 (Mar-shall, 2004). The resulting amplicons were sequenced and the sequences then checked manually for errors using SEQUENCHER v.4.2 (Gene Codes Corporation, Ann Ar-bor, MI, USA). The identities of the genes of interest were
confirmed by BLAST searches (Zhanget al., 2000).
Multiplex PCRs were used to amplify the
glyceraldehyde 3-phosphate dehydrogenase (gapdh)
serv-ing as internal control and the gene of interest, which al-lowed normalized quantification of the mRNAs of interest (hsp70orhsc70). The primers used to amplifygapdhwere
ATCAGGCATAATGGTTAAAGTTGG (forward) (Pala
et al., 2008) and GGCTGGGATAATGTTCTGAC
(re-verse) (Matos IM,unpublished). Gapdh has been
exten-sively used as an internal control in several studies and has been validated as a good reference gene for gene expression studies in different experimental conditions (Aoki et al.,
2000; Zhouet al., 2010), including those involving
temper-ature changes (Liu et al., 2012). Semi-quantitative
RT-PCRs were optimized to ensure the amplification of both
cDNAs in the exponential phase (Serazin-Leroy et al.,
1998; Breljak and Gabrilovac 2005). The amplification conditions for the pairhsp70/gapdhwere those described in
the manufacturers instructions (QIAGEN multiplex PCR kit, Qiagen Inc., Valencia, CA, USA) (final concentration: 1 PCR master mix with 3 mM MgCl2, 0.5 of Q-solution and
0.2mM of each primer), with an initial denaturation step at 95 °C for 15 min, followed by 30 cycles at 95 °C for 1 min, 58 °C for 1 min and 30 s and 72 °C for 1 min, with a final extension at 72 °C for 10 min. For the gene pair
hsc70/gapdh, the PCR conditions were: 1 unit of GoTaq
Flexi DNA polymerase (Promega, Madison, WI, USA)
with 0.3mM of each primer, 0.25 mM of each dNTP and
2 mM of MgCl2. The cycling conditions included an initial
denaturation step at 95 °C for 5 min, followed by 35 cycles at 95 °C for 1 min, 58 °C for 45 s and 72 °C for 1.5 min, with a final extension at 72 °C for 10 min. Controls without tem-plate and without RT (reverse transcriptase) were included to check for PCR contamination and genomic DNA con-tamination, respectively.
For transcript quantification, 4mL of each PCR prod-uct was loaded onto a 1% agarose gel stained with RedSafe (Chembio Ltd, Hertfordshire, England) and the gels were photographed with a DC290 Kodak digital camera for sub-sequent image densitometry using ImageJ 1.43 U software
(Abramoff et al., 2004). An uncalibrated OD was used
(Abramoffet al., 2004) and the band of interest was
quanti-fied and normalized against the internal control band (gapdh) present in the same lane.
Real-time RT-PCR
done. In this experiment, three individuals from each ex-perimental condition for both species were analyzed with
two PCR replicates. The primer pairs
AATTCCACCTGCACCACG (forward) and
TCTCCTCTTTGCTCAGTCTG (reverse) and
TTTGCTGTTGGATGTCACTC (forward) and
GTGGGAATGGTGGTGTTC (reverse) were used to am-plify thehsp70andhsc70genes, respectively. These
spe-cific primers were designed based on the sequences previously obtained from semi-quantitative PCR. The rela-tive expression levels of the genes of interest were mea-sured againstgapdh(reference gene). The primers used to
amplify the gapdh gene were
GTACAAGGGTGAGGTTAAGGC (forward) and
GTGATGCAGGTGCTACATACGT (reverse). All pairs of primers used were designed using PerlPrimer software v.1.1.19 (Marshall, 2004).
Real-time PCRs were done in a final volume of 15mL
containing 7.5 mL of SsoFas EvaGreen Supermix
(Bio-Rad, Hercules, CA, USA) and 0.6mL of each primer (with a concentration of 0.4mM). The assay conditions included an initial denaturation step at 95 °C for 30 s, followed by 40 cycles at 95 °C for 5 s and 55 °C for 5 s. The reactions were done in a Bio-Rad CFX96 system (Bio-Rad). Controls without template and without RT were included to check for PCR contamination and genomic DNA contamination, respectively. The identities of the amplicons were con-firmed by melting curve analysis and Sanger sequencing. The PCR efficiency for each sample was assessed using LinRegPCR 11.1 software, which fits a regression line to a subset of data points in the log-linear phase (Ruijteret al.,
2009). PCR efficiency ranged from 1.91 to 2 for all primer
pairs (1.91 forhsp70primers and 2 forgapdh andhsc70
primers). The relative amount of the genes of interest was calculated by the comparative threshold cycle (CT) method
with efficiency correction, using the mean PCR efficiency for each amplicon (Ruijteret al., 2009).
Statistical analysis
In the semi-quantitative PCR analysis, arbitrary val-ues for quantification of the band of interest (hsp70 or
hsc70) were divided by the corresponding value for the
control band (gapdh) to obtain a hsp70/gapdh or
hsc70/gapdhratio.
In graphs of the fold change in expression for each transcript a temperature of 20 °C was considered the con-trol condition and assigned a value of 1. The fold variation in the other treatments, relative to the control condition, was calculated as follows:Ii =
å
xi /nx20, whereIiis themean fold increase in expression,xiis the observed value,
x20is the mean value of observations at 20 °C for each
spe-cies andnis the number of individuals of each species per tested temperature.
The data were log transformed [log10(x+ 1)] for
anal-ysis of variance (ANOVA) in order to test for differences in
transcript expression patterns across the experimental conditions for both genes. Whenever the assumptions of homoscedasticity and normality were not met, non-parametric Kruskal-Wallis analyses were done and the
re-sults from both analyses were compared.Post-hoc
para-metric and non-parapara-metric comparisons were performed, using the Tukey test and Dunn’s test, respectively. The real-time PCR data were analyzed in a manner similar to that used for semi-quantitative PCR, except that the fold change was calculated by the method of Pfaffl (2001). Prior to analysis, the real-time PCR data were transformed as de-scribed by Willemset al.(2008); the statistical tests used
were the same as those used for semi-quantitative PCR. In all cases, a value of p < 0.05 indicated significance. All sta-tistical comparisons were done using Statistica 9.0 software (StatSoft, 2009).
Results
Survival in the experiments
Two of sevenS. carolitertiiindividuals did not reach
the 35 °C experimental condition because they died during the increase from 34 °C to 35 °C. In contrast, none of theS. torgalensis individuals died or showed signs of loss of
equilibrium during the experiments. In the experiment to compare gene expression in muscle and fins, all individuals ofS. carolitertiidied at 34 °C, before reaching 35 °C.
Expression pattern of thehsp70gene
Initially, the identity of each amplicon was confirmed
by sequencing. This showed that thehsp70primers
ampli-fied a fragment with high homology to the inducible form of hsp70 from other cyprinids, including Megalobrama amblycephala (96.5% identity; accession number:
EU884290), Tanichthys albonubes (96% identity;
HQ007352), Cyprinus carpio (95.4% identity;
AY120894), Carassius auratus (94.3% identity;
AB092839) andDanio rerio(91.7% identity; BC056709).
The sequences of thehsp70genes ofS. torgalensisandS. carolitertii were deposited in GenBank under accession numbers JQ608477 and JQ608476, respectively.
In both species, the levels ofhsp70gene expression in
muscle and fin clips with increasing water temperature were similar in both tissues (Figure S1, Supplementary ma-terial). Consequently, in all subsequent analyses fin clips were used in order to avoid euthanasia of the fish.
InS. torgalensisexposed to 35 °C there was a 59-fold
increase in thehsp70mRNA levels when compared with
20 °C (control condition) and an ~53-fold increase when compared with 30 °C. In contrast, inS. carolitertiithe
cor-responding expression increased by no more than three-fold, even at the highest temperature (Figure 2). Statistical analyses indicated a significant difference inhsp70mRNA
expression amongS. torgalensisexposed to different
comparisons showing thatS. torgalensisexposed to 30 °C
and 35 °C had a significant increase inhsp70levels
com-pared with those observed at 20 °C and 25 °C (Table S1,
Supplementary material).Post-hoccomparisons also
dem-onstrated a significant difference between fish exposed to 30 °C and 35 °C (Table S1, Supplementary material). There were no significant differences in the mRNA levels among the groups ofS. carolitertiiexposed to different
tempera-tures (H= 3.086,df= 3, p > 0.300). As this latter dataset
vi-olated the assumption of homoscedasticity the results were also compared with a non-parametric test but the outcome was the same, i.e, there were no differences in the expres-sion ofhsp70inS. carolitertiiexposed to different
tempera-tures (F= 1.220,df= 3, p > 0.300).
In general, the real-time PCR results showed similar patterns to those obtained with semi-quantitative PCR for both species, although forS. torgalensisthe expression
pat-tern of thehsp70gene obtained with real-time PCR differed
significantly (F= 92.356,df= 3, p < 0.001) among the
ex-perimental conditions (Table S2, Supplementary material) (Figure 3). Since this dataset did not satisfy the assumption of homogeneity of variances a non-parametric test was also applied and showed a significant difference in the mRNA expression levels between 20 °C and 35 °C (H= 9.974,df=
3, p < 0.050) (Table S2, Supplementary material).
Expression pattern of thehsc70gene
The pair ofhsc70primers amplified a fragment with
high homology to thehsc70-1gene fromC. carpio(78.2%
identity; AY120893), followed by hsc70 from D. rerio
(81.5% identity; L77146),M. amblycephala(80.9%
iden-tity; EU623471) and Ctenopharyngodon idella (80.1%
identity; EU816595). The hsp70 gene sequences of S.
torgalensisandS. carolitertiiwere deposited in GenBank
under accession numbers JQ608475 and JQ608474, re-spectively.
The levels ofhsc70gene expression in muscle and fin clips fromS. carolitertiiwere similar in both tissues, but this was not the case forS. torgalensis(Figure S1, Supple-mentary material); the latter species showed higher expres-sion in the fins compared to muscle and all subsequent analyses were done with fins.
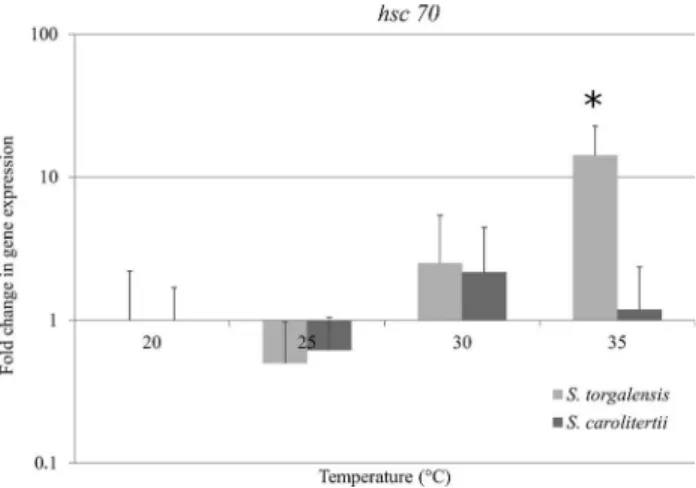
Individuals ofS. torgalensisexposed to 35 °C showed
a 14-fold increase in hsc70 mRNA levels compared to
20 °C (control condition) and an ~12-fold increase com-pared to 30 °C (Figure 4). One-way ANOVA indicated sig-nificant differences in the expression levels of thehsc70
gene among the four temperatures (F = 12.504, df = 3,
p < 0.001) andpost-hoccomparisons identified a difference between the 35 °C treatment and the other three tempera-tures (Table S3, Supplementary material). Kruskal-Wallis analysis confirmed the presence of significant differences
among the experimental conditions (H= 15.351, df= 3,
Figure 2- Fold change inhsp70transcript expression inS. torgalensisand S. carolitertiicompared to 20 °C (control condition), as assessed by semi-quantitative PCR. The columns are the mean±SD of 6 or 7 fish. p < 0.05 compared to all other treatments.
Figure 3- Fold change inhsp70transcript expression inS. torgalensisand S. carolitertiicompared to 20 °C (control condition), as assessed by real-time PCR. The columns are the mean±SD of 6 or 7 fish. p < 0.05 compared to all other treatments.
p < 0.005). Although the non-parametric post-hoc test
showed no significance between the 30 °C and 35 °C treat-ments, a significant difference was still observed between the 20 °C and 35 °C groups (Table S3, Supplementary
ma-terial). In contrast, the increase in mRNA levels in S.
carolitertiiwas not greater than three-fold, with the greatest
increase occurring at 30 °C, although this was not statisti-cally significant (F= 1.439,df= 3, p > 0.200) (Figure 4).
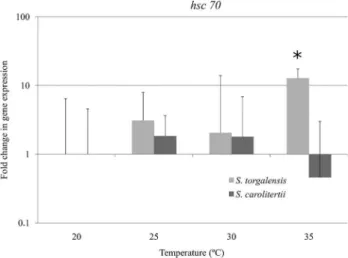
Real-time PCR confirmed the significant increase in
hsc70 expression inS. torgalensis at 35 °C (F = 4.481, df= 3, p < 0.050), whereasS. carolitertiishowed no
signifi-cant differences among the experimental conditions (F= 1.391,df= 3, p > 0.300) (Table S4, Supplementary
ma-terial) (Figure 5).
Discussion
In this study, we used fin samples (instead of other
or-gans) to measure hsp70 transcript expression, thereby
avoiding the euthanasia of animals, which is a particularly relevant consideration when studying endangered species.
Our finding agree with those of Yamashitaet al.(2004)
who found similar patterns of Hsp70 expression in muscle and in fibroblasts cultured from caudal fin tissue of
Xyphophorus maculatus. In S. carolitertii, fin clips and
muscle showed similar patterns ofhsc70 expression, but
this similarity was not so evident forS. torgalensis.
How-ever, this result needs to be interpreted with caution given the small number of muscle samples used from the latter
species. Nevertheless, there was an increase in hsc70
mRNA expression in fins ofS. torgalensisin response to
higher temperatures.
As shown here, there was an increase inhsp70mRNA
levels inS. torgalensisindividuals exposed to higher
tem-peratures, as also reported for hsp70s in other species
(Buckleyet al., 2001; Yeh and Hsu, 2002; Yamashitaet al.,
2004; McMillanet al., 2005; Fangueet al., 2006; Karlet
al., 2009; Sørensen et al., 2009; Sarup and Loeschcke,
2010; Waagneret al., 2010). There were significant
differ-ences in the expression of this gene betweenS. torgalensis
exposed to 20 °C and those exposed to other temperatures, particularly 35 °C. This result was somewhat expected sinceS. torgalensisinhabits an environment that is
suscep-tible to extreme conditions (such as small ponds that can reach high temperatures during the dry season) and should therefore be able to deal with protein denaturation. In con-trast,S. carolitertiishowed no significant increase inhsp70
expression levels, which suggests that this species is unable to respond to stressful conditions associated with eleva-tions in temperature. UnlikeS. torgalensis, which showed
the largest induction of hsp70, some individuals of S.
carolitertiidied at 35 °C, possibly because of this species
inability to adjust to thermal stress. The failure of S.
carolitertiito increase the expression ofhsp70may reflect
its poor ability to adapt to 35 °C; this conclusion agrees with the fact that in its natural environment this species never experiences temperatures > 31 °C (SNIRH).
However, other mechanisms may also be involved in the responses to thermal stress, including the hormone cortisol, heat shock factors (involved in the regulation of the heat shock response), otherhspsand even transcripts
that encode other proteins (such as the protein Wap65)
(Tomanek and Somero, 2002; Frydenberg et al., 2003;
Kassahnet al., 2007; Sarropoulouet al., 2010; Tymchuket al., 2010; Celiet al., 2012). To clarify the molecular
mech-anisms involved, future experiments should examine how temperature influences cortisol levels in both species since interactions between Hsp and cortisol are known to be in-volved in stress responses (Celiet al., 2012). The divergent
response between the two species may also reflect the more stable environment, with less severe temperature varia-tions, in northern rivers compared to southern rivers (SNIRH).
Thehsc70gene is often considered to be part of
con-stitutive cell functions in non-stress situations such that an increase in temperature may either decrease or have no ef-fect on the expression of this gene (Yeh and Hsu, 2002;
Yamashita et al., 2004; López-Maury et al., 2008). As
shown here, there was no significant variation in hsc70
mRNA expression inS. carolitertiiat the different
tempera-tures. In contrast,S. torgalensis showed a significant
in-crease inhsc70expression in fins at 35 °C when compared
with the other temperatures. Thus,S. torgalensiscan
en-hance the mRNA expression of induciblehsp70and
consti-tutivehsc70in response to increases in temperature.The
latter finding is similar to that of Fangueet al.(2006) who
reported an increase in hsc70 mRNA levels during heat
stress inF. heteroclitusfrom southern North America. In
addition, ATPase activity has been observed inGillichthys mirabilisHsc70 at high temperatures, suggesting that this
protein can function even at extreme temperatures (Place
and Hofmann, 2001). With regard to our findings, the lack of an increase in mRNA expression levels in muscle makes it difficult to conclude thathsc70expression confers
pro-tection against thermal stress, although the enhanced ex-pression in fins may indicate that the extensive contact surface of this tissue with the external environment might favor this response. Another possible explanation for the variation in mRNA levels between these tissues could be the existence of negative feedback (between Hsp and
mRNAs) in the regulation ofhspgene expression (Celiet
al., 2012).
The increase inhsp70expression seen at higher tem-peratures inS. torgalensismay be important in the degrada-tion and re-folding of denatured proteins and suggests that these fish are adapted to deal with high temperatures when they are trapped in ponds during the dry season; in contrast,
S. carolitertiiis unable to deal with such high temperatures. Magalhãeset al.(2003) stated thatS. torgalensishas traits typical of species adapted to harsh environments (short life span, earlier spawning age and small body size compared to otherSqualiusthat inhabit more stable environments). In addition, species living closer to their thermal tolerance limits may be particularly prone to small changes in their thermal regime (Dahlhoff and Rank, 2007; Reusch and
Wood, 2007; Sørensen et al., 2009; Somero, 2010;
To-manek, 2010; Hoffmann and Sgrò, 2011). In this regard, in-termittent systems such as that of the Mira river basin are particularly vulnerable to environmental changes. Changes in the seasonal regime of floods and droughts, with the in-creasing occurrence of severe droughts, may pose new challenges to these fish. Hence, to preserve this species, it would be advisable to promote habitat conservation with a particular emphasis on the conservation of refuges (pools) during the dry season (Sousa-Santoset al., 2009; Henriques
et al., 2010).
Acknowledgments
We thank Carla Sousa-Santos, Joana Martelo, Maria Ana Aboim, Miguel Santos, Miguel Machado and Isa Ma-tos for help in capturing and maintaining the fish. We also thank Isa Matos and Diogo Silva who, respectively, de-signed the reverse primer used forgapdhamplification in
semi-quantitative PCR and revised the manuscript. This work was supported by the FCT Project PTDC/BIA-BDE/69769/2006. Fishing licenses were provided by Direcção Regional dos Recursos Florestais (DGRF).
References
Abramoff MD, Magelhães PJ and Ram SJ (2004) Image process-ing with ImageJ. Biophotonics Int 11:36-42.
Aoki T, Naka H, Katagiri T and Hirono I (2000) Cloning and char-acterization of glyceraldehyde-3-phosphate dehydrogenase cDNA of Japanese flounderParalichthys olivaceus. Fish Sci
66:737-742.
Berg MP, Kiers ET, Driessen G, Heijden M, Kooi BW, Kuenen F, Liefting M, Verhoef HA and Ellers J (2010) Adapt or dis-perse: Understanding species persistence in a changing world. Glob Change Biol 16:587-598.
Blackman BK (2010) Connecting genetic variation to phenotypic clines. Mol Ecol 19:621-623.
Breljak D and Gabrilovac J (2005) Comparison of three RT-PCR based methods for relative quantification of mRNA. Food Technol Biotechnol 43:379-388.
Buckley BA, Owen ME and Hofmann GE (2001) Adjusting the thermostat: The threshold induction temperature for the heat-shock response in intertidal mussels (genusMytilus) changes as a function of thermal history. J Exp Biol 204:3571-3679.
Cathala G, Savouret JF, Mendez B, West BL, Karin M, Martial JA and Baxter JD (1983) A method for isolation of intact, translationally active ribonucleic acid. DNA 2:329-335. Celi M, Vazzana M, Sanfratello MA and Parrinello N (2012)
Ele-vated cortisol modulates Hsp70 and Hsp90 gene expression and protein in sea bass head kidney and isolated leukocytes. Gen Comp Endocrinol 175:424-431.
Dahlhoff EP and Rank NE (2007) The role of stress proteins in re-sponses of a montane willow leaf beetle to environmental temperature variation. J Biosci 32:477-488.
Fangue NA, Hofmeister M and Schulte PM (2006) Intraspecific variation in thermal tolerance and heat shock protein gene expression in common killifish, Fundulus heteroclitus. J Exp Biol 209:2859-2872.
Frydenberg J, Hoffmann AA and Loeschcke V (2003) DNA se-quence variation and latitudinal associations in hsp23, hsp26 and hsp27 from natural populations of Drosophila melanogaster. Mol Ecol 12:2025-2032.
Henriques R, Sousa V and Coelho MM (2010) Migration patterns counteract seasonal isolation ofSqualius torgalensis, a
criti-cally endangered freshwater fish inhabiting a typical circum-Mediterranean small drainage. Conserv Genet 11:1859-1870.
Hoffmann AA and Sgrò CM (2011) Climate change and evolu-tionary adaptation. Nature 470:479-485.
Karl I, Sørensen JG, Loeschcke V and Fischer K (2009) HSP70 expression in the Copper butterflyLycaena tityrusacross
al-titudes and temperatures. J Evol Biol 22:172-178.
Kassahn KS, Crozier RH, Ward AC, Alister C, Stone G and Caley MJ (2007) From transcriptome to biological function: Envi-ronmental stress in an ectothermic vertebrate, the coral reef fishPomacentrus moluccensis. BMC Genomics 8:e358. Lindquist S and Craig EA (1988) The heat-shock proteins. Annu
Rev Genet 22:631-677.
Liu C, Wu G, Huang X, Liu S and Cong B (2012) Validation of housekeeping genes for gene expression studies in an ice alga Chlamydomonasduring freezing acclimation.
Extre-mophiles 16:419-425.
López-Maury L, Marguerat S and Bähler J (2008) Tuning gene expression to changing environments: From rapid responses to evolutionary adaptation. Nat Rev Genet 9:583-593. Magalhães MF, Schlosser IJ and Collares-Pereira MJ (2003) The
Marshall OJ (2004) PerlPrimer: Cross-platform, graphical primer design for standard, bisulphite and real-time PCR. Bioin-formatics 20:2471-2472.
McMillan DM, Fearnley SL, Rank NE and Dahlhoff EP (2005) Natural temperature variation affects larval survival, devel-opment and Hsp70 expression in a leaf beetle. Funct Ecol 19:844-852.
Ohtsuka K and Suzuki T (2000) Roles of molecular chaperones in the nervous system. Brain Res Bull 53:141-146.
Pala I, Coelho MM and Schartl M (2008) Dosage compensation by gene-copy silencing in a triploid hybrid fish. Curr Biol 18:1344-1348.
Pfaffl MW (2001) A new mathematical model for relative quanti-fication in real-time RT-PCR. Nucleic Acids Res 29:e45. Place SP and Hofmann GE (2001) Temperature interactions of the
molecular chaperone Hsc70 from the eurythermal marine gobyGillichthys mirabilis. J Exp Biol 204:2675-2682.
Reusch TBH and Wood TE (2007) Molecular ecology of global change. Mol Ecol 16:3973-3992.
Rogado L, Alexandrino P, Almeida PR, Alves J, Bochechas J, Cortes R, Domingos I, Filipe F, Madeira J and Magalhães F (2006)Squalius torgalensisEscalo do Mira. In: Cabral MJ,
Almeida J, Almeida PR, Dellinger T, Ferrand de Almeida N, Oliveira ME, Palmeirim JM, Queiroz AI, Rogado L and Santos-Reis M (eds) Livro Vermelho dos Vertebrados de Portugal. 2nd edition. Instituto da Conservação da Natu-reza/Assírio and Alvim, Lisboa, pp 99-100.
Ruijter JM, Ramakers C, Hoogaars WMH, Karlen Y, Bakker O, Hoff MJB and Moorman AFM (2009) Amplification effi-ciency: Linking baseline and bias in the analysis of quantita-tive PCR data. Nucleic Acids Res 37:e45.
Sarropoulou E, Fernandes JMO, Mitter K, Magoulasa A, Muleroc V, Sepulcrec MP, Figueras A, Novoa B and Kotoulasa G (2010) Evolution of a multifunctional gene: The warm tem-perature acclimation protein Wap65 in the European seabass
Dicentrarchus labrax. Mol Phylogenet Evol 55:640-649. Sarup P and Loeschcke V (2010) Developmental acclimation
af-fects clinal variation in stress resistance traits inDrosophila buzzatii. J Evol Biol 23:957-965.
Serazin-Leroy V, Denis-Henriot D, Morot M, de Mazancourt P and Giudicelli Y (1998) Semi-quantitative RT-PCR for comparison of mRNAs in cells with different amounts of housekeeping gene transcripts. Mol Cell Probe 12:283-291. Somero GN (2010) The physiology of climate change: How
po-tentials for acclimatization and genetic adaptation will deter-mine “winners” and “losers”. J Exp Biol 213:912-920. Sørensen JG, Dahlgaard J and Loeschcke V (2001) Genetic
varia-tion in thermal tolerance among natural populavaria-tions of
Drosophila buzzatii: Down regulation of Hsp70 expression
and variation in heat stress resistance traits. Funct Ecol 15:289-296.
Sørensen JG, Kristensen TN and Loeschcke V (2003) The evolu-tionary and ecological role of heat shock proteins. Ecol Lett 6:1025-1037.
Sørensen JG, Pekkonen M, Lindgren B, Loeschcke V, Laurila A and Merilä J (2009) Complex patterns of geographic varia-tion in heat tolerance and Hsp70 expression levels in the common frogRana temporaria. J Therm Biol 34:49-54.
Sousa-Santos C, Robalo JI and Almada VC (2009) Threatened fishes of the world:Squalius torgalensis(Coelho,
Boguts-kaya, Rodrigues and Collares-Pereira, 1998) (Cyprinidae). Environ Biol Fishes 87:123-124.
Straalen NM and Roelofs D (2006) An Introduction to Ecological Genomics. Oxford University Press, New York, pp 208-256. Tomanek L and Somero GN (2002) Interspecific- and acclima-tion-induced variation in levels of heat-shock proteins 70 (hsp70) and 90 (hsp90) and heat-shock transcription factor-1 (HSF1) in congeneric marine snails (genusTegula): Impli-cations for regulation of hsp gene expression. J Exp Biol 205:677-685.
Tymchuk VW, O’Reilly P, Bittman J, Macdonald D and Schulte P (2010) Conservation genomics of Atlantic salmon: Varia-tion in gene expression between and within regions of the Bay of Fundy. Mol Ecol 19:1842-1859.
Tomanek L (2010) Variation in the heat shock response and its implication for predicting the effect of global climate change on species’ biogeographical distribution ranges and metabolic costs. J Exp Biol 213:971-979.
Waagner D, Heckmann L, Malmendal A, Nielsen NC, Holmstrup M and Bayley M (2010) Hsp70 expression and metabolite composition in response to short-term thermal changes in
Folsomia candida (Collembola). Comp Biochem Phys A 157:177-183.
Wegele H, Müller L and Buchner J (2004) Hsp70 and Hsp90 - A relay team for protein folding. Rev Physiol Biochem Phar-macol 151:1-44.
Willems E, Leyns L and Vandesompele J (2008) Standardization of real-time PCR gene expression data from independent bi-ological replicates. Anal Biochem 379:127-129.
Yamashita M, Hirayoshi K andNagata K (2004) Characterization of multiple members of the HSP70 family in platyfish cul-ture cells: Molecular evolution of stress protein HSP70 in vertebrates. Gene 336:207-218.
Yeh FL and Hsu T (2002) Differential regulation of spontaneous and heat-induced HSP 70 expression in developing zebrafish (Danio rerio). J Exp Zool 293:349-359.
Zhang Z, Schwartz S, Wagner L and Miller W (2000) A greedy al-gorithm for aligning DNA sequences. J Comput Biol 7:203-214.
Zhou RX, Meng T, Meng HB, Cheng DX, Bin SY, Cheng J, Fu GH, Chu WY and Zhang JS (2010) Selection of reference genes in transcript expression analysis of gene expression of the Mandarin fish, Siniperca chuasti. Dongwuxue Yanjiu
31:141-146.
Internet Resources
SNIRH. Sistema Nacional de Informação de Recursos Hídricos. http://snirh.pt/ (August 22, 2010).
StatSoft I (2009) STATISTICA data analysis software system, http://www.statsoft.com.
Supplementary Material
The following online material is available for this ar-ticle:
Table S1 - Semi-quantitative PCR assessment of
hsp70transcript abundance inS. torgalensis.
Table S2 - Real-time PCR assessment ofhsp70
Table S3 - Semi-quantitative PCR assessment of
hsc70transcript abundance inS. torgalensis.
Table S4 - Real-time PCR assessment ofhsc70
tran-script abundance inS. torgalensis.
Figure S1 -hsp70transcript abundance in fin clips
and muscle.
This material is available as part of the online article from http://www.scielo.br/gmb.
Associate Editor: Alexandre Rodrigues Caetano