1 Biotechnology
Corresponding author:
Received: February 01, 2018. Accepted: July 30, 2018.
Copyright: All the contents of this journal, except where otherwise noted, is licensed under a Creative Commons Attribution License.
Associations among production and
physicochemical-quality fruit traits in Passion fruit populations
subjected to three cycles of intrapopulation
recurrent selection
Natan Ramos Cavalcante1, Alexandre Pio Viana2 ,Paulo Ricardo dos Santos3,
Sandra da Costa Preisigke4, Rodrigo Moreira Ribeiro5,Evillyn Jacinto Tofanelli6
Abstract - The present study was developed to identify the direct and indirect effects of fruit production traits in passion fruit on traits of agronomic interest as well as determine possible changes in associations between the characters after three cycles of recurrent selection. Twenty three half-sibling progenies were evaluated for the characteristics number of fruits per plant; fruit mass per plant (g); pulp percentage (%); fruit length and diameter (mm); peel thickness (mm); total soluble solids content (ºBrix); pH; and yield per plant (kg). Fruit production per plant was considered the main variable, while the others were considered explanatory variables. Within-family heritability (h2ad) values were lower than the mean heritability of the progeny (h2mp). Path analysis
revealed that the direct selection of genotypes with higher number of fruits or fruit average mass
results in increased production per plant; however, indirect selection is inefficient in providing
simultaneous gains. Therefore, by observing the correlations throughout selection cycles, it can be stated that although production per plant is the most important variable, preference should be given to the use of selection indices, as there are better chances of obtaining gains for fruit quality and production traits in selection across half-sibling passion fruit progenies.
Index terms:Passiflora edulis, plant breeding, production, correlations, REML/BLUP.
1Engenheiro Agrônomo. Doutorando em Genética e Melhoramento de Plantas pela Universidade Estadual do Norte Fluminense Darcy Ribeiro
- UENF, Campos dos Goytacazes-RJ. Brasil. E-mail: [email protected]
2Eng. Agr. Professor Associado da UENF, Campos dos Goytacazes-RJ. Brasil. E-mail: [email protected]
3Eng Agr. Doutor em Genética e Melhoramento de Plantas pela UENF, Campos dos Goytacazes-RJ. Brasil. E-mail:[email protected] 4Eng Agr. Doutora em Genética e Melhoramento de Plantas pela UENF,Campos dos Goytacazes-RJ. Brasil. E-mail:[email protected] 5Eng Agr. Doutor em Genética e Melhoramento de Plantas pela UENF, Campos dos Goytacazes-RJ. Brasil. E-mail: rodrigo.moreira85@yahoo.
com.br
6Farmacêutica. Mestra em Biociências e Biotecnologia pela UENF, Campos dos Goytacazes-RJ. Brasil. E-mail: [email protected]
Associações entre características produtivas e de qualidade
físico-química de frutos em populações de Maracujazeiro- azedo
submetidas a três ciclos de seleção recorrente intrapopulacional
Resumo - O presente trabalho teve como objetivo identificar os efeitos diretos e indiretos de
caracteres de produção de frutos de maracujazeiro-azedo sobre caracteres de interesse agronômico,
assim como verificar as possíveis mudanças de associações entre os caracteres após a realização
de três ciclos de seleção recorrente. Vinte e três progênies de meios-irmãos foram avaliadas para
as características número de frutos por planta, massa de frutos por planta (g), porcentagem de polpa (%), comprimento e diâmetro de frutos (mm), espessura da casca (mm), teor de sólidos solúveis totais (°brix), pH e produtividade por planta (kg). A característica produção de frutos por planta foi considerada a variável principal, e as demais características variáveis, explicativas. A herdabilidade dentro das famílias (h2ad) apresentou valores inferiores comparados à herdabilidade
média da progênie (h2mp). Pela análise de trilha, observou-se que a seleção direta de genótipos
com maior número de frutos ou massa média de frutos acarreta aumento na produção por planta; no entanto, a seleção indireta é ineficiente em promover ganhos simultâneos. Assim, pela verificação das correlações ao longo dos ciclos de seleção, pode-se afirmar que, apesar de a variável produção por planta ser a mais importante, deve-se dar preferência para o uso dos índices de seleção, visto que há melhores possibilidades de obtenção de ganho para características de qualidade e produção
de frutos na seleção entre as progênies de meios-irmãos de maracujazeiro-azedo.
Termos para indexação: Passiflora edulis, Melhoramento de plantas, Produção, correlações,
Introduction
Passiflora originates from Tropical America, with 150 of its species native to Brazil. The most important species of this group is Passiflora edulis Sims — known simply as ‘passion fruit’ —, which represents 95% of the
Passiflora orchards in the country in addition to being the most widely planted species of the genus worldwide (BERNACCI et al., 2008; MELETTI et al., 2011).
Ever since the 1970s, Brazil has stood out as the world’s largest producer of passion fruit, which has been the result of its growing cultivated area. In 2016, the national crop reached the production of 703,489 t, with a planted area of approximately 50,000 ha (IBGE, 2016). However, this crop is compromised by limiting factors such as low yield, caused by the lack of genotypes adapted to the producing regions, among other aspects. For this reason, selective breeding has become essential to meet these demands in the production sector (SILVA et al., 2009).
In an attempt to overcome this obstacle, the State University of Northern Rio de Janeiro (UENF) started in 1998 the passion-fruit breeding program via intrapopulation recurrent selection aiming at the release of more-productive cultivars adapted to the climatic conditions of the Norte Fluminense region and other producing regions in Brazil (VIANA et al., 2004).
Obtaining gains from selection of superior genotypes requires knowledge of both the genetic variability available in breeding populations and of associations between traits for the development of genotypes with desirable agronomic features (OLIVEIRA et al., 2010). The passion fruit crop has several traits pertaining to fruit quality. Thus, it is important to identify which are such traits that have a greater effect on fruit quality and that may be employed in the selection of fruit-bearing plants, facilitating evaluations and practices undertaken in selective breeding (LÚCIO et al., 2013).
The correlation between two traits may be of phenotypic, genotypic, or environmental nature, but only genotypic correlations — which involve an association of inheritable nature — are of greater interest in plant breeding. Despite being greatly useful in quantifying the
magnitude and direction of influences from factors on the determination of complex traits, correlation coefficients
do not indicate the exact relative importance of direct and indirect effects of those factors. Moreover, numerous situations show that associations are transitory and their estimate may be changed according to the selection process to which breeding populations are subjected (FALCONER, 1964; FAKOREDE and MOCK, 1978; WALTERS et al., 1991; FARIAS NETO and MIRANDA FILHO, 2001).
Therefore, studies investigating the decomposition
of the correlation coefficient are carried out via path
analysis (CRUZ et al., 2012). This analysis consists
of a quantification of the direct and indirect effects of
explanatory variables on a basic variable, whose estimates are obtained from regression equations, where variables are previously standardized (CRUZ et al., 2012; CABRAL et al., 2016). Thus, one of the goals of breeding programs is to identify traits that deserve greater attention in experiments, in populations under selective process.
Lúcio et al. (2013) quantified the direct and indirect
effect of explanatory variables on the total fruit production trait in the passion fruit crop and concluded that average pulp mass and number of fruits are the traits of highest correlation with total fruit mass. Those authors also reported that total soluble solids content, average fruit mass, fruit length, fruit diameter, peel thickness, and pulp percentage have a low correlation with the total fruit mass of passion fruit.
These correlation studies make it possible to identify and quantify associations between morphological and production traits and crop performance (CARVALHO et al., 2015). Viana et al. (2003) studied simple and canonical correlations between passion fruit traits and detected the existence of positive correlations between fruit mass and width, fruit width and length, and fruit acidity and width; and a negative correlation between Brix degree and fruit length.
Both path analysis and other correlation studies become more effective when grounded upon predicted genotypic values rather than when applied on phenotypic values. The latter, predicted by the mixed-models method (REML/BLUP procedure), provide more precise and accurate inferences, increasing the efficiency of breeding programs. Through BLUP (best unbiased linear prediction), phenotypic values are corrected for environmental effects and weighted by the heritability of the trait, which is estimated by the REML (restricted maximum likelihood) procedure (RESENDE, 2002; VIANA and REZENDE, 2014).
The mixed-models method has been used to generate information in selective-breeding programs for perennial species such as sugarcane (SILVA et al., 2009),
açaí (Euterpe oleracea) (TEIXEIRA et al., 2012), juçara (Euterpe edulis) (MARÇAL et al., 2015), guava (SANTOS et al., 2017), and passion fruit (SANTOS et al., 2015; SILVA et al., 2016).
Material and Methods
The experiment took place between January 2016 and January 2017 at the Experimental Unit of UENF, in Itaocara - RJ, Brazil (21º40’ S, 42º04’ W, 76 m altitude). The soil in the experimental area is considered an Ultisol (or Red-Yellow Latosol, according to the Brazilian soil
classification system; EMBRAPA, 2006).
Twenty-three half-sibling progenies originating from the breeding program of UENF via recurrent selection were evaluated. The experiment was conducted as a randomized block design with four replicates and three plants per plot.
The plant-training system adopted was vertical stalking with two 2.5-m-high posts spaced 4 m apart, with a wire no. 12, at 1.80 m above the ground. The distance between planting rows and between furrows was 3.5 m and 3 m, respectively. Liming, topdressing, and time-of-planting fertilization were performed based on the soil analysis, as recommended by Borges et al. (2006). Plants were irrigated by a supplemental dripping system at a rate of 4 L/h during the dry seasons.
For phenotyping, plants within the evaluated families were sampled for a greater control of the estimates to be obtained and to determine the existence of genetic variability between and within families. The following traits were analyzed: number of fruits per plant, fruit average mass per plant (g), pulp percentage (%), fruit length and diameter (mm), shell thickness (mm), total soluble solids content (ºBrix), pH, and yield per plant (kg).
The number of fruits per plant was determined in the harvests occurring throughout the experiment. Fruit mass was obtained as the arithmetic mean of total production per plant by total number of fruits. Pulp percentage was determined by weighing the pulps (seeds with aril) and dividing this value by the total mass of the fruits and then multiplying the result by 100. Fruit length and diameter were obtained by measuring the arithmetic mean of the longitudinal and transverse dimensions of the fruits, using a digital caliper. Peel thickness was determined using a digital caliper, by measuring the medial portion of the fruits, which were cut transversely in the direction of the larger diameter.
Total soluble solids content was determined by refractometry, using a digital refractometer (model RTD-45), with reading performed in the range of 0 to 95 ºBrix. Readings were taken by placing plant juice droplets individually. The pH was determined by immersing the sensor of a digital pH meter (potentiometer with glass electrode) (model W3B) into the juice extracted from the fruits. Yield per plant was calculated as the sum of the total harvests occurring throughout the experiment.
The restricted maximum likelihood and best unbiased linear prediction method (REML/BLUP) was adopted for the analysis of observations, using Selegen
software via a model that enables the evaluation of individuals within half-sibling progenies (RESENDE, 2016). The following model was used: y = Xr + Za + Wp + e, where = vector of data; r = vector of replicate effects
(assumed fixed) added to the overall mean; a = vector
of individual additive genetic effects (assumed random); p = vector of plot effects; and e = vector of errors or residuals (random). X, Z, and W represent the incidence matrices for the said effects.
The following variance components were estimated (REML individual): σ2
a - additive genetic
variance; σ2
f - individual phenotypic variance; h 2
a -
narrow-sense heritability, i.e., of additive effects; h2mp
- mean heritability of progenies, assuming complete survival; c2plot- coefficient of determination of plot
effects; Acprog - progeny selection accuracy, assuming complete survival.
After the means corrected by the BLUP procedure were obtained, genetic correlations between the evaluated traits were estimated from the phenotypic values (u+a) (RESENDE, 2016). The genetic correlations served as basis for the diagnosis of multicollinearity, as proposed by Montgomery and Peck (1981), and to avoid path
coefficient overestimates (CRUZ et al., 2012).
Path analysis was performed based on the genetic correlation matrix, with a least-squares estimator (CRUZ et al., 2012). One chain was considered for the construction of the causal diagram in the decomposition of the genetic relationships between production per plant, considered the main variable, and the other explanatory-variable traits. Based on the estimates of direct and indirect effects for the main variable production per plant, we checked if there were genetic correlations of high magnitude.
We also observed the response of the different genetic correlation estimates in different selection cycles to which the studied population was subjected in an attempt to evince possible alterations in the many variables studied throughout the selection cycles already carried out.
Observation analyses were undertaken using Selegen statistical software (RESENDE, 2016) and Genes software (CRUZ, 2013).
Results and discussion
The highest additive variance values (Table 1) were observed for the traits production per plant and
fruit mass (3,463 and 385.94), which suggests high genetic variability in the studied population. According to Ramalho et al. (1993), additive variance is the most important type of variance for the plant breeder, as it is responsible for the positive effect of selection.
Phenotypic variance estimates ranged from 15,829 to 0.01 (Table 1). The highest values were obtained for the traits production per plant and fruit mass (15,829 and
on the expression of these traits. Silva and Viana (2012) evaluated 140 full-sibling progenies of passion fruit originating from the second recurrent-selection cycle and obtained phenotypic variance estimates of 1,789 and 328.25 for number of fruits per plant and fruitmass, respectively. However, higher values were obtained in the present experiment, suggesting a greater environmental
influence on the expression of these traits. It should also
be mentioned that the said breeding population also has genetic variability available for the continuity of the ongoing recurrent selection program.
For heritability, we adopted the classification proposed by Resende (1995), which considers values from 0.01 to 0.15 as low; from 0.15 to 0.50 as medium; and greater than 0.50 as high. Individual narrow-sense heritability estimates (h2
a) ranged from 0.13 to 0.41 (Table
1). Only the characteristic of ºBrix (0.13) was obtained low heritability value, for these variable, there is little genetic variability available within the evaluated families, whereas the magnitudes for the remaining traits were medium. Medium- and high-magnitude heritabilities indicate a favorable situation for selective breeding on these traits (VIANA et al., 2004).
In this way, the highest estimates for the mean broad-sense heritability of the progeny (h2mp) were
observed for number of fruits and fruit length (0.55 and
0.51, respectively), classified as high-magnitude values
(Table 1). It is thus clear that selection between progenies can generate high-magnitude gains due to the negative genetic control of the trait, thereby promoting the selection of promising genotypes.
Within-family heritability (h2ad) values were lower
compared with the mean heritability of the progeny (h2mp)
(Table 1), and genetic gain was lower within families than between families. In this case, one should preferably perform selection between families with a view to better exploiting genetic variability and increasing genetic gains.
Table 1 also contains the coefficient of determination
of environmental effects between plots (c2plot), which
quantifies variability within blocks, where higher coefficients mean higher environmental variability between plots. According to Farias Neto et al. (2008), good experiments on perennial plants describe this
coefficient as being around 10%. In this context, for the
characteristics peel thickness and soluble solids content was found environmental variability, superior to 10%, for other characteristics the environmental variables were smaller, determining good experimental precision in terms of data analysis.
In the present study, accuracy values were considered of high magnitude (Table 1). Resende and
Duarte (2007) stated that precision is classified as very high
for accuracy between 0.90 and 0.99, high when between 0.70 to 0.85, moderate between 0.50 and 0.65, and low between 0.10 and 0.40. All the evaluated characteristics
presented high and moderate precision. Accuracy values greater than 0.70 indicate good experimental quality
and consequently efficient selection of genotypes for
recombination, since high accuracy is indicative of an optimal relationship between predicted and real values. Contrastingly, low-accuracy estimates are usually related to low-heritability estimates. In this way, because it is associated with selection precision, accuracy is the main element of the genetic progress that can be altered by the breeder for maximized genetic gains (VIANA and RESENDE, 2014).
Table 2 describes the genotypic correlation
coefficients between the fruit production and quality traits. As stated by Carvalho et al. (2004), correlation coefficients
may take on a range of values, being null for values equal to zero; weak between zero and 0.30; medium between 0.30 and 0.60; strong from 0.60 to 0.90; and very strong between 0.90 and 1.00.
Therefore, the highest positive genetic correlation estimates were observed for production per plant × number of fruits (0.9512) and pulp × ºBrix (0.5664) (Table 2). According to Carvalho et al. (2004), they are respectively in the range between very strong and medium correlation (Table 2). Gains can thus be obtained from correlated responses for production per plant and number of fruits as well as pulp percentage and Brix. However, the other correlations between the traits were lower than 0.44.
For the traits number of fruits and fruit production
per plant, a negative association was observed with
fruit mass (‒0.5134 and ‒0.2646), fruit length (‒0.2104 and ‒0.0726), ºBrix (‒0.3681 and ‒0.3876), and pulp percentage (‒0.3351 and ‒0.3834). By contrast, these
traits had positive correlations with fruit diameter (0.2933 and 0.402), peel thickness (0.0059 and 0.1387), and pH (0.4044 and 0.3938) (Table 2). These results indicate that selection of plants with a higher number of fruits or larger production per plant will result in plants with lower fruit mass, length, ºBrix, and pulp percentage. On the other hand, increased fruit diameter, peel thickness, and pH will be present. Viana et al. (2003) estimated a positive
and significant genetic correlation between number of
fruits and fruit mass for the environment of Campos dos
Goytacazes (0.59), contradicting the above-stated findings.
It is noteworthy that an increase in fruit mass will result in increased fruit length, as evinced by the positive correlation (0.4406) between these two traits. This is extremely desirable, since passion fruits are commercially
classified based on their length and diameter, and larger
Table 1. Estimates of genetic parameters: genotypic variance among progenies of passion fruit (σ2
a), individual
phenotypic variance (σ2
f), heritability in the narrow sense (h 2
a), heritability based on the progeny mean (h
2mp), additive
heritability within the family (h2ad),determination coefficient of plot effects (c2parc), accuracy of progeny selection
(Acprog), acquired by the REML procedure, and mean, for production and quality traits of passion fruit.
Traits Genetic Parameters
σ2
a σ
2
f h
2
a h
2mp h2ad c2parc Ac
prog
Number of fruits 259.46 622.59 0.41 0.55 0.37 0.05 0.74 Production per plant 3,463 15,829 0,21 0,36 0,19 0,10 0,60 Fruit mass 385.94 1,179 0.32 0.48 0.28 0.05 0.69 Fruit length 13.75 41.69 0.33 0.51 0.27 0.004 0.71 Diameter of fruit 7.33 20.41 0.35 0.53 0.29 0.005 0.73 Peel thickness 0.31 1.25 0.24 0.38 0.22 0.11 0.62 Soluble solids content 0.22 1.71 0.13 0.23 0.12 0.16 0.47
PH 0.003 0.01 0.21 0.36 0.18 0.08 0.60
Pulp percentage 10.60 35.10 0.30 0.48 0.25 0.01 0.69
Table 2.Genotype correlation coefficients between production and quality traits of passion fruit.
Traits1 PROD FM FL DF PT °BRIX PH PP
NF 0.9512** -0.5134* -0.2104 0.2933 0.0059 -0.3681 0.4044* -0.3351* PROD -0.2646* -0.0726 0.402* 0.1387 -0.3876* 0.3938* -0.3834* FM 0.4406* 0.0981 0.1915 0.1008 -0.1158 0.0832
FL 0.3433* 0.1705 -0.0013 -0.2927* -0.046 DF 0.1069 -0.1478 -0.2178* -0.2887*
PT -0.1656 0.23 -0.687**
°BRIX -0.3581* 0.5664*
PH -0.2283
1 =Number of fruits (NF); Production per plant (PROD); Fruit mass (FM); Fruit length (FL); Diameter of fruit (DF); Peel thickness (PT); Total
soluble solids content (°Brix); PH; and Percent pulp (PP). ** Significant at 1% of T teste, * Significant at 5% of T teste.
There was also a negative correlation between peel
thickness and pulp percentage (‒0.687), indicating that
an increase in peel thickness reduces the diameter of the internal fruit cavity, where the edible pulp accumulates. Fortaleza et al. (2005) submitted that passion fruits are preferred when they have a thinner peel, as there will be more pulp. The peel thickness is used as a quality criterion when increased space is desired in the internal chamber of the passion fruit (ovarian chamber). Thus, fruits intended for both the industry and fresh consumption must have a
thin peel and a fully filled internal cavity, providing high
juice yields (BRUCKNER et al., 2002).
Difficulty is observed in obtaining genetic gains
for the trait ºBrix due to its low heritability value. However, gains can be obtained indirectly with the trait
pulp percentage (0.5664) and, consequently, fruits with a higher ºBrix have also a larger amount of pulp. The study of correlations allows the prediction of effects on a given trait when another one correlated with it is manipulated through selective processes. Therefore, it is possible to establish the feasibility of performing selection on another easily measurable trait when aiming to obtain gains of hard assessment or low heritability (CRUZ et al., 2012).
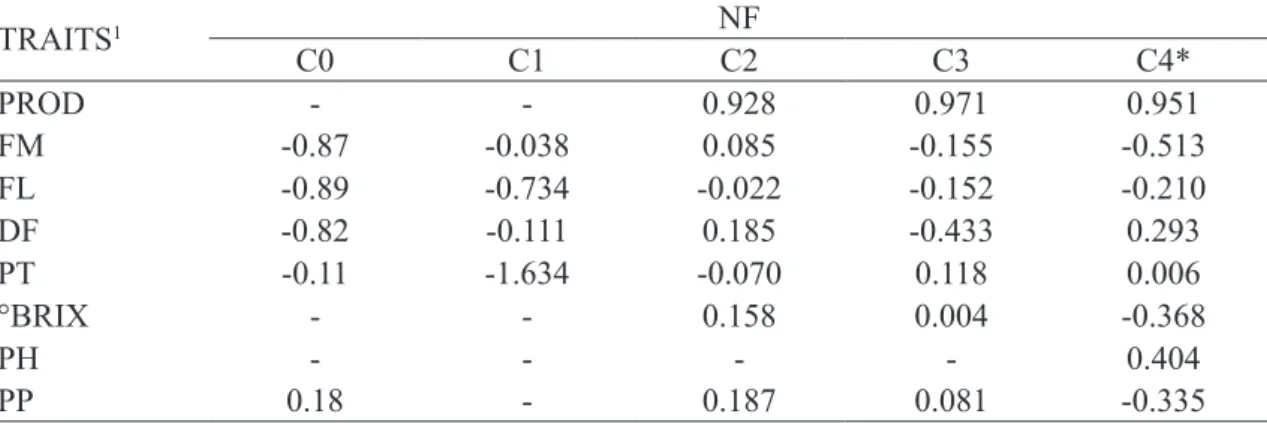
We also examined the correlation between qualitative and quantitative traits and how they correlate with the trait number of fruits (NF) throughout the first three cycles of recurrent selection and the current ongoing cycle (C4) (Table 3). This trait was chosen because it was evaluated in all cycles already performed and because it is strongly correlated with total fruit production per plant, precisely because higher-yielding plants with better nutritional quality are sought. In this regard, the correlation between NF and production was very strong in all cycles where total fruit production per plant was assessed (C2: 0.928; C3: 0.971; and C4: 0.951). Therefore, plants with elevated potential to produce a larger number of fruits are those presenting a larger production per area unit, which has been occurring throughout the cycles. The same is not true for fruit mass (FM), for which case heavier fruits were expected to mean a higher total production. On the contrary, negative values can be observed between NF and FM for all cycles, except C2, where the correlation was positive but very low (0.085), and considered null by Carvalho et al. (2004). The traits fruit length, fruit
weak. This reinforces the need for acuity in the selection
process, since these traits determine the final fruit quality,
which should be a goal in a breeding program. However, these are negatively correlated with production and number of fruits, which are also highly desirable. In this way, breeding strategies should be adopted to overcome this obstacle in the breeding of passion fruit, wherein selection indices are an excellent alternative. The pH of the fruits was only evaluated in cycle C4 and showed a correlation of medium magnitude with number of fruits (0.404). Greater attention should be given to the pH in the following selection cycles, since the Technical Regulation for the Establishment of Identity and Quality Standards (Regulamento Técnico para a Fixação dos Padrões de
Identidade e Qualidade - PIQ) for passion fruit pulp of the Brazilian Ministry of Agriculture determines that pH should be between 2.70 and 3.80. Therefore, genetic progress in the population is also aimed at meeting the adequate values for this trait.
The multicollinearity diagnosis performed based on genetic correlations indicated a number of conditions equal to 440.2, which can be classified as moderate multicollinearity (MONTGOMERY and PECK, 1981). Consequently, there were no overestimates of path correlation coefficients in this study, and thus no variables were discarded. Only a severe multicollinearity
overestimates both the simple correlation coefficients and
the direct effects on the basic variable estimated by path analysis (COIMBRA et al., 2005).
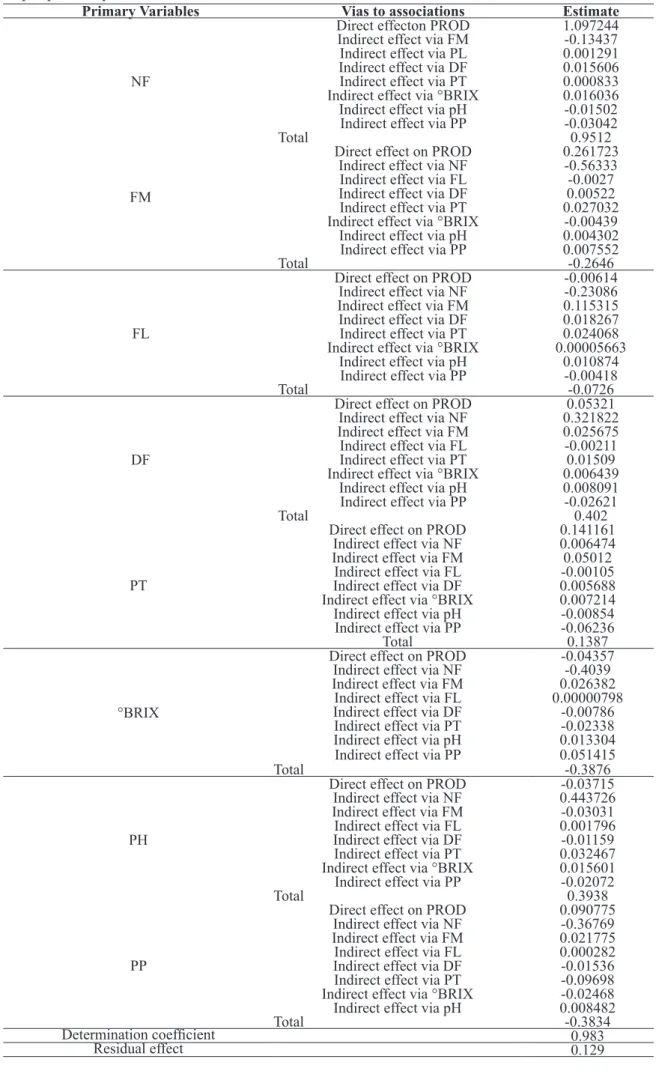
As shown in Table 4, the coefficient of determination
(0.98) and the residual effect (0.12) demonstrate that the main variable is entirely explained by the primary components. These results corroborate Negreiros et al.
(2007), who obtained a coefficient of determination of
1.00 by path analysis in passion fruit.
The primary component number of fruits had the highest direct effect (1.09) on total fruit production, but a
negative indirect effect via fruit mass (‒0.13). The direct
effect of fruit mass on production per plant was 0.26, but a
negative effect was obtained via number of fruits (‒0.56).
By analyzing pulp percentage, a negative direct
effect (‒0.09) was observed on the variable production per plant. For the ºBrix trait, direct and indirect gains were mostly negative and low, making simultaneous selection for these traits ineffective.
These results denote that the direct selection of progenies with higher number of fruits or fruit mass lead to increased production per plant. However, indirect
selection will not be efficient in providing simultaneous
gains for production per plant. To address this problem, it is suggested that simultaneous gains can be achieved through the use of selection-index strategies, as proposed by Cabral et al. (2016) and Santos et al. (2017).
Table 3. Genotype correlation coefficients among nine agronomic traits in the passion fruit population over four
recurrent selection cycles.
TRAITS1 NF
C0 C1 C2 C3 C4*
PROD - - 0.928 0.971 0.951
FM -0.87 -0.038 0.085 -0.155 -0.513 FL -0.89 -0.734 -0.022 -0.152 -0.210 DF -0.82 -0.111 0.185 -0.433 0.293 PT -0.11 -1.634 -0.070 0.118 0.006
°BRIX - - 0.158 0.004 -0.368
PH - - - - 0.404
PP 0.18 - 0.187 0.081 -0.335
C4* = Fourth recurrent selection cycle in execution phase.
1 = Number of fruits (NF); Production per plant (PROD); Fruit mass (FM); Fruit length (FL); Diameter of fruit (DF); Peel thickness (PT); Total
Table 4.Estimates of direct and indirect effects of dependent variables number of fruits per plant. fruit mass per plant. pulp percentage. fruit length and diameter. peel thickness. total soluble solids content and pH on the main variable production per plant of passion fruit.
Primary Variables Vias to associations Estimate
NF
Direct effecton PROD 1.097244
Indirect effect via FM -0.13437
Indirect effect via PL 0.001291
Indirect effect via DF 0.015606
Indirect effect via PT 0.000833
Indirect effect via °BRIX 0.016036
Indirect effect via pH -0.01502
Indirect effect via PP -0.03042
Total 0.9512
FM
Direct effect on PROD 0.261723
Indirect effect via NF -0.56333
Indirect effect via FL -0.0027
Indirect effect via DF 0.00522
Indirect effect via PT 0.027032
Indirect effect via °BRIX -0.00439
Indirect effect via pH 0.004302
Indirect effect via PP 0.007552
Total -0.2646
FL
Direct effect on PROD -0.00614
Indirect effect via NF -0.23086
Indirect effect via FM 0.115315
Indirect effect via DF 0.018267
Indirect effect via PT 0.024068
Indirect effect via °BRIX 0.00005663
Indirect effect via pH 0.010874
Indirect effect via PP -0.00418
Total -0.0726
DF
Direct effect on PROD 0.05321
Indirect effect via NF 0.321822
Indirect effect via FM 0.025675
Indirect effect via FL -0.00211
Indirect effect via PT 0.01509
Indirect effect via °BRIX 0.006439
Indirect effect via pH 0.008091
Indirect effect via PP -0.02621
Total 0.402
PT
Direct effect on PROD 0.141161
Indirect effect via NF 0.006474
Indirect effect via FM 0.05012
Indirect effect via FL -0.00105
Indirect effect via DF 0.005688
Indirect effect via °BRIX 0.007214
Indirect effect via pH -0.00854
Indirect effect via PP -0.06236
Total 0.1387
°BRIX
Direct effect on PROD -0.04357
Indirect effect via NF -0.4039
Indirect effect via FM 0.026382
Indirect effect via FL 0.00000798
Indirect effect via DF -0.00786
Indirect effect via PT -0.02338
Indirect effect via pH 0.013304
Indirect effect via PP 0.051415
Total -0.3876
PH
Direct effect on PROD -0.03715
Indirect effect via NF 0.443726
Indirect effect via FM -0.03031
Indirect effect via FL 0.001796
Indirect effect via DF -0.01159
Indirect effect via PT 0.032467
Indirect effect via °BRIX 0.015601
Indirect effect via PP -0.02072
Total 0.3938
PP
Direct effect on PROD 0.090775
Indirect effect via NF -0.36769
Indirect effect via FM 0.021775
Indirect effect via FL 0.000282
Indirect effect via DF -0.01536
Indirect effect via PT -0.09698
Indirect effect via °BRIX -0.02468
Indirect effect via pH 0.008482
Total -0.3834
Determination coefficient 0.983
Conclusions
It is possible to obtain gains from selection between half-sibling progenies in passion fruit.
The traits number of fruits and fruit mass have a greater direct effect on fruit production in half-sibling
families. Indirect effects have little influence on fruit
production.
Selection indices are a recommended strategy for consecutive gains in fruit quality and production traits, in passion fruit.
References
B E R N A C C I , L . C . ; S O A R E S - S C O T T, M . D . ; JUNQUEIRA, N.T.V.; PASSOS, I.R. da S.; MELETTI, L.M.M. Passiflora edulis Sims: the correct taxonomic way to cite the yellow passion fruit (and of others colors). Revista Brasileira de Fruticultura, Jaboticabal, v.30, n.2, p.566-576, 2008. (1)
BORGES, A.L.; CALDAS, R.C.; LIMA, A. de A. Doses e fontes de nitrogênio em fertirrigação no cultivo do maracujá-amarelo. Revista Brasileira de Fruticultura, Jaboticabal, v.28, p.301-304, 2006. (1)
BRUCKNER, C.H.; MELETTI, L.M.M.; OTONI, W.C.; ZERBINI JÚNIOR, F.M.. Maracujazeiro. In: BRUCKNER, C. H. Melhoramento de fruteiras tropicais. Viçosa: Editora UFV, 2002. 422 p. (2)
CABRAL, P.D.S.; AMARAL JÚNIOR, A.T.; FREITAS, I.L.J.; RIBEIRO, R.M.; SILVA, T.R.C. Relação causa e efeito de caracteres quantitativos sobre a capacidade de expansão do grão em milho-pipoca. Revista Ciência Agronômica, Fortaleza, v. 47, p. 108-117, 2016. (1)
CARVALHO, F.I.F; LORENCETTI, C.; BENIN, G. Estimativas e implicações da correlação no melhoramento vegetal. Pelotas: UFPel, 2004. 142p. (2)
CARVALHO, I. R.; SOUZA, V. Q.; NARDINO, M.; FOLLMANN, D. N.; SCHMIDT, D.; BARETTA, B.
Correlações canônicas entre caracteres morfológicos e componentes de produção em trigo de duplo propósito.
Pesquisa Agropecuária Brasileira, Brasília, DF, v.50,
p.690-697, 2015. (1)
COIMBRA, J.L.M.; BENIN, G.; VIEIRA, E.A.; OLIVEIRA, A.C.; CARVALHO, F.I.F.; GUIDO LIM, A.F.; SOARES, A.P. Conseqüências da multicolinearidade sobre a análise de trilha em canola. Ciência Rural, Santa Maria, v.35, p.347-352, 2005. (1)
CRUZ, C.D. GENES: a software package for analysis in experimental statistics and quantitative genetics. Acta Scientiarum. Agronomy, Maringá, v.35, p.271-276, 2013. (1)
CRUZ, C.D.; REGAZZI, A.J.; CARNEIRO, P.C.S.
Modelos biométricos aplicados ao melhoramento genético. 4ª ed. Viçosa: UFV, 2012. 514p. (2)
EMBRAPA - Empresa Brasileira de Pesquisa Agropecuária.
Sistema brasileiro de classificação de solos. 2.ed. Rio
de Janeiro: Centro Nacional de Pesquisa do Solo, 2006. 306p. (1)
FAKOREDE, M.A.B.; MOCK, J.J. Changes in morphological and physiological traits associated with recurrent selection for grain yield in maize. Euphytica, Dordrecht, v.27, p.397-409, 1978. (1)
FALCONER, D.S. Introduction to quantitative genetics. 2.ed. New York: Ronald Press, 1964. 365p. (2)
FARIAS NETO, A.L.; MIRANDA FILHO, J. B. Genetic correlation between traits in the ESALQ-PB1 maize population divergently selected for tassel size and ear height. Scientia Agricola, Piracicaba, v.58, n.1, p.119– 123, 2001. (1)
FARIAS NETO, J.T.; RESENDE, M.D.V.; OLIVEIRA, M.S.P.; NOGUEIRA, O.L.; FALCÃO, P.N.B.; SANTOS, N.S.A. Estimativas de parâmetros genéticos e ganhos de seleção em progênies de polinização aberta de açaizeiro. Revista Brasileira de Fruticultura, Jaboticabal, v.30, n.4, p.051-1056, 2008. (1)
FORTALEZA, J.M.; PEIXOTO, J.R.; JUNQUEIRA,
N.T.V.; OLIVEIRA, A.T.; RANGEL, L.E.P. Características físicas e químicas em nove genótipos de maracujá-azedo cultivado sob três níveis de adubação potássica. Revista Brasileira de Fruticultura, Jaboticabal,v.27, n.1, p.124-127, 2005. (1)
IBGE - Instituto Brasileiro de Geografia e Estatística.
Produção agrícola 2016. Rio de Janeiro: Banco de Dados
Agregados – SIDRA, 2015. Disponível em: <https://sidra. ibge.gov.br/tabela/5457#resultado>. Acesso em: 7 maio 2018. (5)
L Ú C I O , A . D . ; S TO R C K I , L . ; K R A U S E , W. ;
GONÇALVES, R.Q.; NIED, A.H. Relações entre os
caracteres de maracujazeiro-azedo. Ciência Rural, Santa Maria, v.43, p.225-232, 2013. (1)
MARÇAL, T.S.; FERREIRA, A.; OLIVEIRA, W.B.S.;
GUILHEN, J.H.S.; FEREIRA, M.F.S. Correlações
MELETTI, L.M.M. Avanços na cultura do maracujá no Brasil. Revista Brasileira de Fruticultura, Jaboticabal, v.33, n.1, p. 83-91, 2011. (1)
MONTGOMERY, D.C.; PECK, E.A. Introduction to linear regression analysis. New York: John Wiley, 1981. 504p. (2)
NEGREIROS, J.R.S.; ÁLVARES, V.S.; BRUCKERM C.H.; MORGADO, M.A.D,; CRU, C.D. Relação
entre características físicas e o rendimento de polpa de
maracujá-amarelo. Revista Brasileira de Fruticultura, Jaboticabal, v.29, p.546-549, 2007. (1)
OLIVEIRA, E.J.; LIMA, D.S.; LUCENA, R.S.; MOTTA,
T.B.N.; DANTAS, J.L.L. Correlações genéticas e análise de trilha para número de frutos comerciais por planta em
mamoeiro. Pesquisa Agropecuária Brasileira, Brasília,
DF, v.45, p.855-862, 2010. (1)
RAMALHO, M.A.P.; SANTOS. J.B. dos; ZIMMERMANN, M.J.O. Genética quantitativa em plantas autógamas: aplicações ao melhoramento do feijoeiro. Goiânia: UFG, 1993. 171p. (2)
RESENDE, M. D. V. Delineamento de experimentos de seleção para maximização da acurácia seletiva e do progresso genético. Revista Árvore, Viçosa, MG, v.19, n.4, p.479-500, 1995. (1)
RESENDE, M.D.V. de. Software Selegen-REML/BLUP: a useful tool for plant breeding. Crop Breeding and Applied Biotechnology, Londrina, v.16, p.330-339, 2016. (1)
RESENDE, M.D.V. de; DUARTE, J.B. Precisão e controle de qualidade em experimentos de avaliação de cultivares.
Pesquisa Agropecuária Tropical, Goiânia, v.37, p.182-194, 2007. (1)
RESENDE, M.D.V. Genética biométrica e estatística no melhoramento de plantas perenes. Brasília: Embrapa
Informação Tecnológica, 2002. 975 p. (2)
SANTOS, E.A.; VIANA, A.P.; FREITAS, J.C.O.; RODRIGUES, D.L.; TAVARES, R.F.; PAIVA, L.C.; SOUZA, M.M. Genotype selection by REML/BLUP methodology in a segregating population from an interspecific Passiflora spp. crossing. Euphytica, Dordrecht, v.204, n.1, p.1–11, 2015. (1)
SANTOS, P.R.; PREISIGKE, S.C.; VIANA, A.P.; CAVALCANTE, N.R.; SOUSA, C.M.B.; AMARAL JÚNIOR, A.T. Associations between vegetative and production traits in guava tree full-sib progenies. Pesquisa Agropecuária Brasileira, Brasília, DF, v.52, p.303-310,
2017. (1)
SILVA, F.H.L.; MUÑOZ, P.R.; VINCENT, C.I.; VIANA, A.P. Generating relevant information for breeding
Passiflora edulis : genetic parameters and population structure. Euphytica, Dordrecht, v.208, p.609–619, 2016. (
SILVA, F.L.; PEDROZO, C.A.; BARBOSA, M.H.P.; RESENDE, M.D.V.; PETERNELLI, L.A.; COSTA, P.M.A.; VIEIRA, M.S. Análise de trilha para os
componentes de produção de cana-de-açúcar via blup.
Revista Ceres, Viçosa, MG, v.56, p.308-314, 2009. (1)
SILVA, M.G.M.; VIANA, A.P. Alternativas de seleção em população de maracujazeiro-azedo sob seleção recorrente intrapopulacional. Revista Brasileira de Fruticultura, Jaboticabal, v.34, n.2, p. 525–531, 2012. (1)
SILVA, M.G.M.; VIANA, A.P.; GONCALVES, G.M.; AMARAL JUNIOR, A.T.; PEREIRA, M.G. Seleção recorrente intrapopulacional no maracujazeiro amarelo: Alternativa de capitalização de ganhos genéticos. Ciência e Agrotecnologia, Lavras, v.33, p.170-176, 2009. (1)
TEIXEIRA, D.H.L.; OLIVEIRA, M.S.P.; GONÇALVES,
F.M.A.; NUNES, J.A.R. Correlações genéticas e análise de
trilha para componentes de produção de frutos de açaizeiro.
Revista Brasileira de Fruticultura, Jaboticabal, v.34, p.1135-1142, 2012. (1)
VIANA, A.P.; PEREIRA, T.N.S.; PEREIRA, M.G.; AMARAL JÚNIOR, A.T. do; SOUZA, M.M. de; MALDONADO, J.F.M. Parâmetros genéticos em
populações de maracujazeiro-amarelo. Revista Ceres, Viçosa, MG, v.51, p.545-555, 2004. (1)
VIANA, A.P.; PEREIRA, T.N.S.; PEREIRA, M.G.; SOUZA, M.M.de; MALDONADO, J.F.M.; AMARAL JÚNIOR, A.T.do. Simple and canonic correlation between agronomical and fruit quality traits in yellow passion fruit (Passiflora edulis f. flavicarpa) populations. Crop Breeding and Applied Biotechnology, Londrina, v.3, n.2, p.133-140, 2003. (1)
VIANA, A.P.; RESENDE, M.D.V. Genética quantitativa no melhoramento de fruteiras. Rio de Janeiro: Interciência, 2014. 296p. (2)