ISSN 0100-2945 http://dx.doi.org/10.1590/0100-29452017481
REPEATABILITY OF FRUIT QUALITY
TRAITSOF CACTUS PEAR
1VALTÂNIA XAVIER NUNES2, NÚBIA XAVIER NUNES3,
CARLINNE GUIMARÃES DE OLIVEIRA4, RAQUEL RODRIGUES SOARES SOBRAL5,
CARLOS EDUARDO MAGALHÃES DOS SANTOS 6
ABSTRACT - Repeatability analysis has been used to study traits in several crops, assisting in the definition
of the minimum number needed to evaluate genotypes more efficiently and with less time and resource consumption. So far, however, no repeatability studies on cactus pear have been found in the literature. The objective of this study was to determine the coefficient of repeatability for cactus pear fruits traits and the
minimum number of evaluations (fruit) that can provide acceptable accuracy for the prediction of the true
value. The experiment was conducted at the Federal Institute of Bahia/Campus Guanambi, with 150 fruits collected from three municipalities in the state of Bahia. The coefficients of repeatability were estimated by
the methods of analysis of variance, principal components based on the covariance (PCCV) and correlation (PCC) matrices, and structural analysis based on the correlation matrix (SA). The analysis of variance
showed that, except for fruit diameter, the effect of the production site (municipality) was significant for all traits evaluated. The PCCV method was proven the most suitable for studying the repeatability of quality traits of cactus pear fruits. Seven fruits were required to determine, with 90% confidence, the traits length, diameter, fruit firmness, skin thickness, number of seeds, fruit mass, bark mass, pulp mass, pH, titratable
acidity, soluble solids, SS/AT ratio, and pulp yield.
Index terms: Opuntia ficus-indica, sample size, components of variance, phenotypic covariance.
REPETIBILIDADE PARA CARACTERES DE QUALIDADE
DE FRUTOS DE FIGUEIRA DA ÍNDIA
RESUMO – A análise de repetibilidade tem sido utilizada para estudo de caracteres de diversas culturas,
auxiliando na definição do número mínimo necessário para avaliações de genótipos com maior eficiência e menor consumo de tempo e recursos. Todavia, para a figueira da índia não foi encontrada na literatura pesquisas dessa natureza. Assim, este estudo teve como objetivo determinar o coeficiente de repetibilidade para características do fruto de figueira da índia e o número mínimo de avaliações (fruto) capaz de proporcionar confiabilidade aceitáveis para a predição do valor real. O trabalho foi desenvolvido no Instituto Federal
Baiano/Campus Guanambi, analisando-se 150 frutos, provenientes de três municípios do estado da Bahia.
Os coeficientes de repetibilidade foram estimados pelos métodos da análise de variância, componentes principais com base na matriz de covariância (CPCV) e de correlações (CPC), e análise estrutural com base na matriz de correlações (AE). A análise de variância mostrou que, com exceção do diâmetro dos frutos, o efeito do local de produção (município) foi significativo para todas as características avaliadas. O método dos CPCV demonstrou ser o mais adequado para o estudo da repetibilidade para características de qualidade dos frutos da figueira da índia. São necessários 7 frutos, para determinar, com 90% de confiança, os caracteres comprimento, diâmetro, firmeza do fruto, espessura da casca, número de sementes, massa do fruto, massa da casca, massa da polpa, pH, acidez titulável, sólidos solúveis, relação SS/AT e rendimento de polpa em figueira da índia.
Termos para indexação:Opuntia ficus-indica, tamanho de amostra, componentes de variância, covariância
fenotípica.
1(Paper 083-16). Receivied June 21, 2016. Accepted November 11, 2016.
2Technologist in Agroindustry. Agronomy Doctoral student at Universidade Federal de Viçosa.E-mail: tania_chavier@yahoo.com.br 3Agronomy Graduate Student at Universidade Estadual de Montes Claros. E-mail: nubiaxn@hotmail.com
4Zootechnist., M.Sc. Prof. at Instituto Federal Baiano. E-mail: carlinne.guimaraes@guanambi.ifbaiano.edu.br
2
INTRODUCTION
Cactus pear (Opuntia ficus-indica (L.) Mill.) is a species of cactus originated from Mexico and cultivated for fruit production in many parts of
the world, mainly under rainfed conditions, with
important commercial plantations in Italy, Israel, and Mexico (MANICA, 2002).
Cactus pear has attracted increasing attention
in both domestic and export markets for its nutritional health promotion benefits due to its contents of fiber,
soluble carbohydrates, calcium, magnesium, and
vitamins (mainly A and C); as well as the possibility of exploiting medicinal properties, with several
biological activities, including antioxidant and
anti-inflammatory properties (GALATI et al., 2003;
ZHONG et al., 2010; YAHIA and JACOBO, 2011). In Brazil, the plant is named forage palm
and is mostly cultivated as animal fodder, with
extensive cultivated areas mainly in the northeastern semi-arid region (PINHEIRO et al., 2014), though the fruits have been exploited through extractivism. Thus, cactus pear production has a high potential for
price and income aggregation, which may lead to improvements in the quality of life for the Brazilian semiarid population. However, the varieties of this crop available were selected for animal feeding,
pointing out the need to search for genetic materials
that produce quality fruits and the characterization of the genetic variability to initiate breeding works.
In the stages of characterization of germplasm
bank accessions or even to perform characterization of fruits, a recurrent question among researchers is about the number of fruits that make a sample
representative of the population to be studied.
Knowing the number of sample units to be collected
in prospecting expeditions is crucial. This information is important for scheduling collection expeditions,
in order to optimize the time and area required for
collecting and transporting genetic material that can
be incorporated into breeding programs (Manfio et
al., 2011).
According to Cardoso (2006), breeding programs tend to reduce or eliminate the time
spent with evaluating repetitions more than it is necessary, as well as tend to avoid the evaluation of a small number of repetitions that would incur
probable estimation errors, leading to failure in
the identification of superior genotypes. Therefore, knowing the coefficient of repeatability allows the
plant breeder to carried out the evaluation phase
efficiently, optimizing the time, financial resources,
and labor.
Repeatability expresses the maximum value
that the heritability can reach, because it expresses
the proportion of the phenotypic variance, which
is attributed to the genetic differences confounded
with the permanent effects that affect the cultivar or progeny. Thus, repeatability, like heritability, is an indispensable tool for guiding improvement work.
In this sense, high estimates of the repeatability of a trait indicate that it is possible to predict the true
value of the individual with a relatively small number
of measurements (Cruz et al., 2012).
The repeatability analysis has been applied to several species, including bacabi (Oenocarpus
mapora Karsten) (OLIVEIRA and MOURA, 2010),
araça (Psidium cattleyanum) and pitanga (Eugenia uniflora) (DANNER et al., 2010); passionfruit
(NEVES et al., 2010), macaw palm (Acrocomia aculeata) (MANFIO et al., 2011), peach (BRUNA et al., 2012); soybean (MATSUO et al., 2012), peach palm (Bactris gasipaes) (BERGO et al., 2013), and
sweet orange (NEGREIROS et al., 2014). However, no repeatability studies on cactus pear fig have been
found in the literature so far.
Thus, the objective of this work was to determine the repeatability coefficient of of cactus
pear fruit traits and the minimum number of evaluations (sample units) capable of providing
confidence to predictors of the true value.
MATERIAL AND METHODS
The study was conducted at the Instituto
Federal Baiano - Campus Guanambi, located in the municipality of Guanambi/BA, using for the analyses cactus pear fruits of cv. Gigante from crops intended
for animal feed, without cultural managements of
irrigation, fertilization, and control of pests and
diseases. Fruits were harvested from small farms
located in three municipalities in the semi-arid region of the state of Bahia: Guanambi located at 14º13’24’’
south latitude and 42º46’53’’ west longitude, 530 m altitude; Pindaí located at 14º29’33’’ south latitude and 42º41’14’’ west longitude, 610 m altitude; and
Riacho de Santana located at 13º36’33’’ south latitude
and 42º56’20’’ west longitude, 627 m altitude. Fifty fruits were collected randomly from
plants of the same crop of each municipality, at the same maturation stage, for analyses of physical and
physico-chemical characteristics. The following physical characteristics were measured: longitudinal
length and diameter by direct measurement using a digital caliper and expressed as centimeters; mass
of fruit, skin, and pulp by individual weighing on
a digital analytical scale and expressed as grams;
individually at two distinct points of the equatorial
region on the intact fruit uaing a digital dynamometer
and expressed as Newtons (N); number of seeds per
fruit by counting in each fruit, and pulp yield by dividing pulp mass by fruit mass and multiplying by 100, and expressed as percentage.
The physico-chemical characteristics were:
pH by direct reading using a bench potentiometer
with glass membrane electrode calibrated with
solutions of pH 4.0 and 7.0; titratable acidity by
titration with 0.1N sodium hydroxide using 1% phenolphthalein as indicator and expressed as %
of citric acid; soluble solids by direct reading in a digital refractometer and expressed as ºBrix; and the SS/AT ratio obtained by dividing soluble solids by titratable acidity and expressed as absolute value, to
two decimal places. All physico-chemical analyses were performed following the methodologies of the
Analysis Manual of the Instituto Adolfo Lutz (IAL, 2008).
Estimates of repeatability coefficients were
obtained by the methods of analysis of variance, principal components based on the covariance (PCCV) and correlation (PCC) matrices, and structural analysis based on the correlation matrix (SA).
The estimates of the repeatability coefficients, number of measurements required to predict the
true value of the individuals, and the genotypic
determination were based on the statistical models
described by Cruz et al. (2012) and obtained by the repeatability procedure of the GENES program (CRUZ, 2013).
RESULTS AND DISCUSSION
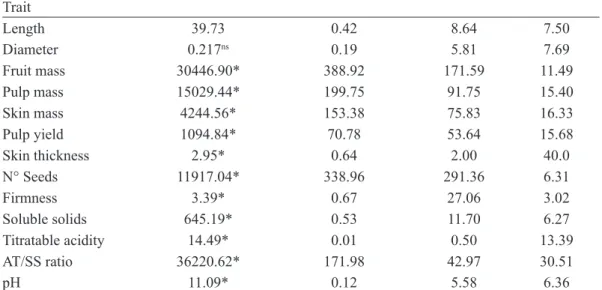
The analysis of variance showed that, except
for fruit diameter, the effect of the production site
(municipality) was significant for all traits evaluated
(Table 1), indicating the existence of environmental variability among the sites.
The repeatability coefficients (
r
ˆ
) estimatedby the methods Anova and Structural Analysis (AE)
provided the lowest values, independent of the trait
analyzed, thus, a larger number of fruits are needed
for the evaluation in order to provide confidence to
the estimates obtained through these methodologies (Table 2).
The univariate method (Anova) provides
the lowest repeatability coefficients because it does not allow us to isolate the component of genotypic variance used to estimate the repeatability, which is
part of the variance of the environment (COSTA,
2003) and when is incorporated into the estimate,
it increases the experimental error and may underestimate the repeatability (NEGREIROS et
al., 2014). This fact is evident, due to the significant
difference found among the production sites by the analysis of variance.
In this case, the repeatability coefficient is more efficiently estimated by the principal
components of the covariance matrix, which takes
into account the cyclic behavior of the trait (DANNER et al., 2010), because the alternating effect is included
into the experimental error ( Manfio et al., 2011). In similar studies carried out with hybrids of African
Oil Palm (Elaeis guineensis Jacq.) and Brazilian Oil Palm (Elaeis oleifera (H.B.K.) Cortés) (Chia et
al., 2009), araça (Psidium cattleyanum) and pitanga (Eugenia uniflora) (DANNER et al., 2010); peach palm (Bactris gasipaes) (BERGO et al., 2013),
sweet orange (NEGREIROS et al., 2014), and kale
(Brassica oleracea) (AZEVEDO et al., 2016),
the estimates obtained by the Anova method were always lower than those obtained by the multivariate
analysis because, according to Cruz et al. (2012), the Anova method does not remove the environmental effect of alternating production in different years,
underestimating the repeatability coefficient. Fruit diameter and skin thickness showed the greatest variations for the repeatability coefficient among the different methods, with repeatability
estimates ranging from 0.002 to 0.57 (ANOVA and PCCV) for diameter and 0.04 to 0.59 (ANOVA
and PCCV) for thickness. However, the lowest repeatability variations were found for titratable acidity and soluble solids, with values ranging from 0.95 to 0.99 (ANOVA and PCCV), which indicates a certain regularity in the repetition of the trait between
the evaluations. Bergo et al. (2013) reported a similar behavior for morphological traits of peach palm, and
pointed to PC as the method that allows the highest coefficient of repeatability, considering as confident
r
ˆ
values above 0.4, but with a greater number of measurements over the growing cycles. Neves et al.(2010) also suggested the use of a greater number
of measurements for passion fruit; however, Manfio
et al. (2011) and Bruna et al. (2012), evaluating the
perennial plants macaw palm and peach, respectively, considered values above 0.6 as high coefficient of
repeatability.
4
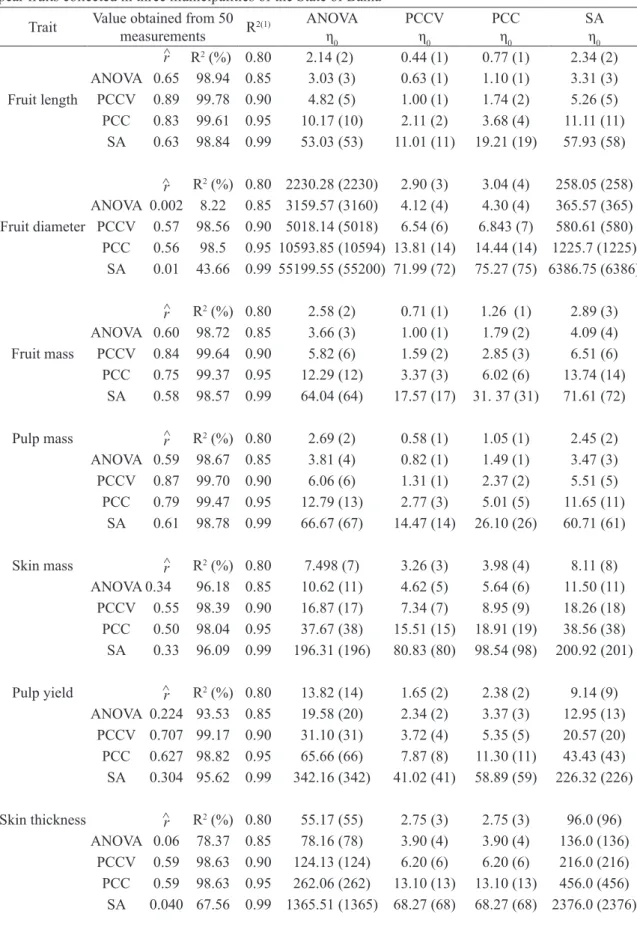
Using the PCCV method, the minimum
number of fruits required to predict the true value of the clone, with 95% determination coefficient for
fruit length (2), fruit diameter (14), fruit mass (3),
pulp mass (3), skin mass (15), pulp yield (8), skin thickness (13), number of seeds (11), firmness (7),
soluble solids (1), titratable acidity (1), soluble solids/
titratable acidity ratio (3), and pH (6) will be 15 fruits, as it was established for the trait skin mass, since
the estimates of the other traits are included in this
value, and fruit quantities over 11 for the traits fruit diameter, skin mass, skin thickness, and number of
seeds are due to their larger effect of the interaction genotype x environment (AZEVEDO et al., 2016).
It is noteworthy that for many traits evaluated, the number of fruits/measurements required is just one fruit, which, according to Cargnin (2016), is due
to high heritability estimates, that is, traits that are
not much influenced by the environment, and because
the genetic material derives from clones.
Chia et al. (2009) argues that, within
acceptable levels of precision, one should reduce the number of evaluations to save time and resources. A
number of studies have considered 80-90% as good
accuracy (CHIA et al., 2009; DANNER et al., 2010; MANFIO et al., 2011; MATSUO et al., 2012).
This study showed that, with a determination coefficient of 90%, it is possible to reduce the number
of evaluations for fruit length (1), fruit diameter (6),
fruit mass (2), pulp mass (1), skin mass (7), pulp yield (4), skin thickness (6), number of seeds (5), firmness
(3), soluble solids (1), titratable acidity (1), soluble solids/titratable acidity ratio (1), and pH (3) to 7
fruits. Thus, evaluations performed on 7 fruits allow
us to obtain accurate estimates for the traits assessed
in this study, with good confidence and reduction in
operational expenses.
TABLE 1 - Analysis of variance for the traits analyzed in cactus pear fruits collected in three municipalities of the State of Bahia.
Trait MS1 MSE Mean CV(%)
Length 39.73 0.42 8.64 7.50
Diameter 0.217ns 0.19 5.81 7.69
Fruit mass 30446.90* 388.92 171.59 11.49
Pulp mass 15029.44* 199.75 91.75 15.40
Skin mass 4244.56* 153.38 75.83 16.33
Pulp yield 1094.84* 70.78 53.64 15.68
Skin thickness 2.95* 0.64 2.00 40.0
N° Seeds 11917.04* 338.96 291.36 6.31
Firmness 3.39* 0.67 27.06 3.02
Soluble solids 645.19* 0.53 11.70 6.27
Titratable acidity 14.49* 0.01 0.50 13.39
AT/SS ratio 36220.62* 171.98 42.97 30.51
pH 11.09* 0.12 5.58 6.36
* mean squared for municipalities evaluated, MSE – mean square of error and CV (%) – coefficient of variation. nsNon significant,
TABLE 2 - Estimation of the coefficients of repeatability (r),determination (R2), and minimum number
of fruits/measurements by the methods of analysis of variance (ANOVA), principal components based on correlation matrix (PCC) (PCCV), and structural analysis based on the correlation matrix (SA) of cactus pear fruits collected in three municipalities of the State of Bahia
Trait Value obtained from 50
measurements R
2(1) ANOVA
η0
PCCV
η0
PCC
η0
SA
η0
Fruit length
r R2 (%)1 0.80 2.14 (2)2 0.44 (1) 0.77 (1) 2.34 (2)
ANOVA 0.65 98.94 0.85 3.03 (3) 0.63 (1) 1.10 (1) 3.31 (3)
PCCV 0.89 99.78 0.90 4.82 (5) 1.00 (1) 1.74 (2) 5.26 (5)
PCC 0.83 99.61 0.95 10.17 (10) 2.11 (2) 3.68 (4) 11.11 (11)
SA 0.63 98.84 0.99 53.03 (53) 11.01 (11) 19.21 (19) 57.93 (58)
Fruit diameter
r R2 (%) 0.80 2230.28 (2230) 2.90 (3) 3.04 (4) 258.05 (258)
ANOVA 0.002 8.22 0.85 3159.57 (3160) 4.12 (4) 4.30 (4) 365.57 (365)
PCCV 0.57 98.56 0.90 5018.14 (5018) 6.54 (6) 6.843 (7) 580.61 (580)
PCC 0.56 98.5 0.95 10593.85 (10594) 13.81 (14) 14.44 (14) 1225.7 (1225) SA 0.01 43.66 0.99 55199.55 (55200) 71.99 (72) 75.27 (75) 6386.75 (6386)
Fruit mass
r R2 (%) 0.80 2.58 (2) 0.71 (1) 1.26 (1) 2.89 (3)
ANOVA 0.60 98.72 0.85 3.66 (3) 1.00 (1) 1.79 (2) 4.09 (4)
PCCV 0.84 99.64 0.90 5.82 (6) 1.59 (2) 2.85 (3) 6.51 (6)
PCC 0.75 99.37 0.95 12.29 (12) 3.37 (3) 6.02 (6) 13.74 (14)
SA 0.58 98.57 0.99 64.04 (64) 17.57 (17) 31. 37 (31) 71.61 (72)
Pulp mass r R2 (%) 0.80 2.69 (2) 0.58 (1) 1.05 (1) 2.45 (2)
ANOVA 0.59 98.67 0.85 3.81 (4) 0.82 (1) 1.49 (1) 3.47 (3)
PCCV 0.87 99.70 0.90 6.06 (6) 1.31 (1) 2.37 (2) 5.51 (5)
PCC 0.79 99.47 0.95 12.79 (13) 2.77 (3) 5.01 (5) 11.65 (11)
SA 0.61 98.78 0.99 66.67 (67) 14.47 (14) 26.10 (26) 60.71 (61)
Skin mass r R2 (%) 0.80 7.498 (7) 3.26 (3) 3.98 (4) 8.11 (8)
ANOVA 0.34 96.18 0.85 10.62 (11) 4.62 (5) 5.64 (6) 11.50 (11)
PCCV 0.55 98.39 0.90 16.87 (17) 7.34 (7) 8.95 (9) 18.26 (18)
PCC 0.50 98.04 0.95 37.67 (38) 15.51 (15) 18.91 (19) 38.56 (38)
SA 0.33 96.09 0.99 196.31 (196) 80.83 (80) 98.54 (98) 200.92 (201)
Pulp yield r R2 (%) 0.80 13.82 (14) 1.65 (2) 2.38 (2) 9.14 (9)
ANOVA 0.224 93.53 0.85 19.58 (20) 2.34 (2) 3.37 (3) 12.95 (13)
PCCV 0.707 99.17 0.90 31.10 (31) 3.72 (4) 5.35 (5) 20.57 (20)
PCC 0.627 98.82 0.95 65.66 (66) 7.87 (8) 11.30 (11) 43.43 (43)
SA 0.304 95.62 0.99 342.16 (342) 41.02 (41) 58.89 (59) 226.32 (226)
Skin thickness r R2 (%) 0.80 55.17 (55) 2.75 (3) 2.75 (3) 96.0 (96)
ANOVA 0.06 78.37 0.85 78.16 (78) 3.90 (4) 3.90 (4) 136.0 (136)
PCCV 0.59 98.63 0.90 124.13 (124) 6.20 (6) 6.20 (6) 216.0 (216)
PCC 0.59 98.63 0.95 262.06 (262) 13.10 (13) 13.10 (13) 456.0 (456)
SA 0.040 67.56 0.99 1365.51 (1365) 68.27 (68) 68.27 (68) 2376.0 (2376) ^
^
^
^
^
^
^
6
Continue...
N° Seeds
r
R2 (%) 0.80 5.855 (6) 2.43 (2) 2.25 (2) 3.77 (4)ANOVA 0.49 97.15 0.85 8.29 (8) 3.44 (3) 3.19 (3) 5.34 (5)
PCCV 0.62 98.79 0.90 13.17 (13) 5.47 (5) 5.07 (5) 8.48 (8)
PCC 0.63 98.88 0.95 27.81 (28) 11.55 (11) 10.72 (11) 17.91 (18)
SA 0.514 98.14 0.99 144.92 (145) 60.22 (60) 55.87 (56) 93.36 (93)
Firmness
r
R2 (%) 0.80 49.36 (49) 1.39 (1) 1.86 (2) 660.94 (661)ANOVA 0.07 80.20 0.85 69.93 (70) 1.97 (2) 2.64 (3) 936.33 (936)
PCCV 0.74 99.30 0.90 111.07 (111) 3.14 (3) 4.20 (4) 1487.11 (1487)
PCC 0.68 99.07 0.95 234.49 (234) 6.63 (7) 8.87 (9) 3139.47 (3139)
SA 0.07 23.23 0.99 1221.83 (1222) 34.56 (34) 46.24 (46) 16358.30
(16358)
Soluble solids
r
R2 (%) 0.80 0.16 (1) 0.08 (1) 0.09 (1) 0.09 (1)ANOVA 0.95 99.91 0.85 0.23 (1) 0.12 (1) 0.12 (1) 0.12 (1)
PCCV 0.97 99.96 0.90 0.37 (1) 0.19 (1) 0.20 (1) 0.20 (1)
PCC 0.97 99.95 0.95 0.79 (1) 0.43 (1) 0.43 (1) 0.43 (1)
SA 0.97 99.95 0.99 4.13 (4) 2.11 (2) 2.24 (2) 2.25 (2)
Titratable
acidity
r
R2 (%) 0.80 0.06 (1) 0.01 (1) 0.01 (1) 0.01 (1)
ANOVA 0.98 99.96 0.85 0.09 (1) 0.01 (1) 0.02 (1) 0.02 (1)
PCCV 0.99 99.99 0.90 0.14 (1) 0.04 (1) 0.03 (1) 0.03 (1)
PCC 0.99 99.99 0.95 0.30 (1) 0.006 (1) 0.06 (1) 0.07 (1)
SA 0.99 99.99 0.99 1.57 (1) 0.33 (1) 0.36 (1) 0.36 (1)
Titratable acidity/ Soluble solids
ratio
r
R2 (%) 0.80 0.95 (1) 0.64 (1) 0.63 (1) 0.66 (1)ANOVA 0.80 99.52 0.85 1.35 (1) 0.91 (1) 0.89 (1) 0.94 (1)
PCCV 0.86 99.67 0.90 1.45 (2) 1.45 (1) 1.42 (1) 1.49 (1)
PCC 0.86 99.68 0.95 4.53 (4) 3.07 (3) 3.01 (3) 3.15 (3)
SA 0.85 99.66 0.99 23.61 (23) 16.00 (16) 15.68 (16) 16.42 (16)
pH
r
R2 (%) 0.80 2.30 (2) 1.21 (1) 1.54 (1) 1.99 (2)ANOVA 0.63 98.85 0.85 3.26 (3) 1.71 (1) 2.18 (2) 2.82 (3)
PCCV 0.76 99.39 0.90 5.19 (5) 2.72 (3) 3.47 (3) 4.48 (4)
PCC 0.72 99.23 0.95 10.95 (11) 5.75 (6) 7.33 (7) 9.47 (9)
SA 0.66 99.01 0.99 57.09 (59) 29.98 (30) 38.23 (38) 49.35 (49)
*Coefficient of determination of the method. 2Number calculated (approximate number).
^
^
^
^
^
CONCLUSIONS
There is significant environmental variability among the three municipalities for the quality traits
evaluated on cactus pear fruits.
The coefficient of repeatability is efficiently
estimated by the principal components method based on the covariance matrix.
Seven fruits are sufficient to evaluate the
physical and physico-chemical traits of cactus pear
with determination coefficient of 90%.
ACKNOWLEDGEMENTS
The authors thank CAPES, CNPq, and FAPEMIG for the financial support.
REFERENCES
AZEVEDO, A.M.; ANDRADE JÚNIOR, V.C.; PEDROSA, C.E.; VALADARES, N.R.; ANDRADE, R.F.; SOUZA, J.R.S. Estudo da repetibilidade
genética em clones de couve. Horticultura Brasileira, Brasília, DF, v.34, n.1, p. 54-58, 2016. (1)
B E R G O , C . L . ; N E G R E I R O S , J . R . d a S . ; MIQUELONI, D.P.; LUNZ, A.M.P. Estimativa
de repetibilidade de caracteres de produção em pupunheiras para palmito da raça Putumayo. Revista Brasileira de Fruticultura, Jaboticabal, v.35, n.3, p.829-836, 2013. (1)
BRUNA, E.D.; MORETO, A.L.; DALBÓ, M.A. Uso
do coeficiente de repetibilidade na seleção de clones
de pessegueiro para o Litoral Sul de Santa Catariana. Revista Brasileira de Fruticultura, Jaboticabal, v.34, n.1, p.206-215, 2012. (1)
CARDOSO, A.I.I. Número mínimo de colheitas em pepino híbrido estimado por meio do coeficiente
de repetibilidade. Bragantia, Campinas, v.65, n.4, p.591-595, 2006. (1)
CARGNIN, A. Repetibilidade e número de colheita de características para seleção de clones de variedades viníferas. Ciência Rural, Santa Maria, v.46, n.2, p.221-226, 2016. (1)
CHIA, G.S.; LOPES, R; da CUNHA, R.N.V; da ROCHA, R.N.C; LOPES, M.T.G. Repetibilidade da
produção de cachos de híbridos interespecíficos entre o caiaué e o dendezeiro. Acta Amazonica, Manaus, v.39, n.2, p.249-254, 2009. (1)
COSTA, J.G. Estimativas de repetibilidade de alguns
caracteres de produção em mangueira. Ciência Rural, Santa Maria, v.33, n.2, p.263-266, 2003. (1)
CRUZ, C.D. Genes – a software package for analusis in experimental statistics and quantitative genetics.
Acta Scientiarum, Maringá, V. 35, n.3, p. 271-276, 2013. (1)
CRUZ, C. D.; REGAZZI, A. J.; CARNEIRO, P. C. S. Modelos biométricos aplicados ao melhoramento genético. 4. ed. Viçosa: UFV, 2012. 514p. (2)
DANNER, M.A.; RASEIRA, M.do C.B.; SASSO, S.A.Z.; CITADIN, I.; SCARIOT, S. Repetibilidade
de caracteres de fruto em araçazeiro e pitangueira.
Ciência Rural, Santa Maria, v.40, n.10, p.2086-2091, 2010. (1)
GALATI, E.M.; MONDELLO, M.R.; GIUFFRIDA, D.; DUGO, G.; MICELI, N.; PERGOLIZZI, S.; TAVIANO, M.F. Chemical characterization and biological effects of sicilian [Opuntia ficus indica (L.) Mill]. Fruit juice: antioxidant and antiulcerogenic activity. Journal of Agricultural and Food Chemistry, Washington, v.51, n.17, p.4903-4908, 2003. (1)
IAL - Instituto Adolfo Lutz. Métodos físico-químicos para análise de alimentos. 4.ed. São Paulo, 2008. 1020 p. (2)
MANFIO, C. E.; MOTOIKE, S.Y.; SANTOS, C. E. M. dos; PIMENTEL, L.D.; QUEIROZ, V. de; SATO,
A.Y. Repetibilidade em características biométricas do fruto de macaúba. Ciência Rural, Santa Maria, v.41, n.1, p.70-76, 2011. (1)
MANICA, I. Frutas nativas, silvestres e exóticas 2: técnicas de produção e mercado. Feijoa,
figo-da-índia, fruta-pão, jaca, lichia, mangaba. Porto Alegre:
Cinco Continentes, 2002. p.141-245. (2)
MATSUO, E.; SEDIYAMA, T.; CRUZ, C.D.; OLIVEIRA, R. de C.T. Análise da repetibilidade em
alguns descritores morfológicos para soja. Ciência Rural, Santa Maria, v.42, n.2, p.189-196, 2012. (1)
NEGREIROS, J. R. da S. A (?) NETO, R. de C.; MIQUELONI, D. P.; LESSA, L. S. Estimativa
de repetibilidade para caracteres de qualidade de
8
NEVES, L. G.; BRUCKNER, C.H.; CRUZ, C.D.;
BARELLI, M. A. A. Avaliação da repetibilidade no melhoramento de famílias de maracujazeiro. Ceres,
Viçosa, v.57, n.4, p.480-485, 2010. (1)
OLIVEIRA, M. do S. P. de; MOURA, E. F.
Repetibilidade e número mínimo de medições para
caracteres de cacho de bacabi (Oenocarpus mapora). Revista Brasileira de Fruticultura, Jaboticabal, v.32, n.4, p.1173-1179, 2010. (1)
PINHEIRO, K.M.; SILVA, T.G.F. da; CARVALHO, H.F.de S.; SANTOS, J.E.O.; MORAIS, J.E.F.de;
ZOLNIER, S.; SANTOS, D.C. dos. Correlações do índice de área do cladódio com características morfogênicas e produtivas da palma forrageira.
Pesquisa Agropecuária Brasileira, Brasília, DF, v.49, n.12, p.939-947, 2014. (1)
YAHIA, E.M.; JACOBO, C.M. Nutritional components and anti-oxidant Capacity of ten cultivars and lines of cactus pear fruit (Opuntia spp.). Food Research International, Campinas, v. 44, n.7, p. 2311-2318, 2011. (1)
ZHONG, X.K., JIN, X., LAI, F.Y., LIN, Q.S., JIANG, J.G. Chemical analysis and antioxidant activities in vitro of polysaccharide extracted from (Opuntia ficus