Luís Manuel Vasquez Vieira
Towards a Decision Support System for
Flood Management in a River Basin
Luís Manuel V asq uez V ieir a October 2013 UMinho | 2013 To w ar ds a Decision Suppor t Sys tem f or Flood Manag ement in a Riv er Basin
Escola de Engenharia
October 2013
MSc Thesis
Integrated Master in Civil Engineering
Supervised by:
Professor Doutor José Luís da Silva Pinho
Luís Manuel Vasquez Vieira
Towards a Decision Support System for
Flood Management in a River Basin
Escola de Engenharia
Luís Vieira iii
ACKNOWLEDGMENTS
To Professor José Luís da Silva Pinho, for his guidance throughout this work. Thanks for his immeasurable support, constant availability, sharing of knowledge and stimulation transmitted during the preparation of this dissertation. His advising support was absolutely crucial to the good end of this work.
To my friends for the love and motivation they gave me and for the always belief that it was possible to get here.
To my family for the unsurpassed support given towards the completion of my goals, for the patience in the hard moments and for the stable structure provided during my entire life.
iv Luís Vieira (Page intentionally left blank)
Luís Vieira v
TOWARDS
A
DECISION
SUPPORT
SYSTEM
FOR
FLOOD
MANAGEMENT IN A RIVER BASIN
ABSTRACT
The world is experiencing a countless number of impressive and devastating floods causing a range of health impacts and risks with hundreds of thousands of people losing their lives or becoming homeless in a matter of hours. These hydrological extremes are of growing concern for global, regional and national authorities due to the human tragedy and the associated socio-economic losses. EU Floods Directive requires the developing of flood hazard maps, which may include information on hydrological and hydrodynamics characteristics of vulnerable regions, i.e. inundated areas, river flow discharges and water levels. Prediction of flood events can accurately be achieved by applying mathematical modelling for describing rainfall-runoff phenomena as well as surface waters hydrodynamics.
In this work a platform for flood forecasting, FEWS-LIMA, implemented with Delft-FEWS software, was successfully applied in the case study of the Portuguese river Lima basin. This platform integrates SOBEK Sacramento hydrological model, SOBEK rivers hydrodynamic models that work together in predicting river hydrodynamics behaviour, and a comprehensive hydrological database. The calibration of these models was achieved using historical river flow discharges and water levels data in different rainfall events and considering the existence and inexistence effect of upstream river dams operation. Models predictions use rainfall time series as input data obtained from meteorological forecasting services, based on atmospheric models.
The performance of FEWS-LIMA platform created for the river Lima basin was verified in real rainfall events, using a backcasting approach to 4 flood events occurred in specific weeks in the years 2006, 2010, and 2011 in order to demonstrate the accuracy of the modelled processes. In addition, a forecasting event was also considered in order to show the applicability of this methodology in future situations.
It was verified, in this case study, that the obtained results have a high correlation to the actually measured typical flood hydraulic parameters (river flow discharges and water levels).
vi Luís Vieira (Page intentionally left blank)
Luís Vieira vii
RUMO A UM SISTEMA DE SUPORTE À DECISÃO PARA A GESTÃO DE
CHEIAS NUMA BACIA HIDROGRÁFICA
RESUMO
Nas últimas décadas tem-se registado um número crescente e impressionante de inundações devastadoras com centenas de milhares de vítimas mortais ou desalojados numa questão de poucas horas. Estes fenómenos hidrológicos extremos são motivo de crescente preocupação para as autoridades globais, regionais e nacionais, devido às tragédias humanas e aos prejuízos socioeconómicos que lhe estão associados. A Directiva da UE sobre cheias estabelece a obrigatoriedade de elaboração de cartas de zonas inundáveis, que devem conter informação sobre características hidrológicas e hidrodinâmicas de regiões vulneráveis (áreas inundadas, níveis de água e caudais). A previsão de cheias pode ser realizada com precisão com o auxílio da aplicação de modelos matemáticos que tentam descrever os fenómenos precipitação-escoamento, bem como a dinâmica dos meios hídricos naturais.
Neste trabalho foi criada uma plataforma de previsão de cheias (FEWS-LIMA, implementada no software Delft-FEWS) a qual foi aplicada, com sucesso, ao caso de estudo da bacia do rio Lima. Esta plataforma integra ferramentas de modelação de hidrologia e hidrodinâmica (SOBEK) que, em conjunto, prevêem o comportamento hidrodinâmico do sistema fluvial. A calibração destes modelos foi conseguida utilizando dados históricos de caudais e níveis de água em diferentes eventos de precipitação e considerando a existência ou não do efeito da operação das barragens a montante. Os modelos utilizaram, como dados de entrada, séries temporais de precipitação obtidas a partir de serviços de previsão meteorológica baseados em modelos atmosféricos.
O desempenho da plataforma FEWS-LIMA foi verificado em eventos reais de precipitação, aplicando-se uma abordagem de “backcasting” em quatro eventos de cheia ocorridos em 2006, 2010 e 2011 por forma a demonstrar a precisão dos processos modelados. Para demonstrar a aplicabilidade desta metodologia em futuras situações considerou-se, ainda, um cenário de previsão. Foi verificado, neste estudo, que os resultados obtidos demonstram uma elevada correlação com os parâmetros hidráulicos medidos (caudais e níveis de água).
Palavras-chave: sistema de suporte à decisão, previsão de cheias, hidrodinâmica, hidrologia, modelação
viii Luís Vieira (Page intentionally left blank)
ix Luís Vieira
TABLE OF CONTENTS
ACKNOWLEDGMENTS ... iii
ABSTRACT ... v
LIST OF FIGURES ... xiii
LIST OF TABLES ... xvii
ACRONYMS ... xix
CHAPTER 1 INTRODUCTION ... 1
1.1 Motivation and scope... 1
1.2 Objectives ... 5
1.3 Methodology ... 6
1.4 Organization of the dissertation ... 7
CHAPTER 2 STATE OF THE ART ... 11
2.1 Overview ... 11
2.2 Hydroinformatics. ... 12
2.2.1 Modelling and simulation ... 13
2.2.2 Modeling software – A review ... 14
2.2.2.1 POM (Princeton Ocean Model) ... 14
2.2.2.2 DELFT3D ... 15 2.2.2.3 TELEMAC ... 17 2.2.2.4 MOHID ... 18 2.2.2.5 RMA2 ... 19 2.2.2.6 MIKE 21 ... 20 2.2.2.7 SOBEK ... 21 2.2.2.8 FlowMaster (Bentley) ... 24
2.2.3 Open versus closed source software ... 25
2.2.4 Hydroinformatics tools for flood forecasting ... 27
2.2.4.1 Delft-FEWS ... 27
2.3 Hydrologic modelling ... 29
2.3.1 Hydrologic cycle and surface runoff ... 29
2.3.2 Sacramento hydrologic model: parameters, variables and schematization ... 31
2.4 Decision Support Systems ... 37
CHAPTER 3 CASE STUDY ... 41
3.1 Study area. River Lima basin ... 41
x Luís Vieira
3.1.2 Ponte de Lima ... 43
3.1.3 Ponte da Barca ... 44
3.1.4 Alto Lindoso dam ... 45
3.1.5 Touvedo dam ... 46
3.2 Historical flood events at Ponte de Lima ... 47
3.3 Geographical Information System and data collection ... 49
3.4 Data collection ... 50
3.4.1 Meteorological stations ... 51
3.4.1.1 Active Stations ... 51
3.4.1.2 Inactive Stations ... 54
3.4.2 Hydrometric stations ... 57
3.4.2.1 Active hydrometric stations ... 57
3.4.2.1.1 Inactive Hydrometric Stations ... 60
CHAPTER 4 MODELLING CONSTRUCTION, CALIBRATION AND VALIDATION 65 4.1 Hydrodynamic model (SOBEK) ... 65
4.1.1 Model construction ... 65
4.1.2 Model calibration ... 68
4.2 Hydrologic model (SOBEK) ... 69
4.2.1 Model Construction ... 69
4.2.1.1 Sacramento Nodes ... 70
4.2.1.2 Meteorological stations ... 72
4.2.2 Model calibration ... 74
4.2.2.1 Calibration step one ... 76
4.2.3 Calibration step two ... 84
4.2.4 Model validation ... 89
CHAPTER 5 FEWS-LIMA PLATFORM ... 93
5.1 Flood forecasting ... 93 5.2 FEWS-LIMA ... 94 5.2.1 Introduction ... 94 5.2.2 Platform conception ... 95 5.2.3 User interface ... 96 5.2.4 Workflows ... 98
5.2.4.1 Historical data insertion ... 98
Luís Vieira xi
5.2.4.3 SOBEK adapter ... 103
5.2.4.4 Import results ... 106
5.2.4.5 Scheduled run ... 106
CHAPTER 6 RESULTS AND DISCUSSION ... 111
6.1 Rainfall events ... 111
6.2 Results for river flow rates in Ponte da Barca ... 112
6.2.1 Backcasting rainfall events ... 113
6.2.2 Forecasting rainfall events ... 117
6.2.3 Discussion ... 117
6.3 Results for river water levels in Ponte de Lima ... 118
6.3.1 Backcasting rainfall events ... 118
6.3.2 Forecasting rainfall events ... 121
6.3.3 Discussion ... 122
CHAPTER 7 CONCLUSIONS AND FUTURE WORK ... 125
7.1 Conclusions ... 125
7.2 Future work ... 126
CHAPTER 8 REFERENCES ... 129 APPENDIX I – SACRAMENTO VBA MODEL CODE ... A-1 APPENDIX II – BATCH DEGRIB CODE ... A-7 APPENDIX III – UPDATE_BUI.EXE CODE ... A-9
xii Luís Vieira (Page intentionally left blank)
Luís Vieira xiii
LIST OF FIGURES
Figure 1.1 - The core concepts of SREX (adapted from IPCC, 2012). ... 3
Figure 1.2 - Disaster management cycle: a frame for flood risk management (Deltares, 2010). ... 5
Figure 1.3 - Methodology flow chart... 7
Figure 2.1 - Hydrologic Cycle (NOAA, 2013). ... 30
Figure 2.2 - Conceptualization of the rainfall-runoff process in a segment (CHRS, 2013). ... 32
Figure 2.3 –Schematization of SAC-SMA rainfall-runoff process (Riverside, 2013). ... 34
Figure 2.4 - General structure of a DSS (Vieira & Pinho, 2002). ... 38
Figure 3.1 – Study location area. ... 42
Figure 3.2 - River Lima's mouth located at Viana do Castelo. ... 43
Figure 3.3 – Flood prone historical centre of Ponte de Lima. ... 43
Figure 3.4 - Overview of Ponte de Lima town near the river Lima banks. ... 44
Figure 3.5 – Flood prone Ponte da Barca town aerial view. ... 44
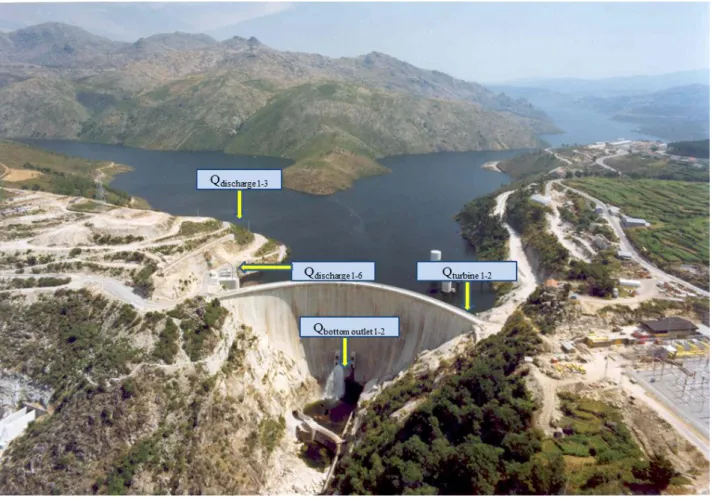
Figure 3.6 - Alto Lindoso dam and its reservoir. ... 45
Figure 3.7 – Touvedo dam and its reservoir. ... 46
Figure 3.8 – Picture of Ponte de Lima flood event in 1866. ... 47
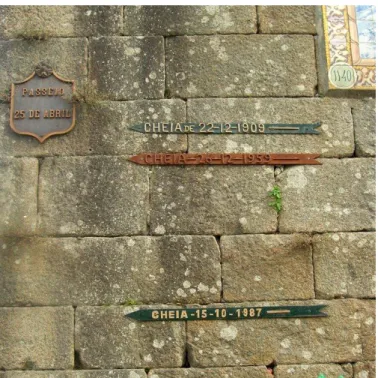
Figure 3.9 - Historical Floods information at St. Paul's tower. ... 48
Figure 3.10 – Picture of Ponte de Lima flood event in 1987. ... 48
Figure 3.11 – Pictures of flood event in December 2012. ... 49
Figure 3.12 - River Lima Sub-basins. ... 49
Figure 3.13 - River Lima monitoring stations. ... 50
Figure 3.14 - River Lima active meteorological stations. ... 52
Figure 3.15 – Rainfall data series (2002 – 2012) registered in active meteorological stations. ... 52
Figure 3.16 - River Lima inactive meteorological stations. ... 55
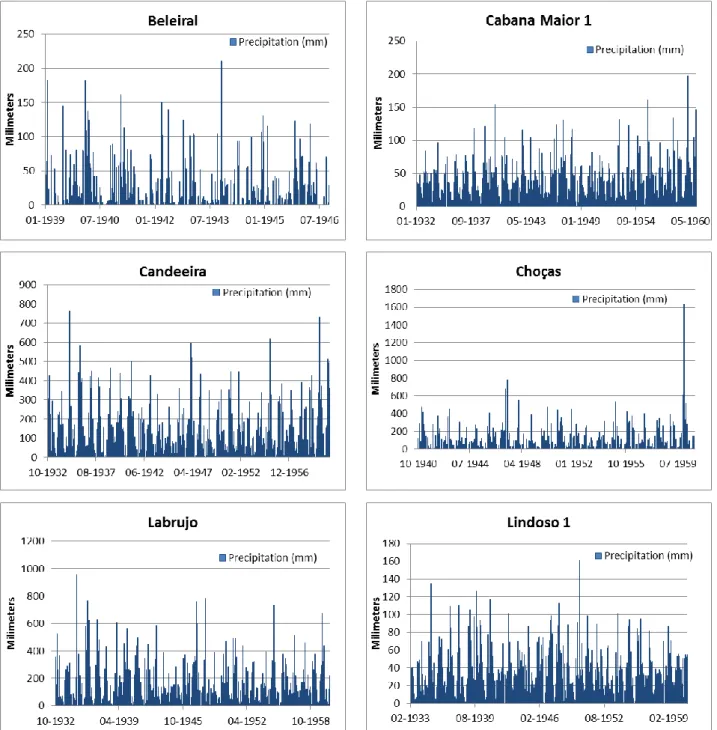
Figure 3.17 - Rainfall data series (1932 – 1960) registered in inactive meteorological stations (continued). 57 Figure 3.18 - Active Hydrometric Stations. ... 58
Figure 3.19 – Water level data at Ponte da Barca... 58
Figure 3.20 – Discharges at Ponte da Barca. ... 58
Figure 3.21. - Water level data at Ponte de Lima 2. ... 59
Figure 3.22 - Alto Lindoso flow rate and water level data. ... 59
Figure 3.23 - Touvedo flow rate and water level data. ... 60
Figure 3.24 - Inactive Hydrometric Stations. ... 60
Figure 3.25 - Available flow rate data at Pontilhão de Celeiros. ... 61
Figure 3.26 - Available flow rate data at Ponte de Lima 1. ... 61
Figure 4.1 - SOBEK hydrodynamic model. ... 66
xiv Luís Vieira
Figure 4.3 - Bridges modeling in SOBEK environment... 67
Figure 4.4 – Alto Lindoso dam SOBEK model ... 67
Figure 4.5 – Touvedo dam SOBEK model. ... 67
Figure 4.6 - Calibration scenario results at Ponte da Barca. ... 68
Figure 4.7 - Calibration scenario results at Ponte de Lima. ... 69
Figure 4.8. - Flow diagram of modules simulation mode... 69
Figure 4.9 - River Lima sub-basin centroids. ... 70
Figure 4.10 - Sacramento nodes insertion in SOBEK.. ... 71
Figure 4.11 - Sacramento nodes linkage. ... 71
Figure 4.12 - Hydrological model layout. ... 71
Figure 4.13 - Thiessen for inactive Meteo Stations. ... 72
Figure 4.14 - Thiessen for active Meteo Stations. ... 72
Figure 4.15 – “.bui” file layout. ... 73
Figure 4.16 - SOBEK “.bui file” presentation. ... 73
Figure 4.17 - SACRMNTO.3B layout. ... 74
Figure 4.18 - Sacramento node information in SOBEK interface. ... 74
Figure 4.19 - Case study calibration panorama. ... 76
Figure 4.20 – Step one Sacramento calibration strategy. ... 77
Figure 4.21 - Principle of computation of lower zone recession coefficient (Deltares, 2013). ... 78
Figure 4.22 – LZPK, LZFPM, LZSK and LZFSM estimation parameters. ... 79
Figure 4.23 - PCTIM parameter estimation. ... 79
Figure 4.24 - UZK values as a function of N. ... 80
Figure 4.25 - SAC-SMA VBA model. ... 82
Figure 4.26 - River Vez’s contributing sub-basins calibration results. ... 82
Figure 4.27 – River Lima’s contributing sub-basins calibration results. ... 84
Figure 4.28 – Step two Sacramento calibration strategy. ... 85
Figure 4.29 - Alto Lindoso turbinated flow rate calibration and its correlation coefficient. ... 85
Figure 4.30 - Alto Lindoso effluent flow rate calibration and its correlation coefficient. ... 86
Figure 4.31 - Alto Lindoso reservoir’s water level calibration and its correlation coefficient. ... 86
Figure 4.32 - Touvedo turbinated flow rate calibration and its correlation coefficient. ... 87
Figure 4.33 - Touvedo effluent flow rate calibration and its correlation coefficient. ... 87
Figure 4.34 - Touvedo reservoir’s water level calibration and its correlation coefficient. ... 87
Figure 4.35- Sub-basins comprehended between dams calibration results. ... 88
Figure 4.36 – The simulated and measured flow rates at Ponte da Barca. ... 90
Figure 4.37 – The simulated and measured water levels at Ponte de Lima’s weir ... 90
Figure 5.1 - Warning system timeline. ... 93
Luís Vieira xv
Figure 5.3 - FEWS-LIMA conceptualization. ... 95
Figure 5.4 – “LocationSets.xml” configuration file (excerpt). ... 97
Figure 5.5 - FEWS-LIMA end user layout. ... 98
Figure 5.6 – “.xml file” with historical data (excerpt). ... 99
Figure 5.7 – FEWS-LIMA Time Series display. ... 100
Figure 5.8 - ImportTelemetry module (excerpt). ... 100
Figure 5.10 - FEWS-LIMA UGrib forecast layout. ... 101
Figure 5.11 – Precipitation forecast in FEWS-LIMA display grid. ... 102
Figure 5.12- Batch Degrib and Update_BUI.exe codes (excerpts). ... 102
Figure 5.13 – “SobekAdvancedBatch.xsd” general view. ... 104
Figure 5.14 - Pre-processing workflow user interface. ... 105
Figure 5.15 - Forecast workflow user interface. ... 105
Figure 5.16 – FEWS-LIMA running SOBEK model. ... 106
Figure 5.17 – Scheduled run workflow start. ... 107
Figure 5.18 – FEWS-LIMA workflows layout... 107
Figure 6.1 – Time series (2003 – 2011) of flow rate measured at Ponte da Barca town. ... 111
Figure 6.2 – Scenario BC1. River discharge at Ponte da Barca. ... 113
Figure 6.3 - Scenario BC1. Correlation coefficient. ... 113
Figure 6.4 - Scenario BC2. River discharge at Ponte da Barca. ... 114
Figure 6.5 - Scenario BC2. Correlation coefficient. ... 114
Figure 6.6 - Scenario BC3. River discharge at Ponte da Barca. ... 115
Figure 6.7 - Scenario BC3. Correlation coefficient. ... 115
Figure 6.8 - Scenario BC4. River discharge at Ponte da Barca. ... 116
Figure 6.9 - Scenario BC4. Correlation coefficient. ... 116
Figure 6.10 - Scenario FC. River discharge at Ponte da Barca. ... 117
Figure 6.11 - Scenario BC1. River water level at Ponte de Lima. ... 118
Figure 6.12 - Scenario BC1. Correlation coefficient. ... 119
Figure 6.13 - Scenario BC2. River water level at Ponte de Lima. ... 119
Figure 6.14 - Scenario BC3. River water level at Ponte de Lima. ... 120
Figure 6.15 - Scenario BC4. River water level at Ponte de Lima. ... 120
Figure 6.16 - Scenario BC4. Correlation coefficient. ... 121
xvi Luís Vieira (Page intentionally left blank)
Luís Vieira xvii
LIST OF TABLES
Table 2.1 - SAC-SMA parameters and their feasible ranges (Anderson et al., 2006). ... 33
Table 2.2 –SAC-SMA State variables (Anderson et al., 2006). ... 33
Table 3.1 - Alto Lindoso hydraulics characteristics. ... 46
Table 3.2 – Touvedo hydraulics characteristics. ... 47
Table 3.3 - Available input data for the active meteorological stations. ... 51
Table 3.4 - Available input data for the inactive meteorological stations. ... 55
Table 4.1 - SAC-SMA parameter estimation via hydrograph analysis. ... 81
Table 4.2 - Calibrated parameters for river Vez’s contributing sub-basins. ... 83
Table 4.3 – Calibrated parameters for river Lima’s contributing sub-basins. ... 84
Table 4.4 - Calibrated parameters for the existing sub-basins in between dams. ... 89
xviii Luís Vieira (Page intentionally left blank)
Luís Vieira xix
ACRONYMS
1DFLOW One dimensional flow model
ADIMC Tension water contents of the ADIMP area (mm)
ADIMP Maximum fraction of an additional impervious area due to saturation DSS Decision Support System
EU European Union
FEWS Flood Early Warning System GIS Geographic Information System GFS Global Forecast System
GUI Graphical User Interface
IPCC Intergovernmental Panel on Climate Change IT Information Technology
LZFPC Lower zone free primary contents (mm) LZFSC Lower zone free supplemental contents (mm) LZFPM The lower layer primary free water capacity (mm) LZFSM The lower layer supplemental free water capacity (mm)
LZPK Depletion rate of the lower layer primary free water storage (day-1) LZSK Depletion rate of the lower layer supplemental free water storage, day-1) LZTWC Lower zone tension water contents (mm)
LZTWM The lower layer tension water capacity (mm) NOAA National Oceanic and Atmospheric Administration NWSRFS National Weather Service River Forecast System PCTIM Permanent impervious area fraction
PFREE Percolation fraction that goes directly to the lower layer free water storages PI Published Interface
REXP Shape parameter of the percolation curve RIVA Riparian vegetarian area fraction
RR Rainfall Runoff
RSERV Fraction of lower layer free water not transferable to lower layer tension water SAC-SMA Sacramento Soil Moisture Accounting model
SIDE Ratio of deep percolation from lower layer free water storages SNIRH Portuguese National Information System for Water Resources
SREX Special Report on Managing the Risks of Extreme Events and Disasters SSURGO Soil Survey Geographic database
UZFWC Upper zone free water contents (mm) UZFWM The upper layer free water capacity (mm)
UZK Interflow depletion rate from the upper layer free water storage (day-1) UZTWC Upper zone tension water contents (mm)
UZTWM The upper layer tension water capacity (mm) VBA Visual Basic for Applications
XML Extensible Markup Language XSD XML Schema Definition
xx Luís Vieira (Page intentionally left blank)
CHAPTER 1
Introduction
"When it is not in our power to determine what is true, we ought to act according to what is most probable."
Luís Vieira 1
CHAPTER 1
INTRODUCTION
1.1 Motivation and scope
Hydrological extreme (floods and droughts) and related geo-hazards (storms, forest fires, landslides and earthquakes) are of growing concern for global, regional and national authorities, since they cause heavy human tragedy and socio-economic losses. A significant proportion of these losses is caused by floods. Over the last decades, the world has experienced an increasing number of impressive and devastating floods, with hundreds of thousands of people losing their lives or becoming homeless in a matter of hours, abundantly reported by the media throughout all the continents: China (1931, 1939, 1980, 1998 and 2008), Philippines (2009), India (1978 and 2013), Pakistan (2007), Iran (1993), United States of America (1972, 1972 and 2005), Argentina (1958 and 2013), Brazil (1966, 1967, 1970, 1988, 2004 and 2010), African nations floods (Sudan, Nigeria, Burkina Faso, Ghana, Kenya, Ethiopia, Somalia, Mozambique) in 2006, 2007 and 2013. Severe fluvial floods, some of them with a trans-national dimension have taken place in Europe, such as the Rhine-Meuse floods in 1993 and 1995, the Oder floods in 1997, the Po floods in 1994 and 2000, the Elbe and Danube floods in 2002, the UK floods in 2007, and the Seine Floods in 2013 were considered as catastrophic natural disasters (De Roo et al., 2009).
According to EM-DAT (EM-DAT, 2013), floods comprised 43% of all disaster events for the period 1998–2002. During this period, Europe suffered about 100 major damaging floods. The European Environmental Agency estimated that floods in Europe between 1998 and 2002 caused about 700 deaths, the displacement of about half a million people and at least 25 billion euros in insured economic losses (EEA, 2003).
The environmental impact of floods occurring in large rivers includes: the clogging up of water treatment plants (potentially leading to the release of large quantities of contaminants); damage to vegetation, in some cases due to the duration of residence of water in the soil, and the mobilisation of contaminants present in the soil.
Flash floods can cause widespread destruction, although usually in relatively small areas and environmental damage, especially soil erosion, both on their own and in association with other natural events such as landslides. Fairly common in the Mediterranean and mountain areas, flash floods are a particular danger to people since, as their name suggests, they happen suddenly and with little warning. Diffuse flooding can also have environmental impacts, facilitating for instance the infiltration of polluted runoff into the local aquifers. Flooding caused by storms mainly affects
2 Luís Vieira
coastal areas and, by erosion, related ecosystems. It may coincide with high waters in river estuaries (EEA, 2003).
Floods have been the most deadly natural disasters in Portugal during the last century, followed by earthquakes (Ramos & Reis, 2002). Large river floods are caused by heavy rains associated with a westerly zonal circulation that may persist for weeks. The system of dams within the river basin reduces the frequency of flooding, but cannot fully control the river flows. Nevertheless, these floods are not a danger for the human population. In contrast, flash floods are more dangerous and fatal than these large river floods, as demonstrated in 1967 and 1997. They affect the small drainage basins and are caused by heavy and concentrated rainfall, active in the south of the country, in the Lisbon region, Alentejo and Algarve. Deforestation, soil impermeability, chaotic urbanization, building on floodplains, the blockage of small creeks or their canalisation, and the building of walls and transverse embankments along the small creeks all contribute to the aggravation of this kind of flood.
Climate change may cause a further increase in the flood hazard probability and magnitude, whilst it is certain that demographic and economic development is causing a continuous increase in the vulnerability of many floodplain and coastal areas. The Intergovernmental Panel on Climate Change (IPCC) presents a scientific literature based assessment on issues that range from the relationship between climate change and extreme weather and climate events to the implications of these events for society and sustainable development. From the “Special Report on Managing the Risks of Extreme Events and Disasters to Advance Climate Change Adaptation” (SREX), (IPCC, 2013), the assessment concerns the interaction of climatic, environmental, and human factors that can lead to impacts and disasters, options for managing the risks posed by impacts and disasters, and the important role that non-climatic factors play in determining impacts. Figure 1.1 illustrates the core concepts of SREX. The report assesses how exposure and vulnerability to weather and climate events determine impacts and the likelihood of disasters (disaster risk). It evaluates the influence of natural climate variability and anthropogenic climate change on climate extremes and other weather and climate events that can contribute to disasters, as well as the exposure and vulnerability of human society and natural ecosystems. It also considers the role of development in trends in exposure and vulnerability, implications for disaster risk, and interactions between disasters and development.
Luís Vieira 3
Figure 1.1 - The core concepts of SREX (adapted from IPCC, 2012).
The report examines how disaster risk management and adaptation to climate change can reduce exposure and vulnerability to weather and climate events and thus reduce disaster risk, as well as increase resilience to the risks that cannot be eliminated (IPCC, 2012). They concluded that considerable uncertainty remains in the projections of flood changes, especially regarding their magnitude and frequency. There is low confidence (due to limited evidence) in future changes in flood magnitude and frequency derived from river discharge simulations. Projected precipitation and temperature changes imply possible changes in floods, although overall there is low confidence in projections of changes in fluvial floods due to limited evidence and because the causes of regional changes are complex.
The repetitive occurrence of such disastrous floods prompted the investigation of new strategies for flood prevention and protection, with focus on coordinated actions among countries sharing the same river basin. Moreover disaster management for urban areas is a growing priority since anthropomorphic factors such as unplanned urbanization and climate change have amplified the flood disaster risks (Price & Vojinovic, 2008).
Although substantial amounts of money were invested in flood protection and flood mitigation during the past decades the reported damages increased tremendously and continuously. One of the main causes is the change in land use in former flood plains from agricultural utilization to industrial and residential areas (Kenyon et al., 2008; Neuhold & Nachtnebel, 2008).
4 Luís Vieira
Flood risk assessment methodologies, using recently developed urban flood models have been applied to estimate likelihood and consequences of flooding effect in highly urbanized areas (Leitão et al., 2013).
During the past centuries, traditional approaches on flood management include structural flood protection measures (river training and restoration), early warning systems and evacuation planning, with the main objective of protecting people from the caprices of nature. The directive 2007/60/EC on the assessment and management of flood risks (EU, 2007) emphasises:
i. Floods have the potential to cause fatalities, displacement of people and damage to the environment, to severely compromise economic development and to undermine the economic activities of the community.
ii. Floods are natural phenomena which cannot be prevented. However, some human activities (such as increasing human settlements and economic assets in floodplains and the reduction of the natural water retention by land use) and climate change contribute to an increase in the likelihood and adverse impacts of flood events.
iii. It is feasible and desirable to reduce the risk of adverse consequences, especially for human health and life, the environment, cultural heritage, economic activity and infrastructure associated with floods. However, measures to reduce these risks should, as far as possible, be coordinated throughout a river basin if they are to be effective.
The main message of this directive is that disaster management should broaden its scope through the integration of disaster risk considerations into sustainable development policies, planning and programmes at all levels, with special emphasis on disaster prevention, mitigation, preparedness and vulnerability reduction.
Figure 1.2 depicts the disaster management cycle which is a widely used frame for flood risk management (Deltares, 2010). It distinguishes three distinct phases in flood risk management: prevention, flood event management and postflood measures. It clearly shows that flood risk management encompasses a wide range of activities and measures, ranging from the traditional flood defence measures, such as dikes and dams, to spatial planning, early warning, evacuation and reconstruction. This reflects the increasing awareness that solutions should be sought in a combination of measures to protect against flooding and to reduce vulnerability.
Luís Vieira 5
Figure 1.2 - Disaster management cycle: a frame for flood risk management (Deltares, 2010).
When preventive measures are not sufficient, flood damage can still be reduced through raised preparedness. Operational flood forecasting systems form a key part of preparedness strategies for flood events by providing early warnings several days ahead, giving flood forecasting services, civil protection authorities and the public adequate preparation time and thus reducing the impacts of the flooding. Many flood forecasting systems rely on precipitation inputs, which come initially from observation networks (rain gauges) and radar (Cloke & Pappenberger, 2009).
Real time flood forecasting is a very challenging issue because it serves as a sound decision support basis for authorities and people affected by these natural events. Hydrologic and river hydrodynamics models are essential elements of fluvial flood forecast systems.
This research work gives an overview of current available options for flood modelling in river basins, from hydrological and hydrodynamic calculations with a one-dimensional river model to detailed flood process representation with one dimensional–two dimensional hydrodynamic coupled models. A specific modelling solution is described and applied in a case study regarding flood forecasting analysis for a set of pre-simulated scenarios and real-time simulations.
1.2 Objectives
This research work has as main goal to contribute to development of a hydroinformatics advanced decision support tool for the operational management of floods in a river basin. This IT platform will serve as an early warning system and a means of preparedness for flood events.
6 Luís Vieira
Set up of hydrological models for a river basin based in Sacramento approach;
Use of the implemented model combined with a hydrodynamic model in different planning scenarios;
Integration of the calibrated and validated hydrological and hydrodynamic models in a flood early warning system platform;
Identification of key variables for flood events within the river basin;
Integration of a real time meteorological forecasting data in the developed system;
Flood forecasting based on river hydrodynamics considering the tidal water level as downstream boundary conditions and the river discharges at the upstream boundary;
Application of the implemented tools to different flood scenarios at river Lima basin to assess different flood management strategies;
1.3 Methodology
The aforementioned objectives have been devised for the construction of a decision support system (DSS) usable for flood management in a river basin scale. This justified the adoption of the case study approach that was applied in the Portuguese river Lima basin.
A wide spectrum of databases and model bases was applied in setting the decision support system. The main source for data collection (rainfall, water levels and flow rates in rivers and reservoirs) was the Portuguese National Information System for Water Resources (SNIRH). Bathymetry survey information was obtained from previous research works developed at University of Minho (Ferreira, 2010).
The river basin hydrology was studied by means of Sacramento theoretical approach implemented with GIS support, and the river hydrodynamics was simulated using SOBEK software. Models calibration and validation were performed using historical data series of rainfall, river flow discharges and water levels, reservoirs water levels, measured from 1932 to 2012.
This set of hydroinformatic tools was integrated in Delft-FEWS platform to construct the DSS. Modelling and simulation were performed in the river Lima basin case study. Flood forecasting results (river discharges and water levels) were obtained for different rainfall event scenarios. The flow chart of the adopted methodology is shown in Figure 1.3.
Luís Vieira 7
Figure 1.3 - Methodology flow chart.
1.4 Organization of the dissertation
The outline of this dissertation is as follows.Chapter 1 describes generically the motivation and scope of the present research work. It also highlights the main objectives and the methodology adopted throughout the dissertation. This is followed by the structure of the manuscript.
Chapter 2 gives a general view of climate changes aspects and their consequences to flood events and discusses capabilities and limitations of different hydroinformatics tools that can be used in hydrologic and hydrodynamic modelling in river and coastal environments. Conceptual hydrologic approach and decision support systems for flood management are also described.
Delft FEWS Platform
Model construction & calibration
INPUT DATA – Weather parameters – Soil characteristics – Land use – GIS RAINFALL-RUNOFF Sacramento HYDRODYNAMICS INPUT DATA – Hydraulic structures – Reservoirs – River flows – Water levels SOBEK
DSS for flood management
RAINFALL EVENTS SCENARIOS – Backcasting events – Forecasting events OUTPUT – River discharges – Water levels CASE STUDY
8 Luís Vieira
In Chapter 3 a general description of the study area (river Lima basin) is presented where the main interesting issues for modelling are highlighted including the location of meteorological and hydrometric monitoring stations. This chapter also includes the observed data on rainfall, river flow rates and water levels that served as basis for models implementation.
Chapter 4 describes the modelling tools developed and applied in the present work including their theoretical background, numerical details and implementation information. Calibration and validation of models are also included in this chapter.
In Chapter 5 the main assumptions for the development of FEWS-LIMA decision support system are exposed. This chapter presents the platform conception, the configuration of the system and the processes implemented in forecasting flood events.
Chapter 6 describes the application of FEWS-LIMA to the study site, and presents the results obtained and their discussion.
Chapter 7 presents the general conclusion for this work.
CHAPTER 2
Hydroinformatics tools. State of the Art
“I know that I know nothing”
Luís Vieira 11
CHAPTER 2
STATE OF THE ART
2.1 Overview
The growing world water crisis is in part a failure of human society to be aware of the problem and its possible solutions. This crisis is perceived in different ways. For some it is the conflict between different uses, such as drinking water supply, hydropower generation, and ecological concerns. For others it is learning how to deal with the problems of climate change, whether leading to drought and desertification or more frequent and severe flooding in urban, fluvial and coastal environments. On the other hand the problems of increasingly polluted water resources due to point or diffuse sources from industry and urban wastewater discharges sources seem to be out of control and solutions in many cases are no longer simple to generate or implement.
Integrated water management involves an holistic view of a number of distinct systems which requires a wide range of information, namely scientific and technical information (covering physical, chemical, biological and socio-economic data for the natural system under study), management information (related with the available financial and human resources and planning activities), and public information (integrating a range of stakeholders who have direct interest in the water management process). Processing all this information takes the form of a high dimensional problem, which depends on the availability of efficient means to process required data as well as computational tools for simulation modelling in order to understand the behaviour of complex natural systems and to enable solving problems.
Our ability to model and analyse complex water-based systems is due almost entirely to the development of digital technologies. These have revolutionized the way in which we can reproduce the behaviour of such systems, especially in using graphics to analyse and present data, to track the building of models and to visualize output in ways that replicate images of the real world (Price and Solomatine, 2009). Nevertheless, one must be aware that the results obtained from models (based on well-defined and structured mathematical formulations) are in contradiction with the water-based systems that by definition are non-structured and badly defined.
Simulation models, optimization models, decision support models, databases, expert systems, geographic information systems (GIS), and information and communication technology have been extensively used in solving problems of hydraulics, hydrology and environmental engineering for better management of water-based systems. The coherent integration of these tools provides the
12 Luís Vieira
computer based decision support systems that now enter increasingly into the offices of engineers, water authorities and government agencies (Vieira et al., 2012).
2.2 Hydroinformatics
The emergence of hydroinformatics can be traced back to developments in computational hydraulics. Abbott (1991), the inventor of the neologism at that time, has defined it as the integration of computational hydraulics and of artificial intelligence, and has identified several generations of modelling activities.
The first generation was characterised by the use of (the first) computers as calculation devices of analytical expressions, i.e., as little more than superior slide rules.
The second generation of modelling appeared since users recognised the value of the sequential, repetitive and recursive modes of operation of their digital machines and turned to finite differences in order to represent and then solve differential equations numerically.
The third generation of modelling developed from about 1970 onwards, when it was recognised the possibility and value of producing software packages for a wide class of similar problems. This enabled resources to be invested on a system that could be used repetitively by a wide range of users. Standards were developed for input and output, preceding future links to databases, GIS and graphical display tools. In turn, the effectiveness of these third generation systems became heavily dependent on “main frame” computers, and the skills and experience of the users.
Since the early 1980s personal computers appeared as serious professional tools, and it was natural for the modelling software packages of the third generation to be ported to them. In turn, the whole mode of operation of the systems aspect of the packages was rapidly improved. This resulted in the modelling systems being used by people who were not computational hydraulics specialists. They demanded high standards of robustness, consistency and ease of use from the software providers, who adopted production means from software engineering and the information technology industry. It meant also that the focus of the developers was on the technology rather than scientific research. The resulting fourth generation modelling systems have subsequently been transformed through close integration with databases, GIS and sophisticated graphics display tools (Price and Solomatine, 2009).
The birth of hydroinformatics has been identified by Abbott (1996) to have occurred during the transition between the third and fourth generations of modelling. He points out that the revealing
Luís Vieira 13
offered by the technology has been made to many thousands of users of fourth generation modelling systems, even if the users are still predominantly specialists in hydraulics, hydrology and water resources employed by different organisations.
The meaning has evolved since. Probably the most consensual definition would be today that Hydroinformatics is about making the best use of information technologies to manage water in the environment. The term “manage” is used here in very wide sense meaning dealing with the whole extent of information and engineering subjects, such as: data collection, measurement, interpretation, and design of river basin management strategies including civil engineering structures, modelling (simulation) of river, groundwater and coastal flows and water quality to forecast natural events (floods) as well as the impacts of human activities. (Pinho et al., 2013). Hydroinformatics covers the application of information technology applied to the water sector in the widest sense. The continuously increasing speed of computers and increased density of information storage, the increased communication potential through internet and the creative power of scientists have brought us rapidly forward in the way in which water related studies can be executed, currently based upon a much better understanding of underlying physical-chemical and biological processes.
2.2.1 Modelling and simulation
Modelling is at the heart of Hydroinformatics. Models are constructed by the process of conceptualizing the real world system into structural and process objects and abstracting the collection of objects into a feasible system. A hydroinformatics model is designed by the developer who works from his/her own worldview, and particularly for the class of problems that the software package is supposed to address. It does not follow that the user has the same point of view as the developer. Consequently, there are big risks that the user will apply the software package outside the limits for which it was designed. Much is left up to the user concerning how to structure his/her model, what data to select, how to calibrate and validate the model, how to interpret and communicate the results, etc. The decision maker is usually yet a third person, who is even more remote from the modelling process, but intimately concerned with what the model produces in terms of information that will assist in the decision making process.
The application of modelling software tools has brought about radical improvements in our understanding of large-scale water-based systems, such as rivers, lakes, estuaries and coastal waters (Pinho, J.L.S., 2001; Duarte et al., 2001; Pinho et al., 2004; Pinho & Vieira, 2005). The tools have
14 Luís Vieira
been extended to include the advection and dispersion of pollutants in the flow, the transport of sediment suspended in the water column and as bed load, the consequences of the water flow for different biological species, the interaction of flow with structures, etc. More emphasis is now being given to the safety and reliability of a given software modelling system as it is of increasing importance for decision making in environmental official policies. In the last decades major efforts have been done to make water quality data bases and modelling tools available for water resources management at a river basin scale. The European Water Framework Directive encourages the use of these tools to investigate the surface water quality status and to anticipate the impact of measures to be implemented in order to achieve a good ecological status by 2015 (European Commission, 2000).
Nowadays a wide infrastructure of hydroinformatics tools is available for modelling and simulation of natural systems enabling a very high potential to be explored and expanded to improve service to society. It comprises: data acquisition and data management techniques; new simulation techniques based upon cognitive sciences and pattern recognition, such as artificial neural networks, data mining and knowledge discovery techniques; evolutionary algorithms; decision support and management systems; forecasting and data assimilation methods; fuzzy logic; cellular automata; integration of systems and technologies; and emerging internet based technologies (Verwey, 2005). Over the years, several companies and research institutions developed modelling software. The competition is fierce and each software developed has different potentials. A research on some well-known modelling applications was made in order to ascertain their current capabilities. Some software is more mainstream than others, but because of the rivalry and competition from developers, these tools tend to increase in robustness and in wide range of applications offering more confidence and user friendly solutions in benefit of results reliability.
From a wide spectrum of software available for application in surface water systems a comparative study of their characteristics and computing capabilities has been made.
2.2.2 Modeling software – A review
2.2.2.1 POM (Princeton Ocean Model)
POM is a numerical ocean model created by Alan Blumberg and George Mellor around 1977 (POM, 2013). Subsequent contributions were made by Leo Oey, Jim Herring, Lakshmi Kantha and Boris Galperin and others. Institutionally, the model was developed and applied to oceanographic
Luís Vieira 15
problems in the Atmospheric and Oceanic Sciences Program of Princeton University, the Geophysical Fluid Dynamics Laboratory of NOAA and Dynalysis of Princeton.
This model is a three-dimensional, primitive equation, time-dependent, free surface, estuarine and coastal ocean circulation model. One apparently unique feature at time it was its imbedded turbulent closure submodel which on the basis of previous studies should yield realistic, Ekman surface and bottom layers. The model has been designed to represent ocean physics as realistically as possible and to address phenomena of 1-100km length and tidal-monthly time scales depending on basin size and grid resolution. The governing equations that are used to simulate all the scenarios as well as the boundary conditions are solved by finite difference techniques.
This model has some great principal attributes. It contains an imbedded second moment turbulence closure sub-model to provide vertical mixing coefficients and this sub-model the vertical coordinate is scaled on the water column depth. There is a horizontal gird that uses curvilinear orthogonal coordinates and an “Arakawa C” differencing scheme. The horizontal time differencing is explicit whereas the vertical differencing is implicit. The latter eliminates time constraints for the vertical coordinate and permits the use of fine vertical resolution in the surface and bottom boundary layers. The model has a free surface and a split time step. The external mode portion of the model is two-dimensional and uses a short time step based on the CFL condition and the external wave speed. The internal mode is three-dimensional and uses a long time step based on the CFL condition and the internal wave speed. Also, there is an complete thermodynamics analysis implemented on this software.
2.2.2.2 DELFT3D
Delft3D (Delft3D, 2013) software comprises several numerical models used to simulate natural environments such as coastal areas, rivers, reservoirs and estuaries. This model allows two-dimensional horizontally and three two-dimensional applications. It is a high complexity mathematical model and it’s applicable on analysing flows of tides, currents due to wind, river runoff simulations, lakes and bayous, the propagation of tsunamis, hydraulic rebounds, in coastal and fluvial morphodynamics and pollutant transportation analysis as well as in the water temperature changing panorama and salinity gradients.
Delft3D is composed of several modules, where the FLOW module gets greater prominence. Delft3D-FLOW is the hydrodynamic module of Delft3D, which is Delft Hydraulics'
fully-16 Luís Vieira
integrated program for the modelling of water flows, waves, water quality, particle tracking, ecology, sediment and chemical transports and morphology.
The primary purpose of the computational model Delft3D-FLOW is to solve various one, two and three-dimensional, time-dependent, linear differential equations related to hydrostatic and non-hydrostatic free-surface flow problems on a structured orthogonal grid to cover problems with complicated geometry. The equations are formulated in orthogonal curvilinear co-ordinates on a plane or in spherical co-ordinates on the globe. In Delft3D-FLOW models with a rectangular or spherical grid (Cartesian frame of reference) are considered as a special form of a curvilinear grid (Kernkamp et al., 2005; Willemse et al., 1986).
The equations solved are mathematical descriptions of physical conservation laws for water volume (continuity equation), linear momentum (Reynolds-averaged Navier-Stokes (RANS) equations), and tracer mass (transport equation) and suspended sediments or passive pollutants. Furthermore, bed level changes are computed, which depend on the quantity of bottom sediments.
Delft3D-FLOW can be used in either hydrostatic or non-hydrostatic mode. In case of hydrostatic modelling the so-called shallow water equations are solved, whereas in non-hydrostatic mode the Navier-Stokes equations are taken into account by adding non-hydrostatic terms to the shallow water equations. A fine horizontal grid is needed to resolve non-hydrostatic flow phenomena. This powerful computation model can be characterized in great distinguished properties. The grid alignment with complicated boundaries and local grid refinements to meet the needs of resolving finer spatial resolution in various numerical modeling tasks results in an accurate description of geometry. It has application for one and two-dimensional vertically averaged as well as hydrostatic or non-hydrostatic three-dimensional problems. Delft3D-FLOW is a solution technique that allows for solution based on accuracy considerations rather than stability (alternating direction implicit finite difference method). It’s a computationally efficient and robust software that as a computational core and a separate user interface and its extremely efficient coupled with other physical processes via the other modules of the integrated Delft3D modelling system.
Delft3D-FLOW Applications
This computational model can be used in a wide range of applications. Delft3D-FLOW can be used for an accurate prediction of the tidal dynamics (water elevation, currents) in estuaries or coastal seas, can be used for an accurate prediction of the density (salinity and/or temperature) driven flow and sediment concentrations can be taken into account with respect to density values. It also can be
Luís Vieira 17
used for an accurate prediction of wind driven flow and storm surges and as an accurate prediction of horizontal transport of matter, both on large and small scales.
Other use of this software is the ability to investigate the hydrodynamic impact of engineering works, such as land reclamation, breakwaters, dikes and the impact of hydraulic structures such as gates, weirs and barriers.
Delft3D-FLOW can be used for an accurate prediction of waste water dispersion from coastal outfalls, prediction of thermal stratification in seas, lakes and reservoirs and to describe and quantify the thermal recirculation between discharge and intake points.
Flows resulting from dam breaks can also be accurate predicted as well as small scale current patterns near harbour entrances.
These are just some applications of this software and as can be seen, the possibilities are endless and it’s concluded that the potential of this software is huge.
2.2.2.3 TELEMAC
TELEMAC was developed by the National Hydraulics and Environment Laboratory (LNHE, 2013) of the Research and Development Directorate of the French Electricity Board (EDF-DRD), in collaboration with other research institutes. All the modules of the TELEMAC system have been open sourced since July 2010 and can be downloaded on their official website.
The TELEMAC system comprises several modules including pre-processing, hydrodynamics, sedimentology, water quality, waves, sub-surface flows and post-processing.
Pre-processing is a software module designed to generate a mesh consisting of triangular elements, using bathymetric and/or topographic data.
The Hydrodynamics module consists in two big groups. TELEMAC-2D is designed to perform a hydrodynamic simulation in two horizontal space dimensions. In addition this module can simulate the transport of dissolved tracers. The TELEMAC-3D software is designed to carry out hydrodynamic simulations of flows in three space dimensions and it is able to simulate the transport of tracers and has an library that contains the relevant subroutines for simulating non-cohesive sediment transport. This document is concerned with the implementation of the TELEMAC-3D software.
18 Luís Vieira
Sedimentology module is designed to simulate the transport of sediment through bed load traction and suspension as well as water quality models that able the user to simulate suspended sediment transportation.
Through waves software module it is possible to simulate changes in the features of wave agitation either in a coastal water body or a harbor.
Sub-surface flows module can simulate two or three-dimensional pollutant transport in a subsurface medium.
Finally, the post-processing software processes the information and presents the results within a modern graphic display.
The TELEMAC system is a powerful integrated modelling tool for use in the field of free-surface flows. The various simulation modules use high-capacity algorithms based on the finite-element method. Space is discretized in the form of an unstructured grid of triangular elements, which means that it can be refined particularly in areas of special interest. This avoids the need for systematic use of embedded models, as is the case with the finite-difference method. TELEMAC has numerous applications in both river and maritime hydraulics.
2.2.2.4 MOHID
MOHID is an hydrodynamic model and it was created back in 1985. MOHID Water Modelling System is a modular finite volumes water modelling system written in ANSI FORTRAN 95 using an object oriented programming philosophy, integrating diverse numerical models and supporting graphical user interfaces that manage all the pre- and post-processing (MOHID, 2103). It is an integrated modelling tool able to simulate physical and biogeochemical processes in the water column as well as in the sediments, and is also able to simulate the coupling between these two domains and the latter with the atmosphere.
The MOHID system is composed of several modules which can be divided in three major groups, MOHID Water, Land and Soil.
MOHID Water performs simulations related to hydrodynamic wave propagation, the dispersion phenomena, water quality, sediment transportation and biogeochemical processes. The graphical user interfaces of the MOHID Water Modelling System are a set of programs to pre and post process the input and output data needed by the different numerical programs.
Luís Vieira 19
MOHID Land is the newest core executable of the MOHID Water Modelling System. This program is designed to simulate hydrographic basin and aquifers, some classes developed are related with specific processes which occur inside a watershed.
The Module Soil in MOHID solves the Richards equation for Saturated and Unsaturated porous media. This module is used for water flow in porous media. In the present, the hydraulic properties are described using Van Genuchten function. However the model is prepared, if needed, to include any model that describes the relation between water content and pressure head and the relation of conductivity and pressure head.
2.2.2.5 RMA2
RMA2 is a 1D/2D hydrodynamic model using the finite element method. RMA2 was written by Ian King and is maintained by the Army Corp of Engineers Engineering Resource Development Center (ERDC, 2013). RMA2 has been applied to multi-dimensional problems since the mid-1970s. As such, it was one of the first widely used multi-dimensional hydrodynamics engine applied to riverine and estuarine applications.
RMA2 is a two-dimensional depth averaged finite element hydrodynamic numerical model. It computes water surface elevations and horizontal velocity components for subcritical, free-surface flow in two-dimensional flow fields. RMA2 computes a finite element solution of the Reynolds form of the Navier-Stokes equations for turbulent flows. Friction is calculated with the Manning's or Chezy equation, and eddy viscosity coefficients are used to define turbulence characteristics. Both steady and unsteady state (dynamic) problems can be analysed.
RMA2 has been applied to calculate water levels and flow distribution around islands; flow at bridges having one or more relief openings, in contracting and expanding reaches, into and out of off-channel hydropower plants, at river junctions, and into and out of pumping plant channels; circulation and transport in water bodies with wetlands; and general water levels and flow patterns in rivers, reservoirs, and estuaries.
This software is a general purpose model designed for far-field problems in which vertical accelerations are negligible and velocity vectors generally point in the same direction over the entire depth of the water column at any instant of time. It expects a vertically homogeneous fluid with a free surface.
20 Luís Vieira
RMA2 is capable of simulate wetting and drying events, providing for a more accurate account of off-channel storage, adjusting for wet and dry by element and account for Marsh Porosity wetlands. The wind stress can be applied uniformly, constant or time-varying over the model domain and as a storm as a time-varying event.
This software provides computational controls such as wet and dry parameters, iteration controls and revisions within a time step. It accepts a wide variety of boundary conditions that can be customized for a better linkage on every data that is initially known.
Besides all of these features, RMA2 has some limitations. This software operates under the hydrostatic assumption meaning accelerations in the vertical direction are negligible. It is two dimensional in the horizontal plane. It is not intended to be used for near field problems where vortices, vibrations, or vertical accelerations are of primary interest. Vertically-stratified flow effects are beyond the capabilities of RMA2. RMA2 is a free-surface calculation model for subcritical flow problems. More complex flows where vertical variations of variables are important should be evaluated using a three-dimensional model such as RMA10.
2.2.2.6 MIKE 21
MIKE 21 is a depth-averaged two-dimensional (2-DH) numerical modelling tool designed to simulate water levels and flows in rivers, estuaries, bays and coastal areas. It can simulate both steady-state (constant) flow conditions or unsteady (time varying) flow conditions in the two horizontal dimensions. This proprietary modelling tool was developed by and can be obtained from DHI Water and Environment in Denmark (DHI, 2013).
MIKE 21 provides the last generation of modelling and resources in the simulation of physical processes, chemical or biological in sea or coastal areas.
MIKE 21 can be considered as a 3 in 1 package. It comprehends three different simulation engines, single grid, multiple grids or a flexible mesh. The classic single grid is easy to set up rectilinear model which has a simple input / output platform. As well as single grid, the multiple grids consist in a rectilinear model but with dynamic grouping enabling the capacity to focus grid resolution. The flexible mesh performs the maximum flexibility grid resolution within the model.
With all these powerful engines, MIKE 21 is capable of innumerous possible applications such as designing data assessments for coastal and offshore structures, optimization of port layout and coastal protection measures, do an analysis of recirculation, desalination and cooling water,
Luís Vieira 21
evaluation of environmental impact assessment created by marine infrastructures in many other applications.
Despite all of this wide range of application, MIKE 21 is modular software. This means that the user only buys what he needs. There are a vast number of modules designed for various applications. Focusing on the four major modules available (pre and post processing, hydrodynamics, advection-dispersion and sand transport) can be concluded that there is a variable potential in each one of this modules.
Pre and post processing module provides an integrated environment offering convenient and compatible routines to facilitate the input and data analyses tasks and the presentation of the simulation results.
The hydrodynamics module simulates the variation of flows and water level in response of forcing functions. With the advection-dispersion component, the dispersion and the decay of suspended or dissolved substances can be simulated.
The sand transport module has several formulations for current or wave generated transport, including 2DH description of sediment transport rates. This morphodynamics module is used in optimization of port layouts, stability of tidal inlets, impact of shore protection, as long with many other uses.
MIKE 21 is a highly respected modelling tool that comes with all of the standard hydrodynamic modelling capabilities needed to assess frequency and duration of flooding needs. However, as with all numerical models MIKE 21 is strongly dependent on user specified information including: inflow boundary conditions, tides, channel and floodplain roughness (including ground surface conditions, vegetation, cropping, cultivation patterns), floodplain topographic details, channel bathymetry, characteristics of flow obstructions and other required model parameters such as eddy viscosity and bed friction.
2.2.2.7 SOBEK
SOBEK is one and two dimensional modelling software developed by Deltares, and it’s applicable to problems of hydrodynamic modelling in rivers, estuaries or drainage network (Deltares, 2013). SOBEK is also used in flood forecasting, optimization of drainage systems, control of irrigation systems, monitoring the soil water level, river morphology, salt intrusion and surface water quality. It is based on a powerful numerical method that allows obtaining solutions for more complex simulations. The modelling is based on the Saint Venant hydrodynamic equations. It has been
22 Luís Vieira
developed - and is being further developed - jointly with Dutch public institutes and governmental organizations, research institutes, universities and private consultants all over the world.
SOBEK gives water managers a high-quality tool for modelling irrigation systems, drainage systems and natural streams in lowlands and hilly areas. Applications are typically related to optimizing agricultural production, flood control, irrigation, canal automation, reservoir operation and water quality control.
SOBEK calculates (easily, accurately and fast) the flow in simple or complex channel networks, consisting of thousands of reaches, cross sections and structures. The user can define all types of boundary conditions, as well as define lateral inflow and outflow using time series or standard formulae. For water quality and environmental problems the water quality module offers almost unlimited possibilities.
The graphic display superimposes the network over a map of the area so the user can see the canals, reservoirs, weirs and pumping stations at a glance. Animation options show the direction of flow through the network and by varying the thickness and colours of selected network elements, all input and computed parameters can be visualized. By clicking on the map the user can draw a network and adjust any detail to suit his needs. The network can also be viewed side-lined. Side view allows watching the water profiles and real-time operation of structures in detail.
SOBEK has some competitive advantages that are important to review: Integrated approach
One software environment for the simulation of problems in the areas of rivers, drainage systems, irrigation systems and sewer systems, while maintaining the application specific user interfaces. This allows for combinations of flow in closed conduits, open channels, rivers overland flows, as well as a variety of hydraulic, hydrological and environmental processes.
Coupling with 2D overland flow simulation
SOBEK allows for the combined simulation of pipe-channel and overland flow through and implicit coupling of 1D and 2D flow equations. This makes SOBEK the ideal tool for studying the effects of dam breaks, river flood,s dike breaches, urban flooding, etc.
Open System
SOBEK is open to the connection of user-made modules through the specification of data exchange formats and functionalities. This approach allows the inclusion of expertise available at a number of