1 1 Braz. J. Biol., 2015, vol. 75, no. 2 (suppl.), p. S1-S10
http://dx.doi.org/10.1590/1519-6984.0213 Original Article
History of water quality parameters – a study on the
Sinos River/Brazil
Konzen, GB.
a, Figueiredo, JAS.
aand Quevedo, DM.
a*
aPrograma de Pós-Graduação em Qualidade Ambiental, Universidade Feevale, Rodovia RS 239, 2755, Vila Nova, Novo Hamburgo, RS, Brazil
*e-mail: [email protected]
Received: May 24, 2013 – Accepted: August 21, 2013 – Distributed: May 31, 2015 (With 2 figures)
Abstract
Water is increasingly becoming a valuable resource, constituting one of the central themes of environmental, economic and social discussions. The Sinos River, located in southern Brazil, is the main river from the Sinos River Basin, representing a source of drinking water supply for a highly populated region. Considering its size and importance, it becomes necessary to conduct a study to follow up the water quality of this river, which is considered by some experts as one of the most polluted rivers in Brazil. As for this study, its great importance lies in the historical analysis of indicators. In this sense, we sought to develop aspects related to the management of water resources by performing a historical analysis of the Water Quality Index (WQI) of the Sinos River, using statistical methods. With regard to the methodological procedures, it should be pointed out that this study performs a time analysis of monitoring data on parameters related to a punctual measurement that is variable in time, using statistical tools. The data used refer to analyses of the water quality of the Sinos River (WQI) from the State Environmental Protection Agency Henrique Luiz Roessler (Fundação Estadual de Proteção Ambiental Henrique Luiz Roessler, FEPAM) covering the period between 2000 and 2008, as well as to a theoretical analysis focusing on the management of water resources. The study of WQI and its parameters by statistical analysis has shown to be effective, ensuring its effectiveness as a tool for the management of water resources. The descriptive analysis of the WQI and its parameters showed that the water quality of the Sinos River is concerning low, which reaffirms that it is one of the most polluted rivers in Brazil. It should be highlighted that there was an overall difficulty in obtaining data with the appropriate periodicity, as well as a long complete series, which limited the conduction of statistical studies such as the present one.
Keywords: WQI - Water Quality Index, management of water resources, statistical analysis.
Histórico dos parâmetros de qualidade da água – um estudo do
Rio dos Sinos/RS - Brasil
Resumo
A água, cada vez mais, está se tornando um recurso valioso, aparecendo como um dos eixos centrais das discussões ambientais, econômicas e sociais. O Rio dos Sinos, localizado na região Sul do Brasil, é o principal rio que compõe a Bacia Hidrográfica do Rio dos Sinos, sendo fonte de abastecimento de água potável de uma região extremamente povoada. Tendo em vista sua dimensão e importância, se faz necessário um estudo para acompanhar a qualidade da água deste rio, que por alguns estudiosos, é considerado um dos rios mais poluídos do Brasil. Este estudo tem na análise histórica de indicadores, sua grande importância. Nesse sentido, objetivou-se desenvolver aspectos de gestão de Recursos Hídricos, mediante a análise histórica do Índice de Qualidade das Águas - IQA do Rio dos Sinos – RS, através de métodos estatísticos. Quanto aos procedimentos metodológicos, destaca-se que este estudo, utiliza a análise temporal de dados de monitoramento de parâmetros ligados a uma medição pontual variante no tempo, utilizando ferramentas estatísticas. Os dados utilizados provêm da FEPAM (Fundação Estadual de Proteção Ambiental Henrique Luiz Roessler), no período de 2000 a 2008, de análises sobre a qualidade da água do Rio dos Sinos (Índice da Qualidade da Água), assim como uma análise teórica, na perspectiva da gestão de recursos hídricos. O estudo de índices de qualidade da água (IQA) e dos parâmetros que o compõe, mediante a análise estatística, demonstrou-se eficaz, garantindo sua efetividade na utilização como ferramenta de gestão dos Recursos Hídricos. Mediante a análise descritiva dos parâmetros e do IQA, observou-se que o Rio dos Sinos, apresenta condições de qualidade das águas em um índice inferior preocupante, reafirmando que, este é um dos rios mais poluídos do Brasil. Destaca-se, de uma forma geral, a dificuldade de obtenção de dados com uma periodicidade adequada, assim como uma série longa completa, sendo estes, limitantes para a realização de estudos estatísticos como este.
1. Introduction
Historically, people have searched for river valleys, building their lives around these valleys, because their survival has always been directly related to water availability. Thus, in recent decades, the environment has become a significant concern for Brazilian society. Article 225 of the Brazilian Federal Constitution (Brasil, 2008) met the demands of social movements, establishing that “everyone has the right to an ecologically balanced environment” and that this environment “is an asset of common use by people and essential to a healthy quality of life”.
The situation of water availability in the world is far from that of abundance and unrestricted access which in the past, were associated with the image of “water planet”. The growth of cities and their high level of urbanisation, the high urban and industrial concentration, as well as the lack of sewage treatment, both industrial and domestic, have led river pollution to reach alarming levels.
The pollution of water resources, caused by different sources, leads to the need of developing and implementing plans of prevention and recovery of environmental conditions for current and future use. The main river of the Sinos River Basin is the Sinos River, which is considered today as one of the most polluted in Brazil due to the huge amount of untreated sewage and toxic effluents it receives on a daily basis. However, this river provides the highest volume of water for public supply in the Sinos River Valley.
In such a context, this study aimed to evaluate a historical data series from the monitoring of four sites along the Sinos River. Based on data obtained from statistical tools, the present study discussed the results for the Water Quality Index (WQI) and for its physical-chemical parameters with regard to the Resolution 357/05 of the Brazilian National
Council of Environment (Brasil, 2005).
This study sought statistical methods to describe the behaviour of water quality indicators over time and its possible association with potentially polluting factors, such as those resulting from urban and rural development. This analysis can be of great importance in the management of water resources in the region. The statistical analysis and the modelling of these data have shown to be useful tools for managing these water resources, since they allow for estimates and scenario simulations.
Thus, the great importance of this study of the Sinos River water quality indicators lies in the historical analysis of indicators, which allows for estimates and simulations of future scenarios.
2. Material and Methods
This quantitative descriptive research followed a documental and bibliographical approach. The documental research used data on the WQI of the Sinos River and on its parameters from the period between 2000 and 2008. The bibliographic research analysed the references that supported the study.
2.1. Universe and sample
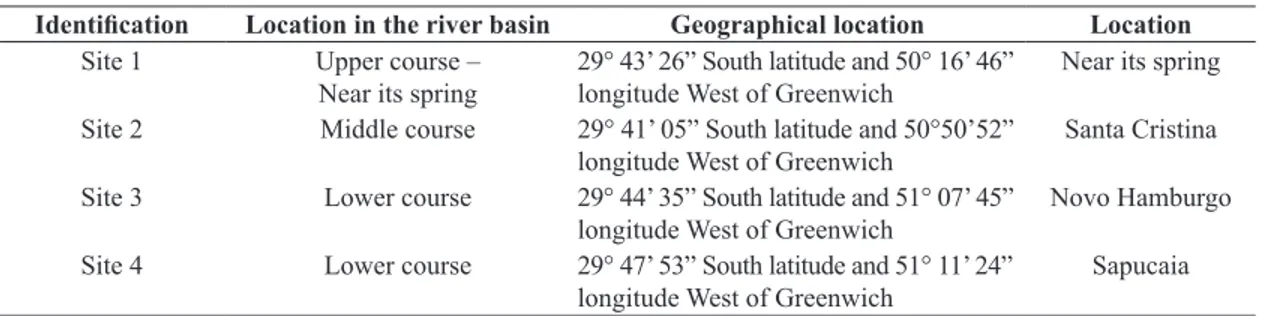
The research universe comprises physical-chemical data from the water quality monitoring of the Sinos River, as well as potentially polluting factors related to these data. This investigation analysed data from four sites, located at three courses of the river, one at the upper course, one at the middle course, and two at the lower course, as shown in Table 1:
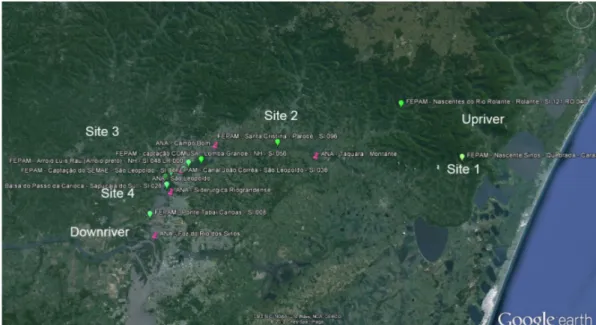
This river is under the auspices of the Sinos River Basin Management Committee (Comitê de Gerenciamento da Bacia Hidrográfica do Rio do Sinos, COMITESINOS), the first state committee for the management of a river basin in Brazil, and is monitored both by the State Environmental Protection Agency Henrique Luiz Roessler (Fundação Estadual de Proteção Ambiental Henrique Luiz Roessler, FEPAM) and by the National Water Agency (Agência
Nacional de Águas, ANA), as observed in Figure 1,
which presents the map of the collection sites of the two institutions.
2.2. Data survey, collection and development
The data used in this study come from secondary data on the water quality of the Sinos River provided by FEPAM, covering the period from 2000 to 2008, with the obtaining of all parameters and subsequent calculation of the WQI, and from 2009 to 2010 with data on WQI mean.
We also collected information on the water flow of three sites, using information from Hidroweb of ANA (Brasil, 2012), according to the measurements reported in the municipalities of Taquara (Latitude -29:40:0; Longitude -50:47:0), Campo Bom (Latitude -29:41:31;
Table 1. Sites studied.
Identification Location in the river basin Geographical location Location
Site 1 Upper course –
Near its spring
29° 43’ 26” South latitude and 50° 16’ 46” longitude West of Greenwich
Near its spring
Site 2 Middle course 29° 41’ 05” South latitude and 50°50’52” longitude West of Greenwich
Santa Cristina
Site 3 Lower course 29° 44’ 35” South latitude and 51° 07’ 45” longitude West of Greenwich
Novo Hamburgo
Site 4 Lower course 29° 47’ 53” South latitude and 51° 11’ 24” longitude West of Greenwich
Braz. J. Biol., 2015, vol. 75, no. 2 (suppl.), p. S1-S10 3 Water quality of the Sinos River – Brazil
3 Longitude -51:2:42), and São Leopoldo (Latitude -29:45:32;
Longitude -51:9:2). Socioeconomic data on rural activity and mainly on industrial activity along the Sinos River Basin were studied using secondary data and map study. 2.3. Data analysis and interpretation
The data obtained were analysed using descriptive statistics, and trend analysis was estimated by linear regression analysis (Neter et al., 1996). Bollmann (2003) states that, as for environmental studies, consistent data series allowing for the identification of trends require long periods of observation.
After performing a data analysis over time, the possible association between data series from monitoring and information on polluting factors (irrigation, stockbreeding, urban development, agriculture, and industry) was determined, considering the different collection sites along the Sinos River and the different characteristics of the three courses of the Sinos River, identified through images.
The WQI was calculated based on this data series provided by FEPAM. This index was created in 1970 in the United States by the National Sanitation Foundation to measure water quality, evaluating the quality of raw water to be used for public supply after being treated.
The parameters used for WQI calculation are mostly indicators of contamination caused by the release of domestic sewage (Brasil, 2012). Chart 1 shows range values that qualify WQI values.
The analysis of water quality using the WQI, in aspects concerning the management of water resources, makes analysis and decision-making easier, because this index, which is calculated, according to IIEGA et al. (2010), by the weighted product of several physical-chemical parameters, such as pH, Turbidity, Thermotolerant Coliforms, BOD, Total Nitrogen, Total Phosphorus, Temperature, Total Waste, and Dissolved Oxygen, provides a wide perspective on water conditions; additionally, in occasions when there are great variations, isolate data from parameters should be observed. This index adopts values between 0 and 100, with classifications ranging from “very bad” to “excellent”.
3. Results
The data from the observed sites were analyzed through a descriptive analysis of the series, and the analysed parameters were described as minimum, maximum, mean and standard deviation, as shown in Table 2. Such analysis made it possible to investigate these data with regard to
Figure 1. Monitoring Sites – ANA and FEPAM.
Chart 1.WQI ranges.
WQI ranges used in the following states: AL, MG, MT, PR,
RJ, RN, RS
WQI ranges used in the following states: BA, CE, ES, GO,
MS, PB, PE, SP
Evaluation of Water Quality
91-100 80-100 Excellent
71-90 52-79 Good
51-70 37-51 Medium
26-50 20-36 Bad
0-25 0-19 Very bad
Braz. J. Biol., 2015, vol. 75, no. 2 (suppl.), p. S1-S10
Konzen, GB., Figueiredo, JAS. and Quevedo, DM.
Site / Parameter
SITE S1 SITE S2 SITE S3 SITE S4
N Minimum Maximum Mean Standard Deviation N Minimum Maximum Mean Standard Deviation N Minimum Maximum Mean Standard Deviation N Minimum Maximum Mean Standard Deviation
BOD5 (mgL–1) 94 1 1 1 0 77 1 11 1.41 1.27 61 1 48 9.2 9.52 76 1 30 2.61 3.38
COD (mgO2L–1) 93 5 33 6.91 4.43 78 5 33 12.2 5.90 73 11 296 54.86 47.97 74 6 35 17.25 4.89
Chloride (mgL–1) 86 1 13 3.64 1.36 77 1 14 3.67 2.03 74 2 54 20.05 12.51 77 2 36 10.17 5.62
Conductivity 92 5 107 35.7 15.57 75 5 199 64.2 24.78 74 34 536 233.19 142.58 77 20 378 103.61 53.36
Total Nitrogen (mgL–1) 94 0 2 0.6 0.17 35 0 2 0.73 0.24 36 1 22 8.65 7.00 35 0 11 1.98 1.92
Ammoniacal Nitrogen (mgL–1)
89 0 0 0.09 0.071 73 0 0 0.18 0.09 67 0 70 7.01 9.12 71 0 41 7.44 10.76
Total Phosphorus (mgL–1)
92 0 0 0.03 0.024 74 0 10 0.24 1.20 69 0 20 1.3 2.89 74 0 1 0.22 0.10
Total Solids (mgL–1) 94 15 450 45.8 55.91 77 50 226 85.7 26.89 72 82 10224 392.85 1264.9 76 47 203 113.04 25.96
pH 92 6 9 6.88 0.58 75 5 8 6.73 0.52 68 6 8 6.77 0.41 70 5 8 6.7 0.394
Turbidity (UNT) 90 2 52 5.73 7.20 75 6 148 33.6 23.867 65 12 240 56.58 45.199 74 16 120 39.55 18.61
Dissolved Oxygen (mgL–1)
94 4 12 7.9 1.61 77 4 14 6.84 1.467 72 0 8 3.32 2.023 76 0 11 3.99 2.001
Thermotolerant
Coliforms (EC)
NMP org/100ml
95 2 600 47.8 86.51 31 15 24000 5381 6021.9 63 980 1700000 164974 313908 69 21 66000 6781 11047.8
Phenol Index 69 0 0 0 0 51 0 0 0 0.001 66 0 11 0.27 1.487 71 0 0 0.02 0.06
Surfactants (mgL–1) 0 62 0 1 0.07 0.18 64 0 21 2.87 5.556 71 0 21 0.4 2.46
Braz. J. Biol., 2015, vol. 75, no. 2 (suppl.), p. S1-S10 5 Water quality of the Sinos River – Brazil
5 the maximum levels of class III water, which comprises
water intended for human consumption after conventional or advanced treatment, according to CONAMA resolution 357/05 (Brasil, 2005).
In Table 2, it is possible to observe that the level of BOD5, i.e., the amount of oxygen necessary to oxidise biodegradable organic matter under aerobic conditions in five days, was higher at S3 and S4 sites.
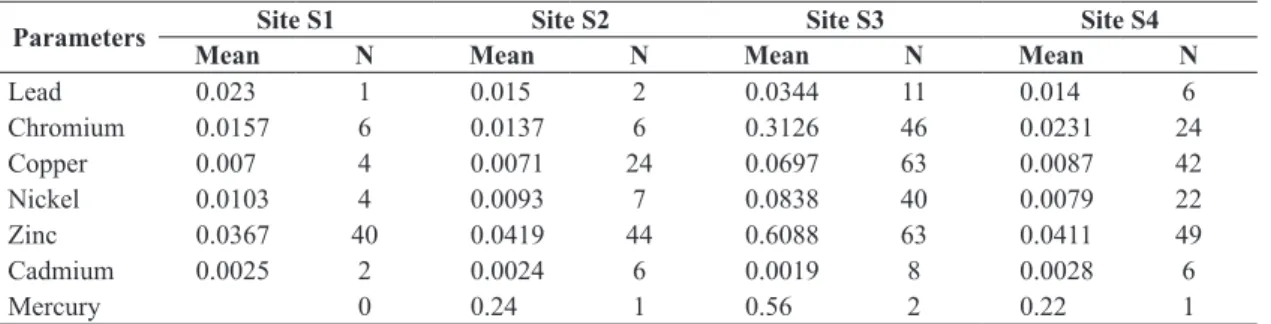
The parameter Thermotolerant Coliforms, as shown in Table 2, included bacteria of the coliform group, with the possible existence of pathogenic microorganisms, responsible for the transmission of several water-transmitted diseases. Among the parameters analysed there are some metals, which, although being typical of sediments, were found in the analyses of water samples. Since the frequency of occurrence of most of these metals is low, their descriptive analysis was performed only for the days when the parameter was found. Table 3 presents the description of these parameters.
As for the maximum levels established by CONAMA resolution 357/05 (Brasil, 2005) for class III water, which comprises water intended for human consumption after conventional or advanced treatment, it can be observed that BOD5 at site S3 was close to the maximum value for this class, reaching 9.2 mg/l compared to the maximum of 10 mg/l; Total Phosphorus, from site S2 on, showed a value higher than that allowed in the legislation, which is 0.05 mg/L. Total Solids were within the limit values, as well as pH, whose mean was within the limit values but is always close to the minimum, which indicates that the water had a low pH; in addition, Turbidity was also within the established values. With regard to Dissolved Oxygen, it is required to be higher than 4mg/L, but at sites S3 and S4 it was found that their mean were below the expected. As for Thermotolerant Coliforms, their levels were much higher than the values recommended for this class, which determine the maximum of 4000 per 100 millilitres. As for
the Phenol Index, it was also observed that sites S3 and S4 had levels higher than those established in the resolution, which are 0.01 mg/L. Considering this analysis, it is possible to see that water quality was below the required levels for public supply.
Based on the data, it was found that from the river spring on there was the presence of metals, such as chromium in 06 (six) of samples, as well as zinc in 40 (forty) of the samples at site S1 and 63 (sixty-three) at site S3. Among all data, it is worth stressing the high concentration of zinc and its presence in most of the samples, at almost all sites observed.
It is possible to observe the high occurrence of chromium, copper and nickel at sites S3 and S4, which were located at regions of high anthropic concentration of the Sinos River We hypothesize that the reason for the occurrence of these concentrations is the high population and industrial concentration of this region. Chart 2 shows the possible health consequences of some of these metals.
Blume et. al. (2010) observed untreated sewage in the Sinos
River, caused by the tannery, metallurgical and timber industries in the region, posing a severe environmental hazard in this area.
3.1. Analysis of the Water Quality Index (WQI)
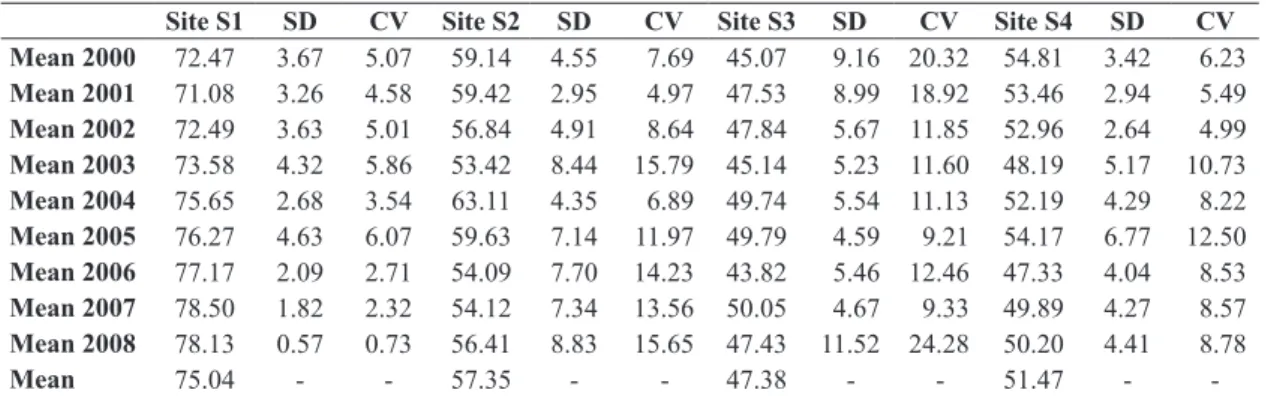
Based on the analysis of the descriptive statistics of data for WQI, as shown in Table 4, it was found that the first site of the river, located at its upper course, showed an increasing improvement in WQI, and thus its water was considered of “Good” quality. It calls the attention the fact that, since this site is in the river spring region, which is still low urbanised, the indicators were within a range very close to that of medium quality.
With regard to site S2, as shown in Table 4, the WQI indicated medium quality, presenting variations but remaining within the same range in the entire study period. It can be observed that this site of the river had higher urbanisation
Table 3. Descriptive analysis of metal concentrations.
Parameters Site S1 Site S2 Site S3 Site S4
Mean N Mean N Mean N Mean N
Lead 0.023 1 0.015 2 0.0344 11 0.014 6
Chromium 0.0157 6 0.0137 6 0.3126 46 0.0231 24
Copper 0.007 4 0.0071 24 0.0697 63 0.0087 42
Nickel 0.0103 4 0.0093 7 0.0838 40 0.0079 22
Zinc 0.0367 40 0.0419 44 0.6088 63 0.0411 49
Cadmium 0.0025 2 0.0024 6 0.0019 8 0.0028 6
Mercury 0 0.24 1 0.56 2 0.22 1
Chart 2. Health risks resulting from the presence of metals in water.
Metal Consequence
Cadmium Causes severe gastrointestinal disorder, bronchitis, emphysema, anemia, and kidney stone Lead Causes fatigue, mild abdominal disorders, irritability, and anemia
Chromium At low doses: causes mucosal irritation, gastroenteritis, ulcers, and skin inflammation. At high doses: causes liver and kidneys diseases, which can lead to death.
rates and the exploitation of water for irrigation, which contributed to the reduction of the index.
At site S3, as shown in Table 4, it was found that the water quality remained within the “Bad” quality range in all years studied. The index indicated improvement in water quality in this very urbanised region that has great anthropic influence and is located in the Porto Alegre metropolitan area.
Similarly, it was found that at site S4, which is also a highly urbanized region, the water quality remained “Medium”, but in the last three years became “Bad”.
Graph 1 shows that the annual mean of the WQI at most sites was in the “Medium” range, with a great difference in water quality between the spring site and the second site. This graph includes information on WQI – annual mean – provided as isolated data by FEPAM, and it is possible to observe the increasing improvement in the index at the river spring reduces its value in 2009 and 2010, but in the last two years water quality increased at the remaining sites.
3.2. Trends
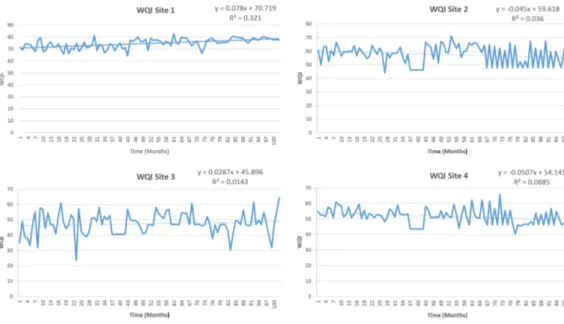
Based on WQI trend analysis, it was possible to find that there was a significant negative trend over time for site S4 (F=13.875, p<0.01). For sites S1, S2 and S3 it was observed that this trend was not significant (F=1.63, p=0.204; F=1.886, p=0.173; and F=1.01, p=0.320, respectively), which indicates that the WQI tends to vary around a mean, with no significant increase or decrease over time. The trend at the evaluated sites is described by the expressions presented in Figure 2 and is considered negative for site S4, which indicates that at this site, the WQI tends to decrease over time. Although sites S1, S2 and S3 were stable over time, it is important to emphasize that sites S3 and S4 remained at a level considered as critical, with water quality classified as bad and very bad in some occasions, and even the site S1, which was located in the river spring, did not reach a WQI score higher than 84.
As for the behaviour of the collected parameters over the study time period, it was observed that most sites did not show a strong trend but remained in a considerably critical situation over time.
Table 4. WQI of the four sites of the Sinos River.
Site S1 SD CV Site S2 SD CV Site S3 SD CV Site S4 SD CV Mean 2000 72.47 3.67 5.07 59.14 4.55 7.69 45.07 9.16 20.32 54.81 3.42 6.23 Mean 2001 71.08 3.26 4.58 59.42 2.95 4.97 47.53 8.99 18.92 53.46 2.94 5.49 Mean 2002 72.49 3.63 5.01 56.84 4.91 8.64 47.84 5.67 11.85 52.96 2.64 4.99 Mean 2003 73.58 4.32 5.86 53.42 8.44 15.79 45.14 5.23 11.60 48.19 5.17 10.73 Mean 2004 75.65 2.68 3.54 63.11 4.35 6.89 49.74 5.54 11.13 52.19 4.29 8.22 Mean 2005 76.27 4.63 6.07 59.63 7.14 11.97 49.79 4.59 9.21 54.17 6.77 12.50 Mean 2006 77.17 2.09 2.71 54.09 7.70 14.23 43.82 5.46 12.46 47.33 4.04 8.53 Mean 2007 78.50 1.82 2.32 54.12 7.34 13.56 50.05 4.67 9.33 49.89 4.27 8.57 Mean 2008 78.13 0.57 0.73 56.41 8.83 15.65 47.43 11.52 24.28 50.20 4.41 8.78
Mean 75.04 - - 57.35 - - 47.38 - - 51.47 -
-CV (Coefficient of Variation); SD (Standard Deviation).
Braz. J. Biol., 2015, vol. 75, no. 2 (suppl.), p. S1-S10 7 Water quality of the Sinos River – Brazil
7 3.3. Correlation of WQI parameters With Water Flow
Since there was no information on the database about water flow at the collection sites, we attempted to approximate data from WQI parameters with those of water flow of near sites. It should be observed that this method is not efficient for load calculation, taking into account that the characteristics of the river at its several sites are very different. However, for correlation analysis, from the management point of view, this analysis shows good results, because it allows one to identify changes in WQI parameters with regard to water flow.
The correlated parameters were the following: BOD5; COD; Chloride; Conductivity; Total Nitrogen; Ammoniacal Nitrogen; Total Phosphorus; Lead; Chromium; Copper; Nickel; Zinc; Total Solids; pH; Turbidity; Dissolved Oxygen; Thermotolerant Coliforms; Cadmium; Phenol Index; Mercury; Surfactants, and Temperature.
The correlation of the spring site was analysed with regard to water flow data from a distant site located in the municipality of Taquara. In this sense, having in mind that values from 0 to 0.3 indicate weak correlation; from 0.3 to 0.6, moderate correlation; and above 0.6, strong correlation, it was observed that the correlation, as shown in Chart 3, is significant only with the mean, and was considered a weak correlation, for the parameters Total Phosphorus and Thermotolerant Coliforms. This may have occurred due to the anthropic differences and to the different types of land occupation found in the two regions.
At site S2, it was observed that there was a positive correlation with the parameters BOD5, COD, Total Solids, and Turbidity, but this correlation was of weak intensity, as shown in Chart 4. What called the attention at this site were the findings for metals, with Mercury and Zinc showing a moderate correlation, whereas Copper and Nickel showed a strong correlation with water flow, which means that these metals were taken to this site from tributaries.
Figure 2. WQI trend (2000 – 2008).
Chart 3. Correlation between WQI parameters and water flow at Site S1.
Parameters
Correlation Maximum
Taq
Minimum Taq
Mean Taq
Total Phosphorus 0.191 0.129 0.252*
Thermotolerant
Coliforms (EC) 0.225 0.100 0.248*
*Significant Correlation at 0.05. Taq = Taquara.
Chart 4. Correlation between parameters and water flow at
Site S2. Parameters
Correlation Maximum
Taq
Minimum Taq
Mean Taq
BOD5 0.167 0.225 0.280*
COD 0.250* 0.132 0.208
Total Solids 0.249 0.107 0.218
pH –0.298* –0.131 –0.158
Turbidity 0.143 0.140 0.190
Mercury 0.236 0.522** 0.311*
Temperature –0.199 –0.359* –0.299*
Copper 0.919** 0.770** 0.910**
Nickel 0.797* 0.988* 0.721
Zinc 0.459** 0.174 0.347*
*Significant Correlation at 0.05; **Significant Correlation at 0.01. Taq = Taquara.
At S3, a negative correlation was found with the parameters BOD5, COD, Chloride, Conductivity, Ammoniacal Nitrogen, Surfactants, and Temperature, which means that these parameters undergo a dilution or reduction when water flow increases. As for Dissolved Oxygen, it was observed that it has a positive correlation with water flow, which indicates that water aeration improves in high water flow periods. Dissolved Oxygen is one of the major concerns in the management of the Sinos River, because its situation becomes much worse in periods of drought and low water flow. The data found at site S3 showed that there was a punctual pollution at this site which is typical of the evaluated area and is only reduced as draining increases (shown in Chart 5).
At site S4, metals such as Chromium, Nickel and Zinc were correlated with an increase in water flow, showing that these metals were taken to this site, because site S4 is located at downriver of site S3, as shown in Chart 6. This indicates that site S4 is undergoing the influence of the pollutant load typical of the previous site, which did not undergo changes in metals with regard to water flow, but the descriptive analysis showed that there was a great concentration of metals at this site.
4. Discussion
In terms of the management of the Sinos River, the results from this research are shown to be extremely important, because there is a clear degradation of the river over time, which implicates ensuring the conservation of this mineral resource, infringing what is recommended in Article 225 of the Brazilian Federal Constitution, (Brasil, 2008) which establishes that “everyone has the right to an ecologically balanced environment”.
Taking into account the perspective of the National Policy of Water Resources, since 1988, the Sinos River has been under the auspices of its River Basin Management Committee, COMITESINOS, which was the first state River Basin Management Committee to be implemented and whose policy develops actions to improve the conditions of the river, with the creation of River Basin Plans as a strategic tool for the care of this resource. This study aligns with this policy as it evaluates the quality of the water from this river, through the WQI and its parameters, in a historical perspective.
Through the analysis of the obtained results by the descriptive statistics of the parameters that make the WQI,
Chart 5. Correlation between WQI parameters and water flow at Site S3.
Parameters Correlation
Maximum CB Minimum CB Mean CB
BOD5 –0.342* –0.395** –0.424**
COD –0.211 –0.279* –0.313*
Chloride –0.598** –0.519** –0.640**
Conductivity –0.440** –0.347** –0.461**
Total Nitrogen –0.477** –0.498** –0.589**
Ammoniacal Nitrogen –0.381** –0.360** –0.419**
Dissolved Oxygen 0.300* 0.259* 0.367**
Surfactants –0.377** –0.238 –0.358**
Temperature –0.288* –0.312* –0.303*
*Significant Correlation at 0.05; **Significant Correlation at 0.01. CB = Campo Bom.
Chart 6. Correlation between WQI parameters and water flow at Site S4.
Parameters Correlation
Maximum SL Minimum SL Mean SL
Chloride –0.451** –0.513** –0.541**
Conductivity -0.224 –0.271* –0.267*
Ammoniacal Nitrogen –0.362** –0.403** –0.430**
Total Phosphorus -0.199 –0.291* –0.223
Total Solids –0.264* –0.254* –0.286*
Turbidity 0.173 0.183 0.269*
Dissolved Oxygen 0.254* 0.201 0.254*
Thermotolerant Coliforms (EC) 0.381** 0.157 0.324*
Temperature –0.339** –0.459** –0.407**
Chromium 0.583** 0.213 0.507*
Copper 0.864** 0.631** 0.797**
Nickel 0.966** 0.823** 0.919**
Zinc 0.554** 0.446** 0.611**
Braz. J. Biol., 2015, vol. 75, no. 2 (suppl.), p. S1-S10 9 Water quality of the Sinos River – Brazil
9 it was possible to highlight some important results. Among
these, it was possible to observe that the BOD5 presents the highest level between sites S3 and S4. It was possible to verify that in site S3, in relation to the maximum levels of the class III according to the CONAMA 357/05 resolution (Brasil, 2005), the BOD5 is proximal to the highest value for this class, being close to 9.2 mg/l, as the maximum level would be 10 mg/l. According to Macedo (2009), site S3 is near the draining sites of the streams Gauchinho, Luiz Rau, and Pampa, which have a high population concentration, with the release of almost untreated sewage, being a possible cause to the increase of BOD5. As for thermotolerant coliforms, this parameter also shows higher levels at site S3, which may be due to the lack of treatment of the sewage from the large cities around this site and, less significantly, due to the inappropriate management of stockbreeding activity (BLUME ET AL, 2010).
It was also possible to identify the presence of metals in the analyses of water samples, although being commonly found among sediments. It was possible to observe certain metals, such as zinc, from the river spring, and one of the hypotheses for the presence of this metal is that it is a component of the typical soil of this region. As stated by
Jorgensen, Tundisi and Tundisi (2012), due to variations in
soil composition and geology, some chemical components of the river vary according to regional characteristics.
Also, a study conducted by Robaina et al. (2002) on the Sinos River found that there are high levels of contamination by heavy metals, such as chromium, copper, zinc and lead, posing an extreme risk for the population that relies on this river. Roche and Boge (1996) reported that due to industrial production, a great part of the toxic waste is released to the surface waters, causing high concentrations of metals, which are ubiquitous contaminants in ecosystems. These metals in addition to the deterioration of the physical and chemical equilibrium of water, also interferes in the food chain leading to physiological and morphological changes.
Studies point out that the water quality conditions of the Sinos River are at worryingly low levels, reaffirming that this is one of the most polluted rivers in Brazil. This can also be identified through the WQI index as it represents, when analysed in a series, the evolution of water quality over time and space, according to Romeiro (2004). This index represents an efficient model for the follow-up and management of this river and demonstrates that at the S3 site, the quality of the water in every year stayed the same, and was considered “Poor”. This region is located at a very urbanised region that has great anthropic influence and is part of the Porto Alegre metropolitan area. Similarly, at site S4, which is also highly urbanised, it is observed that the water quality remained between “Medium” and “Poor”.
According to Macedo (2009) the indexes of water quality from Sinos River indicate that the decrease in water quality is associated with hydric pollution by non-treated domestic sewers. High values of thermotolerant coliforms reflect the great deficit in sanitation of the basin, mainly
in the middle and lower stretches, where the whole load of domestic sewer is received by the streams that flow into the Sinos River.
In general, is possible conclude that the sites S3 and S4 show the worst indicators over time, being that these sites are located in areas of high urban and industrial concentration. Although the sites S1 and S2 are located at rural areas or low urban concentration, these too demonstrate signs of degradation over time. This represents a very worrying profile in relation to the quality of the Sinos River water, where at site S1, which is considered one of the sources of the river; it is already possible to identify the impact of these anthropogenic activities.
One of the difficulties in the data analysis of water quality is the heterogeneity of the results due to changes in river basin conditions and in the frequency of collection over time. Because of that, one limitation of the study of the WQI series was the non-standardisation of the collections, creating gaps in the time series, which reduces the accuracy of the performed analysis. Other limitations were the lack of data of water flow on collections and the lack of data standardisation in analyses of water situation. According to Bollmann (2003), the main difficulties related to scale problems in time series are: changes in the object over time, changes in the measuring instruments, data representativeness, and disparity in sampling frequency.
Acknowledgements
We would like to thank FEPAM for the provided data that supported this study, and to Rio Grande do Sul State Research Support Agency (Fundação de Amparo à Pesquisa do Estado do Rio Grande do Sul, FAPERGS), the development agency that fostered the conduction of this project.
References
BLUME, KK., MACEDO, JC., MENEGUZZI, A., SILVA, LB., QUEVEDO, DM. and RODRIGUES, MAIS., 2010. Water quality assessment of the Sinos River, Southern Brazil. Brazilian Journal of Biology = Revista Brasileira de Biologia, vol. 70, supplement 4, p. 1185-1193.
BOLLMANN, HA., 2003. Avaliação da qualidade das águas em bacias hidrográficas urbanas. Curitiba: Sanepar/ Finep. 316 p.
Brasil. Conselho Nacional do Meio Ambiente – CONAMA, 2005. Resolução No 357, de 17 de março de 2005. Dispõe sobre a classificação dos corpos de água e diretrizes ambientais para o seu enquadramento, bem como estabelece as condições e padrões de lançamento de efluentes, e dá outras providências. Diário Oficial da União, Brasília, 18 mar., p. 58-63. Available from: http://www.mma.gov.br/port/conama/legiabre.cfm?codlegi=459. Access in: 27 Mar. 2012.
CHAPMAN, D., 1992. Water quality assessments - a guide to use of biota, sediments and water in environmental monitoring. Cambridge: UNESCO/WHO/UNEP. 651 p.
Instituto Internacional de Ecologia e Gerenciamento Ambiental – IIEGA, Secretaria Municipal do Verde e do Meio Ambiente – SVMA and Prefeitura Municial de São Paulo – PMSP, 2010. Manual de Gerenciamento de bacias hidrográficas. São Carlos: Cubo Multimídia. 127 p.
JORGENSEN, SE., TUNDISI, JG. and TUNDISI, TM., 2012. Handbook of Inland Aquatic Ecosystem Management. New York: CRC Press. 430 p.
MACEDO, JC., 2009. Monitoramento da qualidade das Águas do Rio do Sinos. Novo Hamburgo: Centro Universitário Feevale. Masters Dissertation.
NETER, J., KUTNER, MH.; NACHTSHEIM, CJ., LI, W., 1996. Applied linear statistical models. 5th ed. Boston: Mcgraw-Hill Irwin. 1396 p.
Rio Grande do Sul. Fundação Estadual de Proteção Ambiental Henrique Luiz Roessler – FEPAM., 2012. Qualidade das águas da bacia hidrográfica do Rio dos Sinos. Available from: http:// www.fepam.rs.gov.br/qualidade/qualidade_sinos/sinos.asp. Access in: 15 Jul. 2012.
ROBAINA, LE., FORMOSO, MLL. and PIRES, CAF., 2002. Metais pesados nos sedimentos de Corrente, como indicadores de risco ambiental – Vale dos Sinos RS. Revista do Instituto Geológico: São Paulo, vol. 23, no. 2, p. 35-47. http://dx.doi. org/10.5935/0100-929X.20020008.
ROCHE, H. and BOGE, G., 1996. Fish blood parameters as a potential tool for identification of stress caused by environmental factors and chemical intoxication. Marine Environmental Research, vol. 41, no. 1, p. 27-43. http://dx.doi.org/10.1016/0141-1136(95)00015-1.