1
PARRACHA JL, PEREIRA MFC, MAURÍCIO A, MACHADO JS, FARIA P, NUNES L. (2019), A semi-destructive assessment method to estimate the residual strength of maritime pine timber structural elements degraded by anobiids. Materials and
Structures 52, 54 (June 2019). https://doi.org/10.1617/s11527-019-1354-9
A semi-destructive assessment method to estimate the residual strength of
maritime pine structural elements degraded by anobiids
João L. Parrachaa,b, Manuel F.C. Pereirac, António Maurícioc, José Saporiti Machadob, Paulina
Fariaa,d, Lina Nunesb,e*
aDepartment of Civil Engineering, Faculty of Science and Technology, Universidade NOVA de Lisboa, 2829-516,
Caparica, Portugal.
bLNEC, National Laboratory for Civil Engineering, Structures Department, Av. do Brasil, 101, 1700-066, Lisbon,
Portugal.
cCERENA, Centro de Recursos Naturais e Ambiente, Instituto Superior Técnico, Universidade de Lisboa,
1049-001, Lisbon, Portugal.
dCERIS, Civil Engineering Research and Innovation for Sustainability, Instituto Superior Técnico, Universidade
de Lisboa, 1049-001, Lisbon, Portugal.
eCE3C, Centre for Ecology, Evolution and Environmental Changes, Azorean Biodiversity Group, Universidade dos Açores, 9700-042, Angra do Heroísmo, Açores, Portugal.
*Corresponding author: Dr. Lina Nunes; Address: LNEC, Av. do Brasil, 101, 1700-066, Lisbon, Portugal; Tel: +351.218443659; E-mail address: [email protected]
ABSTRACT
In this article, an assessment method to estimate the residual strength of pine structural elements
degraded by anobiids is presented. This novel method was developed in the laboratory to be
used in situ and is based on the strength required to withdraw a screw on the surface of degraded
micro-2
computed tomography (μ-XCT) to quantify density loss. This parameter is highly correlated
with mechanical properties thus central for the assessment of timber structural capacity. Density
loss values have been correlated with both screw withdrawal force and shear parallel to the
grain strength showing significant relationships between these parameters. Using these
correlations, the density loss of a degraded element and its shear strength parallel to the grain
via the screw withdrawal force can be estimated enabling a valid quantitative assessment of the
timber elements residual strength and, therefore, contributing to reduce unnecessary
replacement, to boost eco-efficient interventions and to provide foundations required to perform
experimental modelling tests.
Keywords: Timber; Anobiid infestation; Micro-computed tomography; Screw withdrawal; Damage assessment.
1. Introduction
Timber has been used in the construction industry over the years being known as one of the
oldest construction materials. In recent years, the importance of wood as a building material
has been strongly increasing, mostly not only owing to greater ecological awareness but also
due to the need to preserve historic structures. Meanwhile, the trend of mass timber construction
is spreading throughout the world showing the great potential of a rediscovered material.
However, the understanding and prediction of material durability and biodegradation process
incurred by these structures has been limited [1]. As all materials, timber is susceptible to
deterioration which is frequently caused by biological agents, namely fungi and insects. In
temperate countries, like Portugal and other Mediterranean countries, the insects that cause
most problems to timber structures are termites (Blattodea, Termitoidae) or wood boring beetles
3
deterioration problems of older or antique structures [2]. For Pinus species, these beetles’ attack
is normally limited to sapwood and the damaged caused is easily recognizable on the outside
from the size and the shape of the emergency holes and the type of frass [4].
When it comes to the assessment of degraded timber structures, the correct identification of the
responsible insects [5] as well as the degraded wood species [23] is essential to better set up
valid diagnosis and remediation strategies. This identification starts with a visual inspection of
the structure, which is also important to recognize the damage and to identify and map
susceptible zones [26]. Nevertheless, due to the diffuse damage created by these agents, with a
set of tunnels starting and developing in more or less random places and directions, the
assessment of the structural soundness of the remaining timber becomes more difficult [25].
The degraded members are commonly assessed as not having enough residual strength and thus
replaced [5]. However, it may happen that there is no need to remove and replace affected
structural elements since the structural safety is still guaranteed or can be achieved with
selective strengthening. Concerning structures of historical relevance, the replacement
approach is not ideal since it is frequently very difficult to remove and replace by similar timber
the structural degraded elements without cultural loss. In this case, typically, the effect of
anobiids attack is considered by assuming a significantly reduced timber cross section or
reduced mechanical properties for that cross sections [6]. The structural capacity of the timber
member is subsequently reduced with the reduced cross section. This may although be too
conservative, as even insect damaged-layer can often be able to resist load. In this respect a
more accurate quantification of deterioration level attained by a timber member could be used
while performing reliability analysis of timber members or structures subjected to anobiids’ attack, similar to studies already involving decay [24].
Several studies have been made [6-8] with the objective to quantify the impact of anobiids
4
beetles). However, the degradation intensity on the structure was mostly inferred from an
examination of the surface appearance. This approach is not completely representative of the
real degradation state as the intensity of the internal holes tends to be much greater than that on
the surface [7]. Then, it is important to know the percentage of lost material as well as the loss
of density, in order to conclude on structural safety. A measure of density loss is of paramount
importance to assess timber soundness as it is highly correlated with mechanical properties of
timber.
The main objective of the research here reported in this article was to develop a method for an
in situ assessment of infested timber structural elements based on a screw withdrawal test. The
screw withdrawal test is a semi-destructive test (SDT) that can be performed in situ on the
surface but also at varying depths into the timber element for the evaluation of its remaining
quality [9, 10]. Current in situ assessment tests are limited. The method was developed in the
laboratory though it was important that the technique could be used expediently on the
laboratory environment as well as in situ. Micro-computed tomography (μ-XCT) was used to
visualize the tunneling and calculate the voids’ volume due to lost material consumed by beetles
[11]. By knowing this percentage of lost material, the loss of density can be estimated. This
way, a correlation was established between screw withdrawal force values and the loss of
density. Then, the loss of density was correlated with the loss of mechanical properties via shear
parallel to the grain tests in order to conclude on structural elements residual strength.
The correlations obtained are intended to be used in combination with information provided by
other non-destructive (NDT) and semi-destructive (SDT) tests for predicting the mechanical
properties of the “remaining” timber structural members in service [12].
5
2.1. Sampling
Timber samples used in this study came from a beam of maritime pine (Pinus pinaster Aiton)
retrieved from a mid 20th century roof structure of a residential building located in Lisbon,
Portugal. Maritime pine continues to be one of the major sources of wood raw material in
Portugal. The beam presented varying degrees of infestation mainly caused by insects
belonging to the Anobiidae family. Frass characteristics, size of tunnels and the presence of
cocoons inside the wood allowed the identification of Nicobium castaneum Olivier has the main
species responsible for the degradation, although the presence of other anobiid species cannot
be excluded.
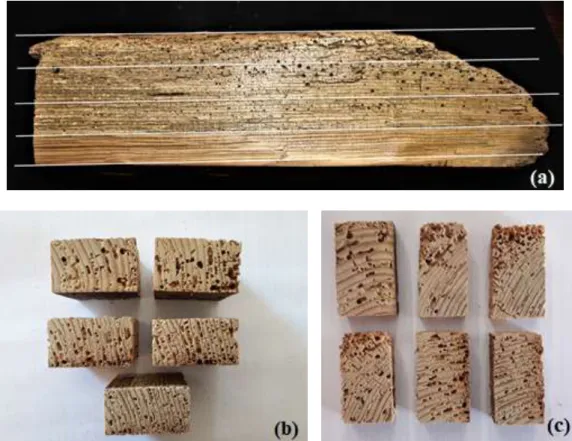
After insect identification, the beam was divided in 4 parts (3 parts with degradation and the
heartwood) (Figure 1a). Then, four screw withdrawal tests were performed at four different
places of the beam before the first cutting process (see Section 2.4 for further details). After the
screw withdrawal tests, 17 samples were cut from the beam and each was approximately
40 × 20 × 40 mm3 (Figure 1b). Next, these 17 samples were cross cut to produce 17 “new” paired samples with 40 × 20 × 10 mm3 (Figure 1c), that later were submitted to μ-XCT. Samples with approximate dimensions of 40 × 20 × 30 mm3 resulting from the cutting process were later used for shear parallel to the grain test.
All the 34 samples were conditioned in a climatic room at a temperature of 20 ± 2℃ and a relative humidity of 65 ± 5% and maintained in this condition until required for mechanical testing or μ-XCT scanning procedure [13].
6
Fig. 1 Sampling: (a) timber beam indicating segments; (b) some of the 17 samples resulting from the first cut of the beam (samples approximately 40 × 20 × 40 mm3); (c) some of the 17 “new” paired samples resulting from the second cutting process (samples approximately 40 × 20 × 10 mm3).
2.2. Micro-computed tomography study
Micro-computed tomography (μ-XCT) was used as a 3D microscope to visualize the tunnelling
formed by anobiids and to quantify voids volume (lost material percentage). The μ-XCT
methodology consists of the following major steps: 1) sample preparation; 2) acquisition
process; 3) reconstruction process; 4) rendering; 5) analysis of the results (quantification) and
6) interpretation.
The samples were imaged using an X-ray μ-XCT scanner Skyscan 1172 (Bruker Instruments,
Inc., Billerica, Massachusetts). The parameters used in the scanning procedure (acquisition)
7
for the selected samples and the required output parameters (wood and voids). These parameters
were applied to the study of all samples. The voltage selected for the X-ray source was 60 kV
and an aluminium filter with a tick of 0.5 mm was used. The X-ray source was operated at 165
μA and the samples were imaged through 180 degrees of rotation at 0.7 degree increment’ steps. The total acquisition time for each sample was approximately 1.5 h with a total of 288 acquired
images.
Then, the collected images were processed through reconstruction process using NRecon
software, provided by Bruker. Finally, the analysis process to obtain quantitative information
(parameters of interest) was conducted using CTAn software, provided by Bruker, and ImageJ
software (https://imagej.nih.gov/ij/), provided by NIH. The output parameters are exported
from CTAn software in a form of a txt file. In this file, among the various output parameters
values that can be estimated, two of them can highlight: tissue volume, referring to the volume
of the sample (wood and voids) and bone volume, relating to the wood itself (skeleton). The
terms came from the fact that this technique has been extensively used in medicine to study
human bones [27, 28], with the achievement of very positive results and with the definition of
protocols/guidelines that can be used in the study of different materials where this
non-destructive analysis is warranted. In the case of wood, several studies have been carried out
recently. Fuchs et al. [29] and Himmi et al. [30] used CT to detect termite or beetle damage in
wood. Watanabe et al. [31] used X-ray CT to observe the boring process inside infested bamboo
specimens while Charles et al. [32] used CT to quantify voids created by shipworms. The output
parameters correspond to those of interest previously defined, as voids volume will correspond
to the difference between total volume and wood volume. Wood density was assessed at 12%
moisture content according to ISO 13061-1 [14]. Original density is obtained by Equation 1.
𝜌𝑜𝑟𝑖𝑔𝑖𝑛𝑎𝑙 = 𝑚
𝑏𝑣 (1)
8 𝜌𝑟𝑒𝑠𝑖𝑑𝑢𝑎𝑙 = 𝑚
𝑡𝑣 (2)
In Equations 1 and 2, 𝑚 indicates the sample weigh, in kg and 𝑤𝑣 and 𝑡𝑣, in m3, represent the bone volume and the tissue volume, respectively.
2.3. Screw withdrawal perpendicular to grain
Screw withdrawal tests (Figure 2) were carried out taking into account the method specified in
the standard EN 1382 [15] and were conducted in a universal testing machine (Schimadzu
AG-250KNIS-MO), capable of measuring the load applied with an accuracy of 1% in the range 1kN
to 250kN. The tests were performed before the beam is cut and, in an attempt, to simulate an in
situ assessment test. A metal screw with an outer diameter of 6 mm and a length of 60 mm was
used. The screw was inserted in the direction perpendicular to the grain and no distinction was
made between the radial and the tangential directions since the results do not differ significantly
[7].
9
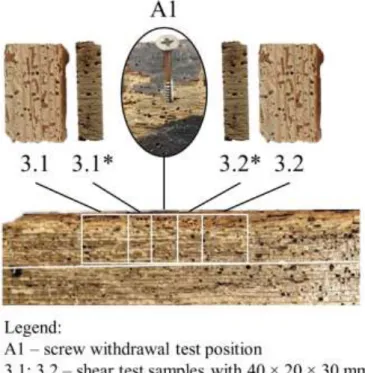
In this study, four screw withdrawal tests were performed at four different places of the beam
before the first cutting process. The tests were carried out in an attempt to reproduce in situ
conditions since the final objective of this research study is to enable the use of this
semi-destructive tests to estimate the loss of density due to anobiids infestation in existing timber
structures. Before measurements, a pre-drilled hole of 4 mm in diameter was made and the
penetration length of the screws was 20 mm to enable a comparative profile of strengths at a
range of depths. The samples that were submitted to μ-XCT and those that were tested to shear
parallel to the grain, due to their relatively small size, cannot be submitted to a semi-destructive
test such as is the case of the screw withdrawal test. Therefore, the timber places along the beam
where the screw withdrawal test was performed were not used in samples that would be
submitted to μ-XCT scanning procedure or shear tests. To better understand this scenario,
Figure 2 presents a schematic representation for the screw withdrawal tests. Four tests (A1, A2,
A3 and A4) were performed at four different places along the beam. To obtain a correlation
between the density and the screw withdrawal force, for example for the test A1, the arithmetic
average of the estimated densities for test samples 3.1* and 3.2* was used.
2.4. Shear parallel to grain
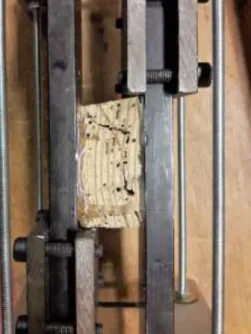
The shear tests (Figure 3) were performed according to EN 408 [13] and were conducted under
deformation-control at a rate of 1 mm min-1 in a universal testing machine (Schimadzu), with a
load cell of 250 kN. The machine is able to measure the applied load with an accuracy of 1%
in the range of 1 kN to 250 kN. Shear strength parallel to the grain corresponded to the
maximum load attained on 40 × 20 × 30 mm3. The load was applied at a constant rate so that the maximum load was attained in the interval 300 ± 120 seconds. This test consists of the gluing of two steel plates to the two opposite faces of the test samples (Figure 3). Then, the load
10
is applied, and the failure must occur by the timber test sample and not by the glue. The angle
between the load direction and the longitudinal axis of the test sample shall be 14°.
Shear parallel to the grain strength was obtained by Equation 4.
𝑓𝑣 =𝐹𝑚𝑎𝑥 × cos (14°)
𝑙 × 𝑏 (4)
in which 𝑓𝑣 is the shear strength parallel to the grain (N/mm2), 𝐹𝑚𝑎𝑥 is the maximum shear load (N) and 𝑙 × 𝑏 is the influence area (mm2). The test was performed in nine samples (three samples for each three proposed degradation level). The glue used in these tests was an epoxy
glue Araldite® with a maximum tension strength of 320 kg/cm2 in 48 hours.
3. Test results
3.1. Micro-computed tomography
During the analysis process step of the μ-XCT methodology, three more or less generalized
image processing algorithms were defined for the segmentation process of the
three-dimensional objects. The choice of the parameters used for the definition of such algorithms is
of paramount importance since the accuracy of the estimated results (wood and voids) is
strongly dependent on the quality and robustness of the segmentation process [17]. Details of
this work, with fully description of the various steps adopted during the entire μ-XCT study,
have been reported elsewhere [11].
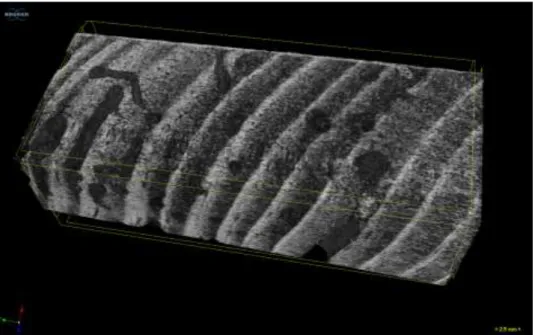
After the reconstruction process, it is possible to visualize the acquired reconstructed-rendered
object model perspective images using a visualization program (i.e. CTVox software, provided
by Bruker) (Figure 3). This visualization is very important during the μ-XCT study. The final
11
procedure. This volume must be compared with the first object acquired (after the
reconstruction process) to ensure that the study was not misrepresented during the application
of the various μ-XCT methodology inherent steps.
Fig. 3 Reconstructed and rendered 3D object. Rendered model perspective visualization using CTVox software.
The samples are distributed over three levels of degradation: level 1 (< 10% lost material); level
2 (10 to 20% of lost material); level 3 (>20% lost material) based on the results obtained from
the micro-tomographic study [11]. A Shapiro-Wilk test has confirmed the normality of the
results (p-value = 0.276). In table 1 the obtained results are shown.
Table 1 Output parameters’ values, sample weigh and apparent densities (original and residual) per level of degradation.
Average values Level of degradation Number of samples Total volume Wood volume Lost material Weigh "Original" density "Residual" density Loss of density cm3 cm3 % g kg/m3 kg/m3 % 1 5 8.642 7.850 9.12 4.545 582 529 9.2 2 7 7.836 6.648 15.16 3.449 517 439 15.3
12
3 5 7.427 5.679 23.54 2.720 495 386 21.9
The obtained results for apparent densities (original and residual) decrease with increasing
percentage of lost material, as expected. With regards to the proposed level definition, the
highest density loss occurred for level 3, with a loss of 21.9±1.4%. For levels 1 and 2, the loss
of density was 9.2±0.64% and 15.3±3.5%, respectively. Considering all samples, it was
obtained an average loss of density of 80±24 kg/m3 (15.4±5.5%), an average original theoretical
density of 529±53 kg/m3 and an average residual density of 449±70 kg/m3.
The obtained results indicate a medium correlation (r2 = 0.60) between lost material percentage and original timber density, which becomes higher (r2 = 0.83) when comparing lost material percentage and residual density. The results show that the higher the density, the
lower the percentage of lost material, as expected. The obtained results suggest it is very likely
that timber density is a determinant of the quality of timber but also supports the claim that
μ-XCT methodology was well applied in this research study.
3.2. Screw withdrawal perpendicular to grain
Table 2 presents the results obtained for screw withdrawal tests, where CV is the coefficient of
variation.
Table 2 Screw withdrawal results.
Parameter
Values
Average (μ) Minimum Maximum Standard deviation (σ) C.V (%)
Fmáx kN 0.46 0.28 0.69 0.19
41.7
f N/mm2 6.62 3.99 9.86 2.76
The average results obtained are lower than those observed in previous studies [7, 8]. However,
13
values of C.V are relatively large which can be explained by the differences found in the level
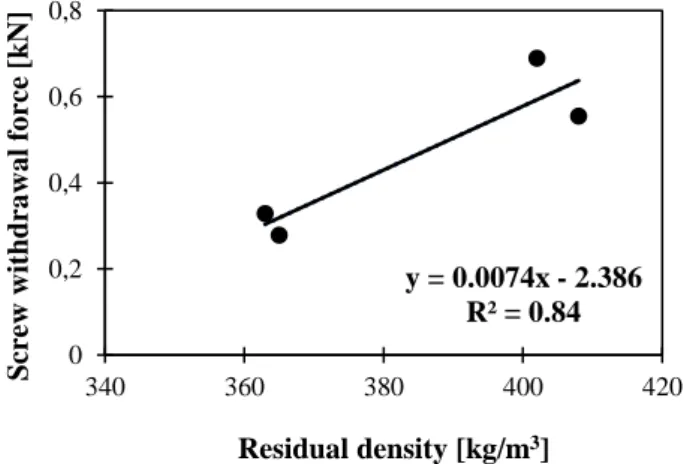
of degradation along the beam. Figures 4 and 5 show the obtained correlations between
densities (original and residual) and the screw withdrawal forces. It should be noted that the
four places along the beam where the screw withdrawal tests were performed, were not
submitted to μ-XCT or shear tests, as previously stated. So, the real density values for that
particular test places are still unknown. This, however, is not a substantial problem, since the
values used in the correlations of Figures 5 and 6 are those that have been estimated for the
samples near the screw withdrawal test site.
Fig. 4 Correlations between screw withdrawal force and original apparent density.
Fig. 5 Correlations between screw withdrawal force and residual apparent density. y = 0.0054x - 2.186 R² = 0.80 0 0,2 0,4 0,6 0,8 440 460 480 500 520 540 Scre w w it hd ra w a l f o rc e [k N] Original density [kg/m3] y = 0.0074x - 2.386 R² = 0.84 0 0,2 0,4 0,6 0,8 340 360 380 400 420 Scre w w it hd ra w a l fo rc e [k N] Residual density [kg/m3]
14
The results show a high correlation (r2 = 0.80) for original density and an even higher correlation (𝑟2 = 0.84) for residual density. As is to be expected, higher values of density lead to greater values of screw withdrawal forces.
3.3. Shear parallel to grain
Table 3 shows the results obtained for shear parallel to the grain tests.
Table 3 Shear parallel to the grain results.
Parameter
Values
Average (μ) Minimum Maximum Standard deviation (σ) C.V (%)
Fmáx kN 1.3 0.5 2.3 0.54
40.9
𝒇𝒗 N/mm2 2.4 0.8 4.3 1.11
Figures 6 and 7 present the obtained correlations between densities (original and residual) and
the shear strength. The values of C.V are relatively large which can be explained by the spatial
variation of the properties of the timber element, namely concerning the differences found in
the level of degradation (expressed in terms of lost material percentage) along the beam, that
ranges between 9.2% for the first level of degradation and 21.9% for the third level of
degradation. This figure indicates a medium correlation (r2 = 0.75) for original density and a high correlation (r2 = 0.82) for residual density. These coefficients of determination suggest that the shear parallel to the grain test applied on timber degraded by anobiids can be likely to
be quite explanatory of the behaviour of the material at breaking. This is because the tunnels
formed by beetles are preferentially formed in the early wood and tend to progress tangent to
adjacent late wood [8]. It is in this direction and in zones with greater concentration of tunnels
that the material has a greater tendency to break (Figure 8). The samples crushed easily realising
15
Fig. 6 Correlations between shear strength and original apparent density.
Fig. 7 Correlations between shear strength and residual apparent density.
Fig. 8 Rupture of a sample by shear test.
y = 0.0202x - 8.24 R² = 0.75 0 1 2 3 4 5 450 500 550 600 650 Sh ea r st re ng th [ M P a ] Original density [kg/m³] y = 0.0146x - 4.13 R² = 0.82 0 1 2 3 4 5 350 400 450 500 550 600 Sh ea r st re ng th [ M P a ] Residual density [kg/m³]
16
4. Description of the semi-destructive assessment method proposed
The proposed procedure applies the concept introduced by Gilfillan and Gilbert [7], however
with some changes. The method is based on the maximum force required to withdraw a screw
which is inserted on the timber’ surface in a direction perpendicular to the grain. No distinction
was made between the radial and the tangential directions since the results are not expected to
differ significantly [7].
Gilfillan and Gilbert [7] proposed a technique to measure the residual strength of woodworm
infested timber based on an in situ test of screw withdrawal that can be performed on timber’
surface but also at varying depths into the timber. These researchers obtained two significant
correlations: one between screw withdrawal force and compression strength and the other
between screw withdrawal force and compression stress. They also tried to simulate the
infestation effect in samples of new and old sound timber with the final objective of introducing
additional degradation effects and contribute for an easier assessment. Nevertheless, the study
of simulated boring effect was inconclusive since there is not a clear correlation between the
area of the emergence holes at exposed surfaces and the wood specimens’ strength. This fact leads us to the conclusion that the degradation inside timber tends to be much greater than that
estimated considering voids’ surface grades. Thus, the need to estimate the lost material percentage or loss of density using a non-destructive structural evaluation leading technique
such as micro-computed tomography. Therefore, the loss of density is paramount to know the
level of deterioration and the real impact of this on the structure as it is highly correlated with
the mechanical properties of timber.
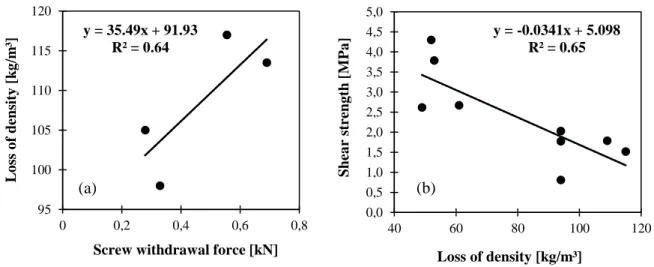
In this article, two relationships estimated for deteriorated timber elements are shown. These
correlations can be used to estimate density loss of degraded maritime pine elements (Figure
9a) and its associated shear strength parallel to the grain (Figure 9b) via the maximum screw
17
Fig. 9. Correlations between loss of density and screw withdrawal force (a) and shear strength and loss of density (b).
The procedure, based on laboratory tests, can be briefly summarised in the following steps:
1. Preliminary visual inspection of each timber member for the identification of the most
degraded zones and to identify the presence of defects (knots, fissures, slope of the grain).
The in situ visual inspection is recognised by several authors as the first step for the
assessment of a timber structure [5, 18, 19]. Italian standard UNI 11119 [20] refers to the
principles that must be applied during the inspection procedure as well as the necessary
conditions for such diagnosis inspection. The screw withdrawal test should not be
performed in places where the presence of defects was detected. The results will be
affected by the presence of such defects (i.e. when the screw is in or around knots, the
provided results will be higher) [10].
2. Identification of the screw withdrawal test positions. Screw withdrawal test provide a
local parameter, so tests must be applied to multiple locations, and the average result
should be used to estimate member properties [9]. As it can be seen through analysis of
the results of lost material percentage, there is a clear indication that the effect of
deterioration decreases with the distance from the surface. Nevertheless, this fact does not y = 35.49x + 91.93 R² = 0.64 95 100 105 110 115 120 0 0,2 0,4 0,6 0,8 L o ss o f dens it y [ k g /m ³]
Screw withdrawal force [kN]
y = -0.0341x + 5.098 R² = 0.65 0,0 0,5 1,0 1,5 2,0 2,5 3,0 3,5 4,0 4,5 5,0 40 60 80 100 120 S h ea r st reng th [ M Pa ] Loss of density [kg/m³] (a) (b)
18
affect the method application. If the structure has historic interest, the application of screw
withdrawal test to multiple locations can be difficult to perform because the damage to
the structure must be kept to a minimum. This fact reinforces the importance of the visual
inspection (point 1).
3. During the performance of the screw withdrawal test, the type of screw, the outer diameter
of that screw, the penetration length, the penetration direction and the pre-drilling have to
be checked. The results of the present research are only applied if the setup conditions
described in section 2.4 are followed. Any change in the application of the technique will
lead to the production of anomalous results. Using the correlations of Figure 9a, it is
possible to estimate density loss (due to the degradation caused by anobiids) as a function
of the screw withdrawal force.
4. Once the loss of density is obtained can be correlated with shear strength parallel to the
grain using the correlations present on Figure 9b . This parameter can be also correlated
with other mechanical properties of timber using relationships proposed in other studies
[21, 22]. At the end it can be concluded on the residual resistance of the wood layers
affected by anobiids’ attack and thus a more reliable safety and serviceability assessment
could be carried out. In fact, methods as the one explored in the present paper could
provide information on the loss of cross-section (scheme generally followed by decay
model [24]) but also on the degree of residual resistance that could be allocated to different
wood layers (depth profile).
5. Conclusions
A novel method for evaluating the impact of anobiid damage on timber structures is presented.
It is based in four major steps: visual inspection of each deteriorated timber member;
19
using equation 5 to estimate the loss of density; using equation 6 to predict shear strength
parallel to the grain and thus to conclude on the residual resistance.
Although good results were obtained for degraded timber elements, the method was developed
in laboratory though it is important that the technique can be used in situ. For this purpose, the
experimental work now needs to be extended using portable devices available to measure screw
withdrawal resistance and performing a larger number of measurements. When in situ, the
screws should be pulled slowly and steadily, according to the methods used on laboratory. This
extension is also important to the validation of the proposed method, as well as to estimate and
verify valid correlations for other species. With the validation of the proposed method and
knowing the loss of density caused by anobiids’ infestation, further qualitative/quantitative parameterization assessment with statistical validation can be a next step.
Conflict of interest
The authors declare no conflict of interest.
Acknowledgements
The authors gratefully acknowledge the support given by the Portuguese Foundation for
Science and Technology (FCT) within research projects: PTDC/ECM-EST/1072/2014
(ProTimber - Probabilistic assessment of existing timber structures),
PTDC/EPH-PAT/4684/2014 (DB-HERITAGE Database of building materials with historical and heritage
interest) and PEst-OE/CTE/UI4028/2011(CERENA).
The authors would like to thank Dr. Sónia Duarte from National Laboratory for Civil
20
References
[1] Wang JY, Stirling R, Morris PI, Taylor A, Lloyd J, Kirker G, Lebow S, Mankowski ME
(2018) Durability of mass timber structures: A review of the biological risks. Wood and
Fiber Science 50:110-127
[2] Eaton RA, Hale MDC (1993) Wood: decay, pests and protection. Chapmman & Hall,
London, UK, 546 p.
[4] Bravery AF, Berry RW, Carey JK, Cooper DE (1992) Recognising wood rot and insects
damage in buildings. Building Research Establishment, Garston, UK, 114 p.
[5] Cruz H, Yeomans D, Tsakanika E, Macchioni N, Jorissen A, Touza M, Mannucci M,
Lourenço PB (2015) Guidelines for on-site assessment of historic timber structures.
International Journal of Architectural Heritage 9(3): 277-289.
https://doi.org/10.1080/15583058.2013.774070
[6] Cruz H, Machado JS (2013) Effects of beetle attack on the bending and compression
strength properties of pine wood. Advanced Materials Research 778:145-151.
https://doi.org/10.4028/www.scientific.net/AMR.778.145
[7] Gilfillan JR, Gilbert SG (2001) Development of a technique to measure the residual strength
of woodworm infested timber. Construction and Building Materials 15:381-388.
https://doi.org/10.1016/S0950-0618(01)00004-6
[8] Nunes L, Parracha JL, Faria P, Palma P, Pereira MFC, Maurício A (2019) Towards an
assessment tool of anobiid damage of pine timber structures. In: IABSE Symposium –
Towards a resilient build environment risk and asset management. Guimarães, Portugal
[9] Tannert T, Anthony R, Kasal B, Kloiber M, Piazza M, Riggio M, Rinn F, Widmann R,
Yamagushi N (2014) In situ assessment of structural timber using semi-destructive
techniques. Materials and Structures 47:767-785.
21
[10] Kloiber M, Drdácký M, Machado JS, Piazza M, Yamagushi N (2015) Prediction of
mechanical properties by means of semi-destructive methods: A review. Construction and
Building Materials 101:1215-1234. https://doi.org/10.1016/j.conbuildmat.2015.05.134
[11] Parracha JL, Maurício A, Pereira MFC, Faria P, Nunes L. Evaluating anobiid deterioration
in maritime pine timber using micro-computed tomography (Article submitted to
Microscopy and Microanalysis)
[12] Brites R, Lourenço PB, Machado JS (2012) A semi-destructive tension method for
evaluating the strength and stiffness of clear wood zones of structural timber elements
in-service. Construction and Building Materials 34:136-144.
https://doi.org/10.1016/j.conbuildmat.2012.02.041
[13] EN 408:2010. Timber structures – Structural timber and glued laminated timber –
Determination of some physical and mechanical properties. European Committee for
Standardization, Brussels
[14] ISO 13061-1:2014. Physical and mechanical properties of wood – Test methods for small
clear wood specimens – Part 1: Determination of moisture content for physical and
mechanical tests, International Organization for Standardization, Genève
[15] EN 1382:2000. Timber structures – Test methods: Withdrawal capacity of timber
fasteners. European Committee for Standardization, Brussels
[17] Maurício A, Figueiredo C, Pereira MFC, Bergounioux M, Rozenbaum O (2015)
Assessment of stone heritage decay by X-ray computed microtomography: II – a case of
study of Portuguese limestones. Microscopy and Microanalysis 21(6):162-163.
https://doi.org/10.1017/S1431927614014512
[18] Kasal B, Anthony RW (2002) Advances in situ evaluation of timber structures. Progress
22
[19] Feio A, Machado JS (2015) In-situ assessment of timber structural elements: Combining
information from visual strength grading and NDT/SDT methods – A review.
Construction and Building Materials 101:1157-1165.
https://doi.org/10.1016/j.conbuildmat.2015.05.123
[20] UNI 11119:2004. Cultural heritage – Wooden artefacts. Load-bearing structures. On site
inspections for the diagnosis of timber members. Ente Nazionale Italiano di Unificazione,
Rome
[21] Morales Conde MJ, Rodríguez Liñán C., Rubio de Hita P (2014) Use of ultrasound as a
nondestructive evaluation technique for sustainable interventions on wooden structures.
Building and Environment 82:247-257. https://doi.org/10.1016/j.buildenv.2014.07.022.
[22] Yamaguchi N, Nakao M (2015) In-situ assessment method for timbers based on shear
strengths predicted with screw withdrawals. Wiadomosci Konserwatorskie – Journal of
Heritage Conservation 44:109-115, https://doi.org/10.17425/WK43ASSESSMENT
[23] Saporiti Machado J, Pereira F, Quilhó T (2019) Assessment of old timber members:
Importance of wood species identification and direct tensile test information.
Construction and Building Materials 207:651-660,
https://doi.org/10.1016/j.conbuildmat.2019.02.168
[24] Brites RD, Neves LC, Machado JS, Lourenço PB, Sousa H (2013) Reliability analysis of
a timber truss system subjected to decay. Engineering Structures 46:184-192,
http://dx.doi.org/10.1016/j.engstruct.2012.07.022
[25] Reinprecht L (2016) Wood deterioration, protection and maintenance. John Wiley & Sons,
Ltd, Chichester, UK, 357 p.
[26] Reinprecht L (2016) Diagnosis, sterilization and restoration of damaged timber structures.
23
[27] Campbell GM, Sophocleous A (2014) Quantitative analysis of bone and soft issue by
micro-computed tomography: applications to ex vivo and in vivo studies. BoneKEY
Reports 3:564. https://dx.doi.org/10.1038/bonekey.2014.59
[28] Parkinson IH, Badiei A, Fazzalari NL (2008) Variation in segmentation of bone from
micro-CT imaging: implications for quantitative morphometric analysis. Australian
Physics & Engineering Sciences in Medicine 31:160-164.
https://doi.org/10.1007/BF03178592
[29] Fuchs A, Schreyer A, Feuerbach S, Korb J (2004) A new technique for termite monitoring
using computer tomography and endoscopy. International Journal Pest Management
50:63-66. https://doi.org/10.1080/0967087032000159300
[30] Himmi SK, Yoshimura T, Yanase Y, Oya M, Torigoe T, Imazu S (2014) X-ray tomography
analysis of the initial structure of the royal chamber and the nest-founding behaviour of
the drywood termite Incisitermes minor. Journal of Wood Science 60:453-460.
https://doi.org/10.1007/s10086-014-1427-x
[31] Watanabe H, Yanase Y, Fujii Y (2015) Evaluation of larval growth process and bamboo
consumption of the bamboo powder-post beetle Dinoderus minutus X-ray computed
tomography. Journal of Wood Science 61:171-177.
https://doi.org/10.1007/s10086-014-1458-3
[32] Charles F, Coston-Guarini J, Guarini J, Lantoine F (2018) It’s what’s inside that counts:
computer-aided tomography for evaluating the rate and extent of wood consumption by