University Institute of Lisbon
Department of Information Science and TechnologyAutomatization of Incident Categorization
Sara Alexandra Teixeira da Silva
A Dissertation presented in partial fulfillment of the Requirements
for the Degree of
Master in Computer Engineering
Supervisor
Rúben Filipe de Sousa Pereira, Assistant Professor, PhD ISCTE-IUL
Co-Supervisor
Ricardo Daniel Santos Faro Marques Ribeiro, Assistant Professor, PhD ISCTE-IUL
iii
Resumo
De forma a acompanhar o crescimento da quantidade de incidentes criados no dia-a-dia de uma organização, houve a necessidade de aumentar a quantidade de recursos, de maneira a assegurar a gestão de todos os incidentes. A gestão de incidentes é composta por várias atividades, sendo uma delas, a categorização de incidentes. Através da junção de técnicas de Linguagem Natural e Processamento de Texto e de Algoritmos de Aprendizagem Automática propomos melhorar esta atividade, especificamente o Processo de Gestão de Incidentes. Para tal, propomos a substituição do subprocesso manual de Categorização inerente ao Processo de Gestão de Incidentes por um subprocesso automatizado, sem qualquer interação humana.
A dissertação tem como objetivo propor uma solução para categorizar corretamente e automaticamente incidentes. Para tal, temos dados reais de uma organização, que devido a questões de privacidade não será mencionada ao longo da dissertação. Os datasets são compostos por incidentes corretamente categorizados o que nos leva a aplicar algoritmos de aprendizagem supervisionada. Pretendemos ter como resultado final um método desenvolvido através da junção das diferentes técnicas de Linguagem Natural e dos algoritmos com melhor performance para classificar os dados. No final será avaliado o método proposto comparativamente à categorização que é realizada atualmente, de modo a concluir se a nossa proposta realmente melhora o Processo de Gestão de Incidentes e quais são as vantagens trazidas pela automatização.
Palavras-chave
: Aprendizagem Automática, Classificação Automática de Incidentes, Classificação de Incidentes, Linguagem Natural, Processo de Gestão de Incidentes, Processamento de Texto.v
Abstract
To be able to keep up with the grow of the created incidents quantity in an organization nowadays, there was the need to increase the resources to ensure the management of all incidents. Incident Management is composed by several activities, being one of them, Incident Categorization. Merging Natural Language and Text Mining techniques and Machine Learning algorithms, we propose improve this activity, specifically the Incident Management Process. For that, we propose replace the manual sub-process of Categorization inherent to the Incident Management Process by an automatic sub-process, without any human interaction.
The goal of this dissertation is to propose a solution to categorize correctly and automatically the incidents. For that, there are real data provided by a company, which due to privacy questions will not be mention along dissertation. The datasets are composed by incidents correctly categorized, which leverage us to apply supervised learning algorithms. It is supposed to obtain as output a developed method through the merge of Natural Language Processing techniques and classification algorithms with better performance on the data. At the end, the proposed method is assessed comparatively with the current categorization done to conclude if our proposal really improves the Incident Management Process and which are the advantages brought by the automation.
Key-words:
Automated Incident Categorization, Incident Categorization, Incident Management Process, Machine Learning, Natural Language,Text Mining.vii
Acknowledgements
I would like to express my sincere gratitude to my Professors Rúben Pereira and Ricardo Ribeiro for all the support that they gave me and for everything I learned along this journey. Finally, I am grateful to my parents, sister and friends, without them my whole academic path wouldn’t have been possible.
ix
Contents
RESUMO ... III ABSTRACT ... V ACKNOWLEDGEMENTS ... VII LIST OF TABLES ... XI LIST OF FIGURES ... XIII1 INTRODUCTION... 1
1.1 MOTIVATION AND RESEARCH CONTEXT ... 2
1.2 RESEARCH METHODOLOGY ... 3
1.2.1 Identify Problem and Motivate ... 4
1.2.2 Define Objectives for a Solution ... 5
1.2.3 Design ... 5
1.2.4 Development and Demonstration ... 8
1.2.5 Evaluation and Communication ... 9
1.3 DOCUMENT STRUCTURE ... 9
2 THEORETICAL BACKGROUND AND RELATED WORK... 11
2.1 INCIDENT MANAGEMENT AND INCIDENT CATEGORIZATION ... 11
2.2 TEXT MINING AND TEXT CATEGORIZATION ... 13
2.2.1 Text Pre-processing and Feature Selection ... 14
2.2.2 Cross-Validation Model ... 15
2.2.3 Classifiers ... 15
2.3 EVALUATION ... 17
2.4 TEXT CATEGORIZATION APPLICATIONS IN INCIDENT CATEGORIZATION ... 18
3 DESIGN ... 22
3.1 ATTRIBUTES DETERMINATION ... 24
3.2 TEXT PRE-PROCESSING ... 26
x
3.4 SECOND LEVEL CATEGORIZATION ... 27
4 DEVELOPMENT AND DEMONSTRATION ... 29
4.1 ATTRIBUTES DETERMINATION ... 29
4.2 FIRST LEVEL –CATEGORIES ... 36
4.2.1 Support Vector Machine ... 36
4.2.2 K-Nearest Neighbors ... 39
4.2.3 Iterative Dichotomiser 3 ... 41
4.2.4 Naïve Bayes ... 42
4.2.5 Overall Results ... 44
4.3 SECOND LEVEL –SUBCATEGORIES ... 45
4.3.1 First Approach – Data with assigned category ... 45
4.3.2 Second Approach – Data divided in 10 datasets ... 46
4.3.3 Third Approach – Data with no assigned category ... 47
4.3.4 Overall Results ... 48
5 EVALUATION ... 50
5.1 RECATEGORIZATION ANALYSIS ... 51
5.2 FIRST AND SECOND LEVEL ANALYSIS ... 53
6 CONCLUSION ... 56
6.1 RESEARCH QUESTIONS ANALYSIS ... 57
6.2 LIMITATIONS ... 58
xi
List of Tables
Table 1.1: Number of incidents per category and subcategory ... 7
Table 2.1: Incident Management Process Activities ... 12
Table 2.2: Comparison of similar studies ... 21
Table 3.1: Incident ticket example ... 25
Table 4.1: Precision and Recall of nominal attributes vs full description vs short description using SVM ... 32
Table 4.2: Precision and Recall of nominal attributes vs full description vs short description using KNN ... 33
Table 4.3: Results with SVM and KNN ... 34
Table 4.4: SVM vs KNN using nominal attributes and the short description ... 35
Table 4.5: Results of Alphabetic tokenizer vs Word tokenizer with SVM ... 37
Table 4.6: Results of IDF, TF, TFxIDF with SVM ... 38
Table 4.7: Results of Word Tokenizer vs Alphabetic Tokenizer with KNN ... 40
Table 4.8: Results of IDF, TF, TFxIDF with KNN ... 40
Table 4.9: Results of Word Tokenizer vs Alphabetic Tokenizer ... 41
Table 4.10: Results of TF vs IDF vs TFxIDF... 42
Table 4.11: Results of Alphabetic Tokenizer vs Word Tokenizer using NB ... 43
Table 4.12: Results of TF vs IDF vs TFxIDF using NB ... 44
Table 4.13: Summary of results per algorithm ... 44
Table 4.14: Summary of best TM techniques per algorithm... 45
Table 4.15: Results of subcategories using dataset with category ... 46
Table 4.16: Results of subcategories using separated datasets for each category ... 47
Table 4.17: Results of subcategories without category as feature ... 48
Table 4.18: Summary of results per approach ... 48
Table 5.1: Number of recategorizations per categories vs subcategories in the same dataset ... 52
Table 5.2: Accuracy of manual vs automatic categorization ... 53
xiii
List of Figures
Figure 1.1: Design Science Research Methodology Process Model ... 3
Figure 1.2: Guideline for this research ... 4
Figure 1.3: Incidents Number Growth from 2015 to 2017 ... 6
Figure 3.1: Design Workflow ... 23
Figure 4.1: Accuracy of nominal attributes vs full description vs short description using SVM ... 30
Figure 4.2: Accuracy of nominal attributes vs full description vs short description using KNN ... 30
Figure 4.3: Number of locations assigned to each category ... 31
Figure 4.4: Accuracy of Word Tokenizer vs Alphabetic Tokenizer with SVM ... 37
Figure 4.5: Accuracy of Word Tokenizer vs Alphabetic Tokenizer with KNN ... 39
Figure 4.6: Accuracy of Word Tokenizer vs Alphabetic Tokenizer with ID3 ... 41
xv
Acronyms
DSRM Design Science Research Methodology DT Decision Trees
IC Incident Categorization ID3 Iterative Dichotomiser 3
IDF Inverse Document Frequencies IM Incident Management
IT Information Technology
ITIL Information Technology Infrastructure Library ITS Incident Ticket System
ITSM Information Technology Service Management KNN K-Nearest Neighbors
ML Machine Learning NB Naïve Bayes
NER Named Entity Recognition NL Natural Language
NLP Natural Language Processing RQ Research Question
SVM Support Vector Machines TF Term Frequencies
TFxIDF Term Frequency–Inverse Document Frequency
TM Text Mining
TC Text Categorization TP True Positives FP False Positive FN False Negative
1
1
Introduction
Information Technology Service Management (ITSM) is a discipline for managing Information Technology (IT) operations (Galup, Dattero, Quan, & Conger, 2009) which provides a framework that deals with alignment and management of IT services, in conformity with the needs of the business, and which aim is to improve business performance through the best IT service delivery. Thus, ITSM focuses on the development of methodologies and tools to provide an efficient and high quality service (Marcu et al., 2009), which includes optimizing IT services and business operations and increasing employees’ productivity and costumers’ satisfaction.
The Incident Management (IM) process, one of the most important components of ITSM (Salah, Maciá-Fernández, Díaz-Verdejo, & Sánchez-Casado, 2016), focuses on tracking and managing all incidents, from opening until closure. Its goal is to resolve incidents as quickly as possible, ensuring the less impact for costumers and the correct operation of IT’s services organizations (Gupta, Prasad, & Mohania, 2008b). IM is also the process of ITSM that provides visible gains to service quality most directly as well as cost reduction (Gupta, Prasad, & Mohania, 2008a).
In companies, incidents are created every day, which brings the need to record many events that negatively impacts the system operation. The growth of incidents brings difficulties to the responsible users included in the IM process, reducing the support performance.
2
1.1 Motivation and Research Context
With the exponential usage of IT in companies, a lack in costumer support service has been verified (Dias Freire De Mello & Lopes, 2015). In companies, a lot of incident tickets are created every day, and specific IT teams exist to resolve them. However, in many cases this process is not entirely systematic and may be incoherent and inefficient (Salah et al., 2016), resulting in a waste of several resources which increases companies’ costs (Song, Sailer, & Shaikh, 2009). Therefore, to be competitive, companies need an efficient and cost-effective service and support delivery (Zhou, Xue, Wang, & Shwartz, 2017). Consequently, many companies started to adopt tools to help and support teams that are responsible for the IM process (Marcu et al., 2009). Such tools are software systems used in organizations to register and track all incidents and typically refer to an Incident Ticket System (ITS).
A coordinated ITS provides a positive effect on the efficiency of the IM process, which in turn improves and increases companies’ revenue. Most ITS follow the Information Technology Infrastructure Library (ITIL) (Cannon & Wheeldon, 2007), the most adopted ITSM framework to facilitate and help the decision-making process (Salah et al., 2016). ITIL delineates best practices and standards to IM, helping companies to improve their processes. ITS represents a significant contribution to an efficient IM process, to obtain lower costs and an increased organization growth.
To answer organization’s needs, this work proposes an automatic categorization on ITS. Manual classification originates error prone, and consequently time consuming, which in large organizations is not feasible (Altintas & Tantug, 2014). With an automatic categorization, we intend to automate incident classification and in parallel reduce classification errors and useless time spent in the IM process.
Machine Learning (ML) turns possible the IM process automation, categorizing automatically incidents and assigning them to a resolution group. Text mining (TM) and Natural Language Processing (NLP) contributes to a correct categorization, highlighting the key words most relevant to a certain category.
3
1.2 Research Methodology
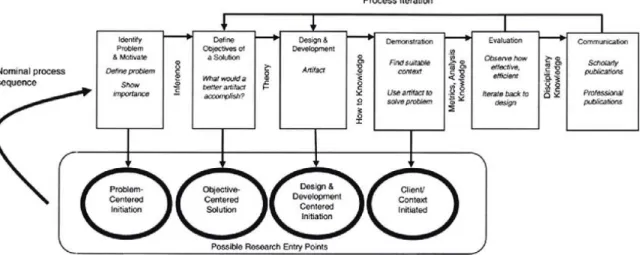
Design Science is a subject that creates and evaluates IT artefacts in order to solve organizational problems (Peffers, Tuunanen, Rothenberger, & Chatterjee, 2007). To develop this dissertation, we adopt the Design Science Research Methodology (DSRM), which is composed by six activities that are presented in Figure 1.1 and are described below.
Figure 1.1: Design Science Research Methodology Process Model (Peffers et al., 2007)
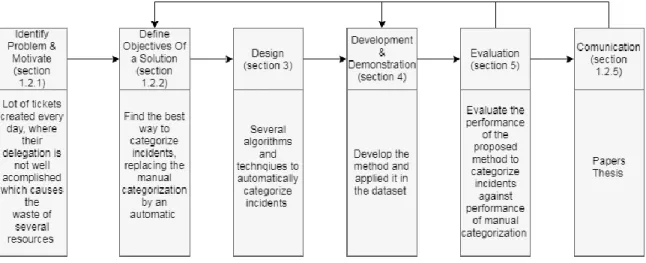
Our research represents an industry need, since the goal is automating one of the processes of IM. Currently, the process of categorizing incidents is done manually by ITIL agents, so our proposal is to automate this process. Consequently, the approach that we adopted is an objective-centered solution, in which we are addressing the development and design of one artefact. The artefact focuses on the best method to categorize incidents automatically: first, we need to choose which are the algorithms to the best categorization possible; then, with the application of the different algorithms and TM techniques is obtained the best method. After that, with the best output method of the previous process, are categorized one more time the same incidents, but with different categories. Finally, we present the evaluation, to understand if our proposal helps to solve the problem and fits the defined objectives. Figure 1.2 presents the steps to follow along this dissertation.
4
Figure 1.2: Guideline for this research (Adapted from 1.1)
In the next subsections, we will describe in detail each step presents in Figure 1.2.
1.2.1 Identify Problem and Motivate
Delegation of incidents is not always well accomplished, and incidents are addressed to resolution groups that are not capable of solving them, causing delays in the whole process of dispatch (Agarwal, Sindhgatta, & Sengupta, 2012;Salah et al., 2016). Incidents are forwarded to finally be addressed to the right resolution group, which affects incident route negatively demanding the use of more resources, consequently, leading to wasted time generating customer dissatisfaction (Shao, Chen, Tao, Yan, & Anerousis, 2008).
In order to attain a right assignment, it is crucial to have an appropriate incident classification, process that attributes a suitable category to an incident, so they are routed more accurately (Cannon & Wheeldon, 2007).
Automating incident classification means no human error; reduced waste of resources, and no incorrect routing due to the wrong classification (Gupta, Prasad, Luan, Rosu, & Ward, 2009).
5
1.2.2 Define Objectives for a Solution
The goal of this research is to develop and propose a method that categorizes correctly and automatically an incoming incident, using ML algorithms and NLP techniques. To achieve the proposedobjectivethere are three main research questions (RQ) that we will try to answer:
RQ1: Can we use supervised learning algorithms and NLP techniques to categorize automatically and correctly incident tickets?
RQ2: Can we find a method that correctly categorizes most of incident tickets? RQ3: The proposed method improves the Incident Categorization (IC) process?
1.2.3 Design
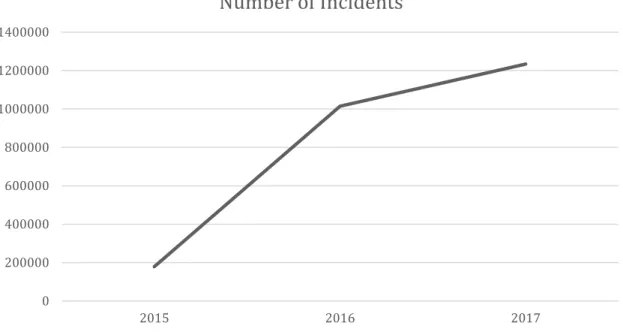
In this thesis it is used a dataset from a company that due to privacy questions cannot be mentioned along the work. The provided dataset is composed approximately by 900,000 incident tickets and the dataset contains incidents from November of 2015 to December of 2017. The dataset under study contains incidents correctly categorized that have three levels of categorization. In this work, we will only consider two levels of categories. The incidents are recorded by two different ways, email or phone. Figure 1.3 shows the incidents creation from 2015 to 2017.
6
Figure 1.3: Incidents Distribution from November of 2015 to December of 2017
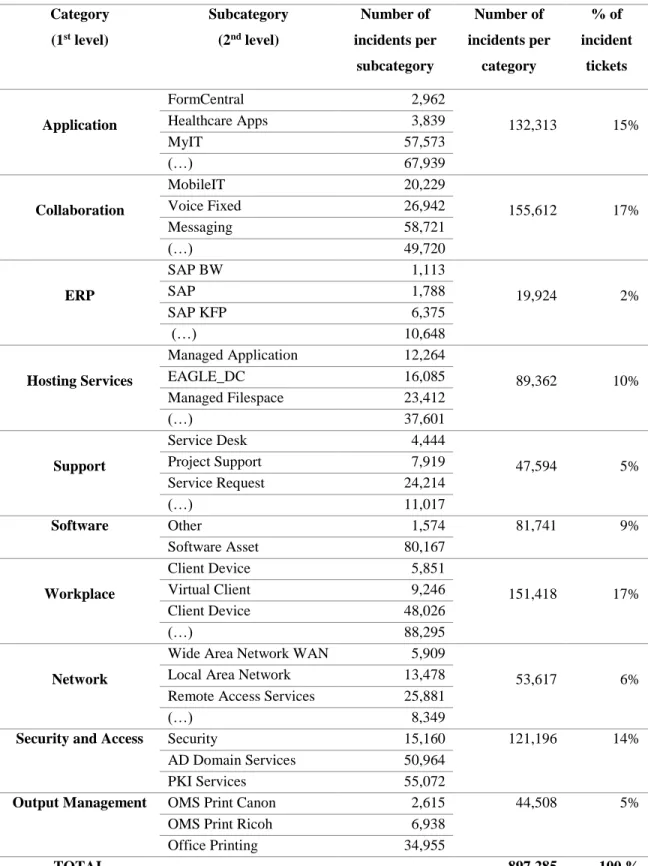
The set of first level categories is composed by the ten following categories: application, collaboration, enterprise resource planning (ERP), hosting services, network, security and access, output management, software, workplace, and support. After assigning a first level category to an incident, a second level category is assigned. The set of second level categories is composed by 81 categories: 32 belong to application, 7 to collaboration, 5 to ERP, 8 to hosting services, 5 to network, 3 to security and access, 3 to output management, 2 to software, 9 to workplace, and, finally, 7 to support. Table 1.1 presents the number of incidents per category and subcategory. The subcategories are present by ascending order of incidents.
0 200000 400000 600000 800000 1000000 1200000 1400000 2015 2016 2017
Number of Incidents
7
Table 1.1: Number of incidents per category and subcategory
Category (1st level) Subcategory (2nd level) Number of incidents per subcategory Number of incidents per category % of incident tickets Application FormCentral 2,962 132,313 15% Healthcare Apps 3,839 MyIT 57,573 (…) 67,939 Collaboration MobileIT 20,229 155,612 17% Voice Fixed 26,942 Messaging 58,721 (…) 49,720 ERP SAP BW 1,113 19,924 2% SAP 1,788 SAP KFP 6,375 (…) 10,648 Hosting Services Managed Application 12,264 89,362 10% EAGLE_DC 16,085 Managed Filespace 23,412 (…) 37,601 Support Service Desk 4,444 47,594 5% Project Support 7,919 Service Request 24,214 (…) 11,017 Software Other 1,574 81,741 9% Software Asset Management 80,167 Workplace Client Device Maintenance 5,851 151,418 17% Virtual Client 9,246 Client Device 48,026 (…) 88,295 Network
Wide Area Network WAN 5,909
53,617 6%
Local Area Network (LAN)
13,478 Remote Access Services
(RAS)
25,881
(…) 8,349
Security and Access Security 15,160 121,196 14%
AD Domain Services 50,964
PKI Services 55,072
Output Management OMS Print Canon 2,615 44,508 5%
OMS Print Ricoh 6,938
Office Printing 34,955
8
1.2.4 Development and Demonstration
To achieve the goal of this research and to answer the proposed research questions, we propose the development of a method capable of automatically categorize incidents without human interaction. To design our artifact, we will follow the steps listed below:
• First, we need to determine which are the attributes that have a better impact on the classifier, which means the attributes that outputs the greater results, categorizing the incidents as correctly as possible. These attributes will serve as input to the next step.
• Using the dataset with the best attributes defined previously, we will apply text pre-process of data with different algorithms to obtain the best classifier. In this step we will present the results obtained with the application of the different algorithms and the NLP and TM techniques used to produce the results and to conclude which is the best method for the categorization.
• Having completed the previous step, it is present the categorization for the first and second levels of categories, using the proposed method. For the second level, we use three different approaches to conclude which better results on our data.
To test our artefact and discover if it fits the purpose, we will use the dataset referred previously, that was provided by a company that due to privacy questions, cannot be mentioned along this dissertation.
The datasets are composed by incidents correctly classified, with an appropriate category and subcategory. Using these datasets, we will experiment several TM and NLP techniques and ML algorithms described previously in the related work section, to be able to assess the performance of them on the respective data.
9
1.2.5 Evaluation and Communication
To evaluate our implementation, we will use the obtained results with the demonstration process to compare with the performance of manual categorization. After selecting which method has better performance, we will answer how this method improves the IM process in comparison to the manual categorization. Finally, we will verify if our method answers the proposed research questions and achieves the defined goal of the research.
Concerning research communication, a part of this research is presented by two papers and the whole research is represented by this document.
1.3 Document Structure
The remainder of this dissertation consists of six chapters that are structured as follows.
The second chapter presents the related work, studies related with automating, improving and optimizing the IM process. It describes which approaches and ML algorithms are implemented, and which are the results obtained with the respective approaches.
The steps took, and the approach adopted to achieve the research proposal are present in the third chapter.
In the fourth chapter, it is present the development and demonstration of our implementation and the respective results.
In the fifth chapter, the solution is assessed to understand how impacts the problem. In the sixth chapter, our conclusions, possible future work and the felt limitations along dissertation are presented.
11
2
Theoretical Background and
Related Work
This chapter presents relevant literature related to the proposed research. The literature discussed here represents and serves as a guideline to the research development and in order to achieve the defined goals. In section 2.1, we describe in more detail the IM Process and the IC. Section 2.2 section presents the Text Categorization (TC) process and their inherent steps, as well as the techniques and algorithms included in the whole process. In section 2.3, we describe how to assess the classifiers’ performance. In section 2.4, to conclude the chapter, we introduce the several applications of similar studies in IC.
2.1 Incident Management and Incident
Categorization
An incident is defined by ITIL as “An unplanned interruption to an IT service or reduction in the quality of an IT service”. These incidents can be related with failures, questions or queries and should be detected as early as possible (Cannon & Wheeldon, 2007).
IM is the process responsible for managing disruptions, thus being a crucial factor in creating a high scalable system (Abbott & Fisher, 2009) as well as being responsible for restoring the normal operation, finding as quickly as possible a resolution for the incident, and minimizing business impact (Cannon & Wheeldon, 2007). To attain the success and
12
efficiency of the process, there are four critical success factors that must be achieved such as quickly resolving incidents, maintaining IT service quality, improving IT and business productivity and maintaining user satisfaction (Steinberg, 2013). So, when a disruption on the system is detected, by the system or by users, several activities follow (Cannon & Wheeldon, 2007). Table 2.1 describes the IM activities.
Table 2.1: Incident Management Process Activities
Activity Description
Incident Detection and Recording
An incident must be recorded as soon as possible after being detected, if possible before user’s damage.
Classification and Initial Support
Incident Categorization: The incident type should be
correctly assigned to the incident.
Incident Prioritization: This process deals with attributing
urgency and impact to an incident.
Investigation and Diagnosis
In this step, incident escalation is performed, which includes an initial diagnosis to find a resolution. If the resolution is identified, the incident is solved, otherwise the incident is escalated for another support resolution group.
Resolution and Recovery
In this step, the previously identified resolution must be tested in order to ensure the system is operational.
Incident Closure In the closing of an incident it is necessary to check if the categorization done in the second step is correct, if users are satisfied with the respective resolution, and if the documentation related to the incident is correct.
13
Our research focuses on automating the IC process included in the second activity. IC is one of the sub-activities of Incident Classification that is one of the first steps in IM process (Gupta et al., 2009). IC has the purpose of assigning incoming incidents to the most suitable category, which in turn allows to automatically assign the incident to a specific resolution group (Cannon & Wheeldon, 2007).
IC is also useful for reporting, improving the clarity and granularity of data. Ordinarily, ITS has its predefined categories, but due to companies having their own business model in most cases the set of categories is customized to each company, making them unique.
In a common ITS, the categorization is done manually which implies an increased waste of time and it is error prone. Automating IC not only reduces the time spent in the IM process by IT teams, but is also leads to a more accurate classification (Gupta et al., 2009).
2.2 Text Mining and Text Categorization
TM is the process responsible for identifying and extracting useful information from unstructured text (Vijayarani, Ilamathi, & Nithya, 2015). This involves text analysis, categorization, clustering, and visualization. Through several TM techniques it is possible to deduce patterns and knowledge from text (Rokach & Maimon, 2008).
TC, also known as, text classification is one of the applications of TM (Vijayarani et al., 2015) and is the process that deals with the assignment of pre-defined categories, topics, or labels to NL texts or documents (Sebastiani, 2002). Automated TC is a supervised learning task (Yang & Liu, 1999) that uses ML in order to learn how to classify from examples that perform the categorization automatically (Joachims, 1998b). Given a set of documents D = {d1, …, dn} with assigned categories C = {c1, …, cn} and a new document
d, the main goal is to predict which category should be assigned to document d.
There are several approaches used on TC, which differ on how they represent documents and decide to assign a category to a document (Cardoso-Cachopo & Oliveira,
14
2003). TC is divided in two types of classification: binary and multi-class. A binary problem is when a document is assigned to one of two categories. A Multi-class problem is composed by two problem types, single-label and multi-label. The first consists of assigning to the document to exactly one of the pre-defined categories. In multi-label classification, the documents are assigned more than one label at the same time (Wang, 2008).
The generic main steps of the automatic TC are the document pre-processing, the feature selection and extraction, model selection, and finally training and testing the classifier (Dalal & Zaveri, 2011).
2.2.1 Text Pre-processing and Feature Selection
Text Pre-processing is the first step in the TC process (Vijayarani et al., 2015), which starts with the tokenization technique. In this technique the text is split in conformity with pre-defined delimiters. Then, techniques such as stop-word elimination are used, which is the process that eliminates the words that are not meaningful for classification, and stemming, which then reduces words to their base form (Son, Hazlewood, & Peterson, 2014; Srividhya & Anitha, 2010; Dalal & Zaveri, 2011).
After the data preparation process is finished, the main goal is representing each document as a feature vector, selecting the terms that are relevant to identify a document and removing features that are irrelevant to the classification, causing dimensionality reduction of the dataset. One of the used methods in this step is the term frequency-inverse document frequency (TFxIDF) (Son et al., 2014) and consists on assigning to each term a weight based on the frequency of the term in the document. This weight increases with the number of times the term occurs, but is offset by the frequency of the term in the corpus (Altintas & Tantug, 2014). This algorithm is the most used in literature due to the performance achieved in different TC tasks. There is also a technique called Named Entity Recognition (NER), which consists on finding expressions like people’s names, organizations, or entities, and add value to the text analysis. Instead of treating words with
15
no connection to the rest of the text, this technique allows an understanding of the context and an improvement of the analysis performance (Mohit, 2014).
With this process, it is obtained a smaller dataset and consequently lower computational requirements are needed for the TC algorithms, which is crucial to achieve success in this stage (Ikonomakis, Kotsiantis, & Tampakas, 2005).
2.2.2 Cross-Validation Model
The Cross-validation process is a popular strategy ordinarily used in predictions. This technique is used for model selection, allowing to assess the performance of the resulted model. There are different options related to Cross-Validation and one of them, K-fold, consists in dividing randomly the whole training set into n subsets of equal size. One subset is used to test the classifier, which means to obtain the predictions, while the n
– 1 subsets of the training dataset is used to obtain the classifier. (Arlot & Celisse, 2009;
Chih-Wei Hsu, Chih-Chung Chang, 2008).
2.2.3 Classifiers
Most of the methods used for classification are also used for TC: for example decision trees (DT), support vector machines (SVM), Naïve Bayes (NB) and K-Nearest Neighbours (KNN) classifiers (Aggarwal & Zhai, 2013). These algorithms are used in Supervised Learning, when instances (inputs) in the dataset are assigned to known and correct labels (outputs). Using Supervised Learning classifiers, the dataset instances are learned, and the process is repeated various times, resulting several classifiers. Then, it is taking the vote of the different classifiers and is predicted the correct output of a new instance (Kotsiantis, 2007).
16
2.2.3.1
Support Vector Machines
SVM (Joachims, 1998a) is a binary method of supervised learning introduced in TC, between 1998 and 1999 by Joachims. SVM consist on mapping input vectors into a high dimensional space and outputting the creation of a hyperplane (Vapnik, 2000). With the training data, this algorithm returns the optimal hyperplane, which separates data. As the problem of this work be multi-class, there are several approaches to solve these problem types: One-against-all build the same number of binary classifiers as the number of classes. Each classifier separates a certain class from the rest of the others. The predicted class is obtained according to the highest classifier output; other approach is One-against-one, that consists with n classes, create n(n-1)/2 classifiers, which means the creation of a classifier for a pair of classes. The predicted output is obtained by the votes from classifiers (Braun et al., 2010). “SVM are particularly promising because they are very accurate, quick to train and quick to evaluate” (Dumais, Platt, Heckerman, & Sahami, 1998).
2.2.3.2
K-Nearest Neighbors
KNN algorithm uses most of times the Euclidean distance to identify which are the
K nearest neighbors of the instances, however it can also use other similarity measures
(Duneja & Puyalnithi, 2017). The class of each instance is determined using a majority vote. ML algorithms and is a popular one in TC (Song, Huang, Zhou, Zha, & Giles, 2007).
2.2.3.3
Decision Trees
DT can be used to different ends, being one of them classification, so they can be used to classify an instance to a predefined set of classes.
A rooted tree is a directed tree with a root node. The tree is composed by several nodes that represent features. Each one has an incoming edge, which represents a decision
17
or rule. All the nodes with outgoing edges are nominated internal or test nodes. The final ones are the decision nodes or leaves that represent the outcome. The outcome is calculated according to a certain discrete function through all the input attributes (Rokach & Maimon, 2008).
2.2.3.4
Naïve Bayes
The NB algorithm uses the Bayes’ rule to predict instance’s most likely class.
𝑃(𝑐|𝑥) = 𝑃(𝑐)𝑃(𝑥|𝑐)
𝑃(𝑥) (2.1)
In the equation, x represents an instance and c, a category. With this measure, it is calculated the estimate from training documents. To calculate the probability of each class and to select which is the class with higher probability, the attributes that compose the instances (features), are all considered independents of each other and it is calculated for each feature the probability of belong to a certain category (Mccallum & Nigam, 1997). After calculating the probability for each feature of x is possible obtain the probability of the instance x to belong to the category c. The category with highest probability is the output of the classifier.
2.3 Evaluation
The classifiers performance must be measured, and in the classification area the performance is usually measure with resort to an error rate. The classifier predicts the category to assign to the instance. If it predicts the correct category, it counts as a success; otherwise it counts as an error. “The error rate is the proportion of errors made over a whole set of instances, and reflects the overall performance of the classifier” (Altintas & Tantug, 2014).
18
Other metrics that measure the performance are the precision and recall. Dependently of the cases, it is more important to have a higher precision or a higher recall rate.
The precision measure defines how accurate the model is, i.e. quantifies how many instances classified to the target class do in fact belong to the target class. The recall quantifies how many instances are categorized to the target class of those who actually belong in it.
𝑃𝑟𝑒𝑐𝑖𝑠𝑖𝑜𝑛 = 𝑇𝑟𝑢𝑒 𝑃𝑜𝑠𝑖𝑡𝑖𝑣𝑒 (𝑇𝑃)
𝑇𝑟𝑢𝑒 𝑃𝑜𝑠𝑖𝑡𝑖𝑣𝑒 (𝑇𝑃) + 𝐹𝑎𝑙𝑠𝑒 𝑃𝑜𝑠𝑖𝑡𝑖𝑣𝑒 (𝐹𝑃) (2.2)
Recall = TP
TP + False Negative (FN) (2.3)
The F1-Measure considers both precision and recall. The best value for this metric is 1, which means a perfect precision and recall.
F1 − Measure = 2 × Precision ∗ Recall
Precision + Recall (2.4)
2.4 Text Categorization Applications in
Incident Categorization
Over the years, approaches that automate the IM process have been studied and developed. One of these approaches is automating incident classification which is the purpose of our research. In this section we describe some work developed in this area and which results were obtained with the respective implementations.
Gupta et al. (2009) focused on automate IM process, specifically in automate the incident ticket classification. The classification of incidents embraces assigning a category,
19
as well as a priority and an impact to an incident. In this research, they present two approaches for automating classification, consisting on the analysing of the incident descriptions written in NL. The analysis is made of two approaches. One of them is knowledge engineering, which is based on a set of rules created by experts. These rules use AND / OR relations and consist on mapping attributes of incident descriptions to corresponding incident categories. When an incoming incident arrives, the respective category is assigned through the defined rules.
The other is based on ML, in which a classifier is automatically created using pre-classified incidents. They denote a sequence of words as incident features and then use Naïve Bayesian classification. The probability of assigning a category to an incident is calculated for all categories. Finally, the incoming incident is assigned to the category that has the maximum value. To ensure that the system classification is done as correctly as possible, a category is only assigned if the probability overcomes a defined threshold.
The authors achieve 70% accuracy with 1,000 features. In agreement with an analysis of IBM internal tools based and built on similar conditions, it is indicated a reduction of tickets’ resolution times by over 25%.
Son et al. (2014) to automate XSEDE ticket system focused on automating incident classification. For that, the authors resort to the NB algorithm. Related to NB, one of the variants is Multinomial NB, which was used in this research. Multinomial NB considers the word frequency in the documents, taking into account the words sequence, which sometimes improves the classification. The authors use for training a dataset composed by 7042 tickets and 717 for the test set. The goal is to assign a ticket to a tag. The tag indicates which category the ticket should be assigned to. The algorithm uses as input to the classifier, a word list composed by email subjects. The reason to the authors did that was because the text contained in the ticket subject is much more condensed than in the ticket body. With this text they also used TFxIDF and stop-words removal. Another algorithm used was Softmax Neural Network (SNN). This algorithm also calculates the probability of a feature belongs to a category. One more time, the category with higher probability is the chosen category. The results using Multinomial NB was ~70% of accuracy and using SNN was ~68%;
20
Agarwal et al. (2017) proposes the development of a tool called SmartDispatch. Their work is based on ticket descriptions. They used weighted vectors of terms to build a classifier and on SVM. They achieved performance between 69% and 81% of accuracy in the three datasets. The three datasets had different domains. Based on these results, they decided to assign a category only if the probability was greater or equal to 90%. and consequently, obtained better results. However, they noted that for two of the three datasets was possible classify 55% and 62% of the incident tickets with a probability higher than 90%, whereas for the third dataset was only possible classify 25% of the incident tickets. So, they decided to develop a new classification approach called discriminative term approach (DTA) which is based on the IDF technique but use SVM. In this approach, they defined the classifier to assign the resolution group with higher probability than 90%. This approach leads to results from 59% to 72% accuracy and 100% precision for the three datasets. Then, they decided to use the best of DTA and SVM, which meant that when an incident ticket arrived the DTA was used, but if there was no group resolution with a score higher or equal to 90%, SVM is used to know which groups have the higher score. And here SVM outperforms DTA.
Altintas & Tantug (2014) propose an extension to integrate into an ITS, which consists on assigning tickets to the suitable person of the support team. If the prediction confidence is greater than a defined threshold, the ticket is assigned to the predicted category, otherwise it is manually categorized. The tickets are composed by date, user, category, subcategory, and subject. The last attribute consists in a NL text and this is the critical attribute to the categorization process. The authors apply feature extraction, using TFxIDF and stop-words removal. To classify the tickets, they experimented with 4 algorithms: SVM, NB, KNN and DT. SVM achieves the higher performance, with 86% of accuracy.
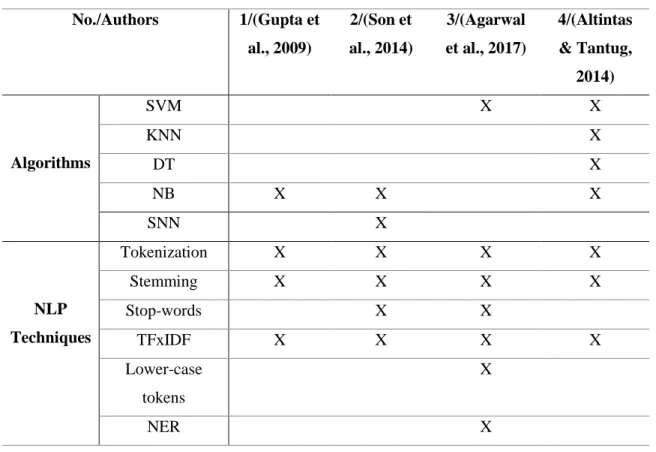
A summary of the approaches described previously are present in the following Table 2.2.
21
Table 2.2: Comparison of similar studies
No./Authors 1/(Gupta et al., 2009) 2/(Son et al., 2014) 3/(Agarwal et al., 2017) 4/(Altintas & Tantug, 2014) Algorithms SVM X X KNN X DT X NB X X X SNN X NLP Techniques Tokenization X X X X Stemming X X X X Stop-words X X TFxIDF X X X X Lower-case tokens X NER X
These papers serve as support to our research, and as to be able to propose the best method, we will use all algorithms and techniques described in Table 2.2 to conclude which are the ones that have the greatest impact on our data and propose the method that best fit in the specific data.
22
3
Design
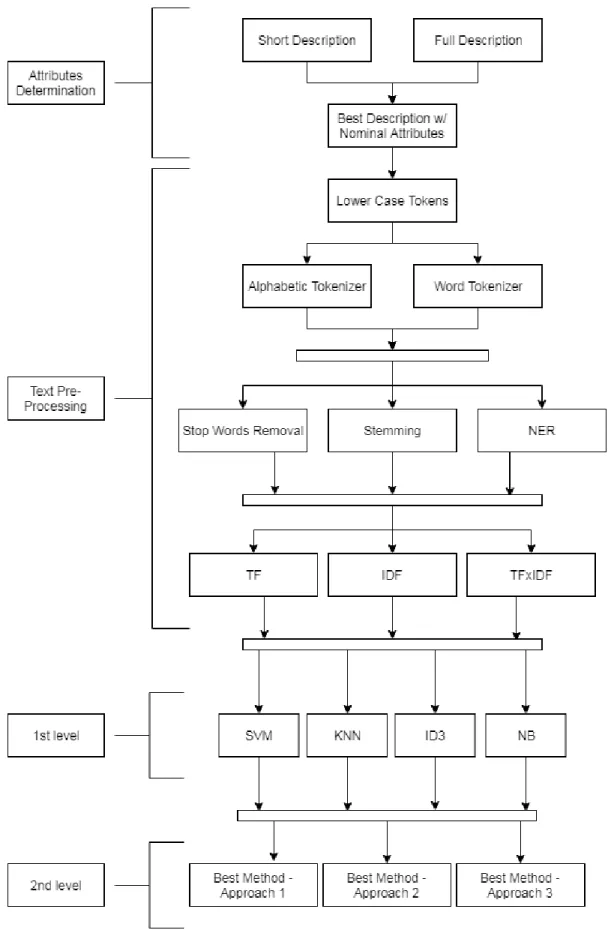
This chapter details the design of the proposal. Section 3.1 describes the process to determine the attributes for the categorization. Section 3.2 describes the text pre-processing which involves all TM techniques applied. Section 3.3 presents the application of the classifiers for the first level of categories. Section 3.4 Presents the approaches used for the second level categories, applying the best output method obtained in the previous section. All steps to obtain and propose the best method to categorize the incidents automatically, that involve discovering the most suitable attributes, the application of the TM techniques and the respective algorithms, are described above in detail. Figure 3.1 presents the workflow that serves as support to the development and demonstration step.
23
24
3.1 Attributes Determination
Even though the dataset has incidents written in several languages: English, German, Spanish, French, and Portuguese, we have decided to choose English as the one to be studied and exclude all the incidents in other languages from our analysis, being that English is the most common one.
We start by analyzing which attributes are the most relevant for the IC process. Each incident ticket has, in addition to the descriptions, the following information: its severity, which is divided in three levels: 1 refers to a critical state, 2 to medium and 3 to low. The other attribute is its location, which is the geographical location of the user that opens the incident. The attribute is represented by different abbreviations. Each abbreviation represents the country and the respective city. To choose the most suitable attributes for the classifier performance, we need to classify the data taking into account the different attributes, to be able to compare the different results and conclude which are the attributes that has higher impact on data. In this step, we will focus on the difference between considering only the nominal attributes and considering both descriptions separately. The full is a detailed description of the incident with 35 words approximately, while the short one is a focused description with 6 words approximately. This is one crucial step in order to get a good performance of the classifier, since we are defining the attributes that better characterize the categories. Table 3.1 shows an example of one incident ticket that composes the used dataset.
25
Table 3.1: Incident ticket example
Full Description “Please could you reset the Windows password and unlock the account?”
Short Description “Windows password reset”
Severity 3 – “Low”
Localization MEX EC
Category Security and Access
Subcategory Identity and Account Management
In order to verify which are the attributes with the biggest positive impact on categorization, we will use only the first level of categories.
In all approaches we will consider 5,000 incident tickets per category, in order to have the same amount of data to each category and to the results not be affected by the frequency of each category in the dataset. For this train we will use SVM and KNN algorithms and cross-validation technique with 10 folds. With the application of these two algorithms is possible compare the results and be sure which are the attributes with better impact for the categorization. In this step, we use SVM and KNN, since the algorithms show good performances with textual data. In the first approach is only used as attributes, the severity and the location. In the second is only the incident short description and finally, in third is only the incident full description.
To train the classifiers with SVM, we need the kernel type and the C parameter. The C represents the hyperplane margin, high values of C represent a small margin and consequently a misclassification rate lower on the training set, while low values represent a high margin and a misclassification rate higher. The only parameter of KNN is the number of neighbors. In this step we focus on test different parameters of the algorithms in order to achieve the best performance of them, instead of exploiting different parameters. The goal is test which attributes we should consider to the categorization. In all approaches
26
we only apply one TM technique to the both descriptions, the Alphabetic tokenization. As further study other possibilities are present in the next section.
3.2 Text Pre-Processing
Concluding the relevance of textual data for the IC, we move to the first step of TC, the text pre-processing. We start by analysing two different tokenization strategies: alphabetic and word tokenization. The alphabetic tokenizer is a simple tokenizer that only considers tokens composed by alphabetic sequences. The word tokenizer is a standard word tokenizer that splits words according to predefined tokens, such as space, punctuation, etc. Then we analyse the application of transforming all tokens contained on descriptions into lower case. Another aspect that we have explored is stop-words removal, that consists on removing words which ordinarily do not improve the classification performance. Ordinarily, stop-words are words commonly used to connect speech like propositions. Another explored technique is stemming, which consists on reducing the words to their base form, thus lowering the number of entries of the dictionary. We also explored named-entity recognition, focusing on the identification of organizations and used them as features to improve the categorization. Finally, the last aspect that we have explored was the descriptions representation. In that sense, we represent descriptions as feature vectors of term frequencies (TF), log(1 + fij), fij is the frequency of word i in document j (other dampening strategies could be used); inverse document frequencies (IDF), log(num of Docs/num of Docs with word i); and, TFxIDF. TFxIDF increases with the number of times a term occurs in a document but is offset by the document frequency of the term in the corpus. This technique turns possible give weight to the terms that better categorize the incidents.
27
3.3 First Level Categorization
In order to train the classifiers, we use the algorithms described in the related work, which are the most suitable for our problem. As we have a labelled dataset, the approach that we use is based on supervised methods. Therefore, we use SVM, KNN, DT and NB, which were the algorithms used in the related work and which produced good results. One more time, we used cross-validation with 10 folds. The purpose is to compare the different algorithms using the several TM techniques described in sub-section 3.2 and verifying which algorithm and which techniques present the best classifier performance.
Related to this section, four sub-sections are presented, each one related with an algorithm. Along each sub-section the application of several TM techniques is present. At the end are present for each algorithm the techniques that present the better results.
At the end of this step it is expected to obtain the method that best fits on assigning a category to an incident.
3.4 Second Level Categorization
Concerning the second level of categories, we considered 617 or 618 incident tickets by subcategory, which composes a dataset with 50,000 incidents. One more time we defined the same number of incidents, but now by subcategory. With this dataset it was explored three different approaches. The first one is performing the categorization assuming that the first level category is correctly assigned to the incident. Basically, we use the first level category as an attribute to build the classifier that assigns the second level category to a given incident. In this approach we try understanding if there are assigned subcategories that do not belong to the respective category.
The second approach does not take into consideration the first level categorization. Therefore, the incident is categorized with the same data that we use in the first categorization, but instead of assigning a category, it is a subcategory assigned, which
28
means the category is not seen as it is in the first approach. Related to this approach, it is important to note that when the classifier automatically assigns a second level category, we are also automatically assigning the respective first category.
In the third approach, we divide the data by category, obtaining ten datasets, where each one is related to a category. So, in this last approach the incidents can only be assigned to a subcategory that has a category that includes the assigned subcategory. This approach helps to understand the type of errors found in the first approach.
In the three approaches, we build classifiers using the same method that achieved the best performance in the first categorization. Nevertheless, the difference between the data used in the first level and in the second level can influence the classifier performance. This reason leverages us to present three approaches mentioned previously to categorize the incidents with a subcategory. Those three approaches are based in the way that the dataset is used.
29
4
Development and Demonstration
In this chapter, we present all the results after applying the steps described in the Design chapter. For that, we will use the dataset provided, which is a real environment, to obtain the most suitable method. In section 4.1, we present the results to conclude which are the relevant attributes for the categorization process. In section 4.2 are present the results related to the first level categorization, using the described four algorithms and the several TM techniques are detailed in this section. Section 4.3 presents the results related to the second level categorization.
4.1 Attributes Determination
Figure 4.1 and 4.2 present the achieved results with the application of SVM and KNN algorithms, respectively. In these results, it is possible to compare the use of only nominal attributes, such as the severity and location, only the full description, and only the short description. The TM technique used here was only the Alphabetic tokenizer with the full and short descriptions. After verifying which is the best attribute, it is possible combine it further with the other attributes.
30
Figure 4.1: Accuracy of nominal attributes vs full description vs short description using SVM
Figure 4.2: Accuracy of nominal attributes vs full description vs short description using KNN
0% 10% 20% 30% 40% 50% 60% 70% 80% 90%
Nominal vs Full vs Short - SVM
Nominal Full Description Short Description
0% 10% 20% 30% 40% 50% 60% 70% 80% 90%
Nominal vs Full vs Short - KNN
31
In both figures, is possible to observe the relevance of textual data for a correct categorization. In most categories, using the full and short description leads to a greater accuracy, especially when using only the short description. It is peculiar that the support category with both algorithms presents a better accuracy when using only nominal attributes, alternatively of what happen with the other categories. ERP category is also a peculiar case, obtaining a higher accuracy using only nominal attributes than with the full description. So, we analyzed the number of locations for each category, which is presented in Figure 4.3.
Figure 4.3: Number of locations assigned to each category
Analyzing the number of locations assigned to each category it is interesting observe that the categories of support and ERP are also the categories with the lower number of locations. The reason to both categories has this higher accuracy with the nominal attributes can be due the fact that are incidents very characterized of specific locations which turns possible a well categorization with the nominal attributes, against of what happen with the others.
Since the accuracy metric, is not enough to evaluate the classifier performance, given that the metric only represents the rate of the TP and the FN, we also present precision
32
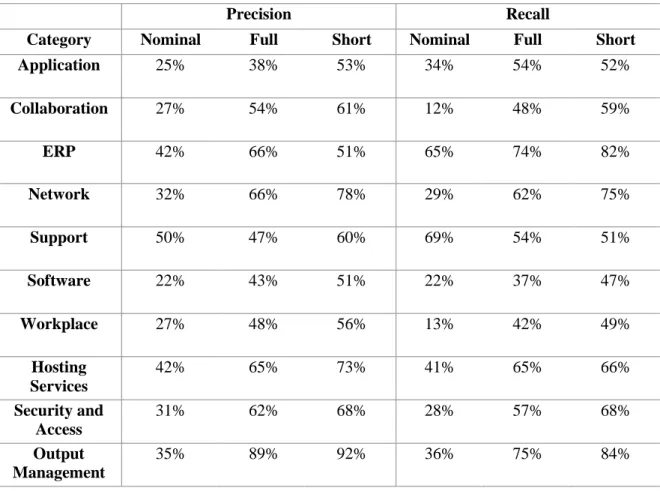
and recall. For IC it is important to have both a high precision and a high recall. If precision and recall are low means that there are lower number of TP, which implies a lower classifier performance. So, Table 4.1 and 4.2 present the precision and recall related to SVM and KNN algorithms.
Table 4.1: Precision and Recall of nominal attributes vs full description vs short description using SVM
Precision Recall
Category Nominal Full Short Nominal Full Short
Application 25% 38% 53% 34% 54% 52% Collaboration 27% 54% 61% 12% 48% 59% ERP 42% 66% 51% 65% 74% 82% Network 32% 66% 78% 29% 62% 75% Support 50% 47% 60% 69% 54% 51% Software 22% 43% 51% 22% 37% 47% Workplace 27% 48% 56% 13% 42% 49% Hosting Services 42% 65% 73% 41% 65% 66% Security and Access 31% 62% 68% 28% 57% 68% Output Management 35% 89% 92% 36% 75% 84%
One more time is curious look to the results of ERP category and despite the higher accuracy was obtained with the short description, the higher precision was with the full description. Looking to the support is obtained, the best accuracy with the nominal attributes, however the higher precision was with the short description.
33
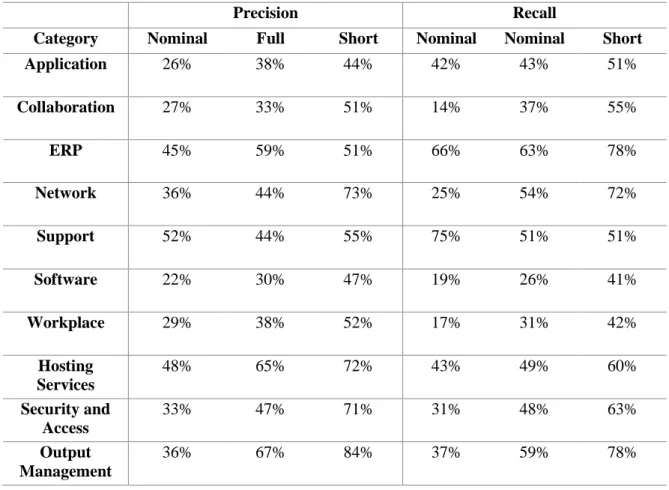
Table 4.2: Precision and Recall of nominal attributes vs full description vs short description using KNN
Precision Recall
Category Nominal Full Short Nominal Nominal Short
Application 26% 38% 44% 42% 43% 51% Collaboration 27% 33% 51% 14% 37% 55% ERP 45% 59% 51% 66% 63% 78% Network 36% 44% 73% 25% 54% 72% Support 52% 44% 55% 75% 51% 51% Software 22% 30% 47% 19% 26% 41% Workplace 29% 38% 52% 17% 31% 42% Hosting Services 48% 65% 72% 43% 49% 60% Security and Access 33% 47% 71% 31% 48% 63% Output Management 36% 67% 84% 37% 59% 78%
One more time, looking for the ERP category is obtained the best accuracy with the short description although is obtained the higher precision with the full description. Related to the support is obtained the higher accuracy with the nominal attributes, however the higher precision was with the short description.
Concerning these results, we can observe that for both algorithms, the textual data represents an essential role for a correct categorization. For both algorithms, Support category has better accuracy when using only nominal attributes. Again, it is interesting to observe that only this category has higher accuracy with only nominal attributes than with
34
the text attributes. However, when we analyze the precision for the Support category with the different attributes, is possible observe a higher precision when is used only the short description, instead of what happens with the accuracy.
However, is very interesting to verify that we achieve better accuracy using the short description when compared with the full description. A possible reason that we found to justify such finding might be the fact that when the user describes an incident with limited text that results in a greater focus on explaining the incident. On the other hand, in the full description the user has tendency to disperse. Table 4.3 presents all results with the nominal and text attributes.
Table 4.3: Results with SVM and KNN
After concluding that short description presents the best results, we decided to apply the same previous approaches but with the nominal attributes and short description together, with the nominal attributes and the full description, and finally with the all attributes. Table 4.4 presents the results of these approaches.
Attributes Metric SVM KNN Nominal Accuracy 35 % 35 % Precision 33 % 35 % Recall 36 % 37 % Full description Accuracy 57 % 46 % Precision 58 % 47 % Recall 57 % 46 % Short description Accuracy 63 % 59 % Precision 64 % 60 % Recall 63 % 59 %
35
Table 4.4: SVM vs KNN using nominal attributes and the short description
As it is possible observe in both algorithms using the short description with the nominal attributes the metrics of performance are greater, increasing 8p.p. for SVM precision and 9p.p. for accuracy and recall. Related to KNN, the increased values are not so good as with SVM, increasing only 1p.p. for all metrics. Related to the nominal and full description and using SVM, the results increase in comparison with the short description, however are lower than when is used the nominal and short description. Using KNN, the results decrease compared with the short description results. Concerning the use of all attributes and using SVM, the results are greater than with only the short description, however when it is compared with the results of the nominal and short description is possible to note similar results, but still lower. The same does not happen with KNN, and lower results are obtained in contrast to the results with only the short description.
With these results, we conclude that is better use the nominal attributes and the short description, against of use only the short description.
Attributes Metric SVM KNN Nominal & Short Description Accuracy 72 % 60 % Precision 72 % 61 % Recall 72 % 60 % Nominal & Full Description Accuracy 68 % 47 % Precision 68 % 48 % Recall 68 % 47 % Nominal & Short & Full
Accuracy 71 % 51 %
Precision 72 % 52 %
36
4.2 First Level – Categories
This section is divided in four sub-sections, where each one is related with a supervised learning algorithm. Each sub-section presents the results of the applications of the different techniques used. As described previously, this process includes tokenization, stop-words removal, stemming, NER, and TFxIDF. These techniques will be applied considering the nominal attributes and the short incident description, which are the best attributes for IC as we had concluded before.
4.2.1 Support Vector Machine
The first algorithm that we use is SVM. For that, we need the following arguments: a matrix with values, where each row represents an incident ticket, the type of the kernel, and the C parameter. There are no rules to define the values of the last two parameters. The only way to choose the best parameters value is try out possible ways and conclude which are more appropriate for this task. However, in this step the goal is to verify which techniques show better results in the feature selection process for this algorithm, therefore we use for the SVM parameters always the same values. We apply as kernel type, the poly kernel and as C value, 0.5.
Figure 4.4 presents the results of the application of the two tokenizers: there was not a significative difference between both approaches, with the alphabetic tokenizer achieving an accuracy of 72% and the word tokenizer achieving an accuracy of 70%.
37
Figure 4.4: Accuracy of Word Tokenizer vs Alphabetic Tokenizer with SVM
To be able to really conclude which are the best tokenizer for our data, Table 4.5 presents the results, for all metrics for both tokenizers.
Table 4.5: Results of Alphabetic tokenizer vs Word tokenizer with SVM
Tokenizer Accuracy Precision Recall F-Measure
Alphabetic 72% 72 % 72 % 72 %
Word 70 % 71 % 70 % 71 %
With the information present in Table 4.5, we conclude that Alphabetic tokenizer has a better impact on our data.
As next step, we transform all the term tokens that resulted of the tokenization into lower case tokens, so same words written with upper or lower cases are considered as the same word. In this step, we want to understand if this technique presents better results. The average difference of the two approaches is 6% for accuracy, precision, and recall, being 78% for all values.
0% 10% 20% 30% 40% 50% 60% 70% 80% 90% 100%
SVM
38
Using stop-words removal and stemming techniques does not lead to improvements. The reasons for this to happen can be the small quantity of words and the domain-specific language that composes incident descriptions. Therefore, in the short description there are very few words that connect the text, also that can be reduced to a common form, having no impact in the results.
We also apply Named Entity Recognition (NER) (Manning et al., 2014) on the short description. Our use of NER focus on the identification of entities and organizations. In general, a single entity is composed by more than one word and with tokenization the words are all split independently of the link between them. If there are entities composed by two or more words, the split is not done between these words, and consequently the IC process can be improved. However, this has no impact on classification, mainly due to the fact that the NER tool was not able to identify entities. Again the domain-specific language may be the major difficulty in this step. For this reason, this step will not be included in the application of the other algorithms.
As final step, we explore the application of three approaches in the previous resulted data: TF, IDF and TFxIDF. Using TF, the short descriptions are represented by feature vectors that contains the number of times a term occurred in the document. Table 4.6 presents the results obtained with the three approaches.
Table 4.6: Results of IDF, TF, TFxIDF with SVM
Techniques Accuracy Precision Recall F-Measure
Lower-Case & Alphabetic & IDF
80 % 80 % 80 % 80 %
Lower-Case & Alphabetic & TF
79 % 79 % 79 % 79 %
Lower-Case & Alphabetic & TFxIDF
39
As it is possible observe the 3 approaches produce very similar values, however the best accuracy is obtained using IDF: 80%, versus 79% for the other approaches.
The SVM classifier achieves the best results with the following TM techniques: Alphabetic tokenizer, lower-case tokens, and IDF.
4.2.2 K-Nearest Neighbors
To run KNN, we need to define the number of k, which is the number of neighbors that the algorithm considers to attribute a category. The adopted value for k is 1, being the default value for this parameter. Figure 4.4 presents the accuracy results related with the word and Alphabetic tokenizer.
Figure 4.5: Accuracy of Word Tokenizer vs Alphabetic Tokenizer with KNN
One more time the results with Alphabetic tokenizer are higher. The use of the Word tokenizer leads to an accuracy of 53%, while with the Alphabetic tokenizer the accuracy is 57%. Table 4.7 shows the results of the other metrics.
0% 10% 20% 30% 40% 50% 60% 70% 80% 90%